
![]()
Where to Put It All: Storing Sensor Data
If you have had success with the projects thus far in the book, you have at your disposal several forms of sensor and data-aggregate nodes. In essence, you have the basic building blocks for constructing a sensor network to monitor and record temperature data. It would not take much more work to add nodes for other environmental sensors such as humidity or barometric pressure. Indeed, the basic sensor node you have built can host a variety of sensors.
If you have run the example projects and experimented with the challenges, no doubt you have noticed that a lot of data is being generated. What do you do with that data? Is it meaningful only at the instant it is generated, or do you think it is more likely that you would want to store the data and examine it later? For example, if you want to know the temperature range for your workshop on a monthly basis throughout the year, logically you need data from an entire year1 to tabulate and average.
Arduino boards don’t have built-in storage devices. Raspberry Pi boards come with a Secure Digital (SD) drive and can accept USB-based storage devices where you can store data, but what do you do with the data from your Arduino-based nodes?
This chapter examines the available storage methods and gives examples of how to store data using those methods. Sample projects are provided to illustrate the mechanisms and code, but I omit the sensor-specific code for brevity.
Sensor data can come in several forms. Sensors can produce numeric data consisting of floating-point numbers or sometimes integers. Some sensors produce more complex information that is grouped together and may contain several forms of data. Knowing how to interpret the values read is often the hardest part of using a sensor. In fact, you saw this in a number of the sensor node examples. For example, the temperature sensors produced values that had to be converted to scale to be meaningful.
Although it is possible to store all the data as text, if you want to use the data in another application or consume it for use in a spreadsheet or statistical application, you may need to consider storing it either in binary form or in a text form that can be easily converted. For example, most spreadsheet applications can easily convert a text string like “123.45” to a float, but they may not be able to convert “12E236” to a float. On the other hand, if you plan to write addition code for your Arduino sketches or Raspberry Pi Python scripts to process the data, you may want to store the data in binary form to avoid having to write costly (and potentially slow) conversion routines.
But that is only part of the problem. Where you store the data is a greater concern. You want to store the data in the form you need but also in a location (on a device) that you can retrieve it from and that won’t be erased when the host is rebooted. For example, storing data in main memory on an Arduino is not a good idea. Not only does it consume valuable program space, but it is volatile and will be erased when the Arduino is powered off.
The Raspberry Pi offers a better option. You can easily create a file and store the data on the root partition or in your home directory on the SD card. This is nonvolatile and does not affect the operation of the Raspberry Pi operating system. The only drawback is that it has the potential to result in too little disk space if the data grows significantly. But the data would have to grow to nearly two gigabytes (for a 2GB SD card) before it would threaten the stability of the operating system (although that can happen).
So what are your options for storing data with Arduino? Are there any other possibilities with the Raspberry Pi? There are two types of storage to consider: local and remote. Local storage includes any method that results in the data being stored with the node: for example, storing data on the SD card on the Raspberry Pi. Remote storage includes any method where the data is stored on a device or medium that is not directly connected to the node: for example, storing data on a different node or even on a server connected to the Internet.
STORING DATE AND TIME WITH SAMPLES
Neither the Arduino nor the Raspberry Pi has a real-time clock (RTC) on board. If you want to store your sensor data locally, you have to either store the data with an approximate date and time stamp or use an RTC module to read an accurate date/time value.
Fortunately, there are RTC modules for use with an Arduino or the Raspberry Pi. If your Raspberry Pi is connected to the Internet and you have enabled the network time synchronization feature, you do not need the RTC module. However, if your Raspberry Pi is not connected to the Internet, and you want to store accurate time data, you should consider using the RTC module.
The following sections examine the various local and remote storage options available for the Arduino and Raspberry Pi.
Local Storage Options for the Arduino
Although it is true that the Arduino has no onboard storage devices,2 there are two ways you can store data locally for the Arduino. You can store data in a special form of nonvolatile memory or on an SD card hosted via either a special SD card shield or an Ethernet shield (most Ethernet shields have a built-in SD card drive).
![]() Note If you are truly inventive (or perhaps unable to resist a challenge), you can use some of the communication protocols to send data to other devices. For example, you could use the serial interface to write data to a serial device.
Note If you are truly inventive (or perhaps unable to resist a challenge), you can use some of the communication protocols to send data to other devices. For example, you could use the serial interface to write data to a serial device.
The following sections discuss each option in greater detail. Later sections present small projects you can use to learn how to use these devices for storing data.
The most common form of nonvolatile memory available to the Arduino is electrically erasable programmable read-only memory (EEPROM—pronounced “e-e-prom” or “double-e prom”). EEPROMs are packaged as chips (integrated circuits). As the name suggests, data can be written to the chip and is readable even after a power cycle but can be erased or overwritten.
Most Arduino boards have a small EEPROM where the sketch is stored and read during power up. If you have ever wondered how the Arduino does that, now you know. You can write to the unused portion of this memory if you desire, but the amount of memory available is small (512KB). You can also use an EEPROM and wire it directly to the Arduino via the I2C protocol to overcome this limitation.
Writing to and reading from an EEPROM is supported via a special library that is included in the Arduino IDE. Due to the limited amount of memory available, storing data in the EEPROM memory is not ideal for most sensor nodes. You are likely to exceed the memory available if the data you are storing is large or there are many data items per sample.
You also have the issue of getting the data from the EEPROM for use in other applications. In this case, you would have to build not only a way to write the data but also a way to read the data and export it to some other medium (local or remote).
That is not to say that you should never use EEPROM to store data. Several possible reasons justify storing data in EEPROM. For example, if your sensor node is likely to be isolated, or connectivity to other nodes is limited, you may want to use an EEPROM to temporarily store data while the node is offline. In fact, you could build your sketch to detect when the node goes offline and switch to the EEPROM at that time. This way, your Arduino-based sensor node can continue to record sensor data. Once the node is back online, you can write your sketch to dump the contents of the EEPROM to another node (remote storage).
SD Card
You can also store (and retrieve) data on an SD card. The Arduino IDE has a library for interacting with an SD drive. In this case, you would use the library to access the SD drive via an SD shield or an Ethernet shield.
Storing data on an SD card is done via files. You open a file and write the data to it in whatever format is best for the next phase in your data analysis. Examples in the Arduino IDE and elsewhere demonstrate how to create a web server interface for your Arduino that displays the list of files available on the SD card.
Compared to EEPROMs, SD cards store many times more data. You can purchase high-density SD cards that exceed 128GB of storage space. That’s a lot of sensor data!
You may choose to store data to an SD card in situations where your sensor node is designed as a remote sensor with no connectivity to other nodes, or you can use it as a backup-logging device in case your sensor node is disconnected or your data-aggregator node goes down. Because the card is removable and readable in other devices, you can read it on another device when you want to use the data.
Using an SD card means you can move the data from the sensor node to a computer simply by unplugging the card from the Arduino and plugging it in to the SD card reader in your computer.
Project: Saving Data in Nonvolatile Memory
Recall that you can use the local EEPROM on an Arduino to store data. There are some excellent examples in the Arduino IDE that I encourage you to experiment with at your leisure. They are located under the Examples menu under the EEPROM submenu. You need only an Arduino and your laptop to experiment with writing to and from the EEPROM on the Arduino.
Rather than rehash the example sketch for using the built-in EEPROM, this section outlines a project to use an external EEPROM to store data. Unlike the local EEPROM, which uses a dedicated library to interact with, an external EEPROM uses the I2C communication protocol.
The hardware for this project consists of a 24LC256 or 24LC512 EEPROM chip like those from SparkFun (www.sparkfun.com/products/525), a pushbutton, jumper wires, and an Arduino. Figure 5-1 shows a typical 24LC256 pin-mount EEPROM chip.

Figure 5-1. I2C EEPROM chip (courtesy of SparkFun)
The pushbutton will allow you to reset the memory on the chip. Doing so erases the data values stored, resetting the memory configuration for reuse. You will find this feature particularly handy when using the sketch for the first time, debugging problems, and reusing the chip once memory has been read and stored on another medium.
The chip communicates via an I2C bus. You can set the address for the chip by connecting ground or power to pins A0–A2, as shown in Figure 5-2. You can think of this as a binary number, where connecting ground to all three pins is the lowest address available (0x50) and power to all three pins is the highest address available (0x57). Table 5-1 shows the possible addresses and connections required. You use the lowest address (0x50) by connecting ground to all three pins.

Figure 5-2. Pinout of the I2C EEPROM
Table 5-1. Setting the Address of the I2C EEPROM

Now that you understand how to address the chip, let’s connect it to your Arduino. Begin by placing the chip in a breadboard with the half circle pointing to the right. This establishes pin 1 as the upper-right pin. Connect a ground wire to all four pins on the top side of the chip. These are pins 1–4, as shown in Figure 5-2.
Next, connect pin 5 (SDA) to pin 4 on the Arduino and pin 6 (SCL) to pin 5 on the Arduino. Connect a ground wire to pin 7. Then connect positive voltage (+5V) to pin 8. Finally, connect the pushbutton to pin 2 on one side and power on the other. Use a 10K Ohm resistor to pull the button HIGH (connect it to positive voltage) as you did in a previous project. See Figure 5-3 for a detailed wiring diagram. Be sure to double-check your connections.

Figure 5-3. Wiring the EEPROM to the Arduino
![]() Note If you are using the Leonardo board, you need to use the SDC and SCL pins located near the USB port.
Note If you are using the Leonardo board, you need to use the SDC and SCL pins located near the USB port.
With the wiring in place, you are ready to start writing a sketch to read and write data. Rather than write a script to simply store data, in this example you write a sketch to let you write data to and read it from the chip. You also include a reset operation to allow you to overwrite any memory.
You add the read methods so that you can create additional sketches to read data, should you wish to review the data, move the chip (data) to another Arduino, or use another sketch to process the data.
Let’s get started. You use the I2C library (called Wire) to interact with the EEPROM. Open a new sketch, and enter the following:
#include <Wire.h>

#define FIRST_SAMPLE 0x02  // First position of first sample
#define MEM_ADDR 0x50      // EEPROM address
#define BUTTON_PIN 0x02    // Button pin
#define EEPROM_SIZE 32768  // Size of 24LC256
#define SAMPLE_BYTES 2     // Size of sample in bytes

int next_index = 0;        // Address of first sample
These statements include the Wire library and define a number of constants you use in the sketch. Notice that you have an address for the first sample (the position in memory on the chip), the address for the chip, a pin for the pushbutton, the maximum size (for the 256 chip), and the number of bytes per sample.
You need a number of methods. You need the ability to write a single byte to memory, store a sample, read a byte, and read a sample. Let’s look at the simplest forms of these methods—the read byte method:
![]() Note In the following code, address refers to the address of the EEPROM chip, and index is the location in memory that you want to access.
Note In the following code, address refers to the address of the EEPROM chip, and index is the location in memory that you want to access.
byte read_byte(int address, unsigned int index)  {
  byte data = 0xFF;

  Wire.beginTransmission(address);
  Wire.write((int)(index >> 8));   // MSB
  Wire.write((int)(index & 0xFF)); // LSB
  Wire.endTransmission();

  Wire.requestFrom(address,1);

  if (Wire.available()) {
    data = Wire.read();
  }
  return data;
}
Notice the process for communicating with the chip. First you start a transmission with the chip, send the address that you intend to read, and then end the transmission. The address is a two-byte value, and the statements show you how to manipulate the bytes to form a word (two bytes). The next method, requestFrom() tells the chip you want to read a single byte. If the chip is ready, you read the data. Finally, you return the value to the caller.
You use the same format for every operation you wish to use with the chip. Let’s look at the write method to write a single byte to the chip:
void write_byte(int address, unsigned int index, byte data) {
  Wire.beginTransmission(address);
  Wire.write((int)(index >> 8));   // MSB
  Wire.write((int)(index & 0xFF)); // LSB
  Wire.write(data);
  Wire.endTransmission();

  delay(5);
}
Notice that you have the same setup—you begin the transmission and set the value at the index specified. What differs is that you send the data (write it) before you end the transmission.
But how do you know what is written to which address (or index)? Rather than just write data willy-nilly or in some illogical order, let’s use the first byte at index 0 to store the number of data samples (or rows) and the second byte to store how many bytes each sample consumes (or columns). In this way, you make the data easier to read because it is uniform and easier to manage on a reboot.
In fact, let’s add a new method to display the contents of the data in the EEPROM on startup. Recall for the Arduino that if you want to execute a method once at startup, you place it in the setup() method. The following shows how you can use the existing read method to read data from the EEPROM and display the information in the serial monitor.
This technique makes it easy to verify that the code is working by running the dump method on startup. In essence, you create a crude self-diagnostic mechanism that you can use to check the state of the data. If you see anything other than valid data at startup, you know something has gone wrong:
void setup(void) {
  int bytes_per_sample = SAMPLE_BYTES;
  byte buffer[SAMPLE_BYTES];

  Serial.begin(115200);
  Wire.begin();

  next_index = read_byte(MEM_ADDR, 0);
  bytes_per_sample = read_byte(MEM_ADDR, 1);
  ...
}
But wait! What does this code do if you encounter an uninitialized EEPROM? In that case, you can create a special method to initialize the EEPROM. The following shows the initialize() method:
void initialize(int address) {
  // Clear memory
  // NOTE: replace '10' with EEPROM_SIZE to erase all data
  for (int i = 0; i < 10; i++) {
    write_byte(address, i, 0xFF);
  }
  write_byte(address, 0, FIRST_SAMPLE);
  write_byte(address, 1, SAMPLE_BYTES);
  Serial.print("EEPROM at address 0x");
  Serial.print(address, HEX);
  Serial.println(" has been initialized.");
}
You use the write_byte() method to write 0 for the number of bytes and the constant defined earlier for the number of bytes per sample. The method begins by writing 0xff to the first 10 bytes to ensure that you have no data stored; then the number of bytes is written to index 0 and the number of bytes per sample to index 1. You add some print statements for feedback.
But how does this method get called? One way would be to put it in your setup() method as the first call after the call to initialize the Wire library, but that would mean you would have to comment out the other methods, load the sketch, execute it, remove the method, and reload. That seems like a lot of extra work. A better way is to trigger this method with a pushbutton. Code to do this is placed in the loop() method, as shown here:
if (digitalRead(BUTTON_PIN) == LOW) {
  initialize(MEM_ADDR);
  delay(500); // debounce
}
Now that you can read and write a byte and initialize the chip, you also need to be able to read a sample in case you want to use the chip in another sketch to process the data. The following shows a method to read a sample:
void read_sample(int address, unsigned int index, byte *buffer) {
  Wire.beginTransmission(address);
  Wire.write((int)(index >> 8));   // MSB
  Wire.write((int)(index & 0xFF)); // LSB
  Wire.endTransmission();

  Wire.requestFrom(address, SAMPLE_BYTES);
  for (int i = 0; i < SAMPLE_BYTES; i++) {
    if (Wire.available()) {
      buffer[i] = Wire.read();
    }
  }
}
Notice that you form a sequence of events similar to read_byte(). But rather than read a single byte, you use a loop to read the number of bytes for a sample.
You also need a method to store (write) a sample to the chip:
void write_sample(int address, unsigned int index, byte *data) {
  Wire.beginTransmission(address);
  Wire.write((int)(index >> 8));   // MSB
  Wire.write((int)(index & 0xFF)); // LSB
  Serial.print("START: ");
  Serial.println(index);
  for (int i = 0; i < SAMPLE_BYTES; i++) {
    Wire.write(data[i]);
  }
  Wire.endTransmission();

  delay(5); // wait for chip to write data
}
Once again, the method is similar to the write_byte() method, but you use a loop to write the bytes for a sample. Notice that you include a debug statement to show the starting index used. You do this so that you can see the value increase if you run the sketch multiple times.
![]() Note You may have noticed that I duplicated the code among the *_byte() and *_sample() methods. I did so for clarity of the code, but it isn’t strictly necessary. For example, you could consolidate the code if you changed the *_sample() methods to use an additional parameter indicating how many bytes to read/write. I leave this optimization to you as an exercise.
Note You may have noticed that I duplicated the code among the *_byte() and *_sample() methods. I did so for clarity of the code, but it isn’t strictly necessary. For example, you could consolidate the code if you changed the *_sample() methods to use an additional parameter indicating how many bytes to read/write. I leave this optimization to you as an exercise.
There is one more method to consider. Recall that you use a counter stored in index 0 to record the number of samples written. The write_sample() method simply writes a sample at a specific index. What you need is a method that manages the sample counter and stores the sample. Thus, you create a record_sample() method to handle the higher-level operation:
void record_sample(int address, int data) {
  byte sample[SAMPLE_BYTES];

  sample[0] = data >> 8;
  sample[1] = (byte)data;
  write_sample(address, next_index, sample);
  next_index += SAMPLE_BYTES;
  write_byte(address, 0, next_index);
}
Notice how you keep track of the number of samples and the next index for the next sample. You use the variable you created earlier and increment it by the number of bytes in the sample. This way, you always know what the next address is without reading the number of samples first and calculating the index. The last method updates the number of samples value.
Now that you have all the building blocks, Listing 5-1 shows the completed code for this sketch. Save the sketch as external_eeprom. Notice that in the sketch you do not include any code to read from sensors. I left this out for brevity and included some debug statements (shown in bold) in the setup() method instead to show how you record samples. Be sure to remove these statements when you modify the sketch for use with a sensor.
Listing 5-1. Storing and Retrieving Data on an External EEPROM
/**
  Sensor Networks Example Arduino External EEPROM data store

  This project demonstrates how to save and retrieve sensor data
  to/from an external EEPROM chip.
*/

#include <Wire.h>

#define FIRST_SAMPLE 0x02 // Index of first sample
#define MEM_ADDR 0x50     // EEPROM address
#define BUTTON_PIN 0x02   // Button pin
#define EEPROM_SIZE 32768 // Size of 24LC256
#define SAMPLE_BYTES 2    // Size of sample in bytes

int next_index = 0;       // Index of next sample

/* Initialize the chip erasing data */
void initialize(int address) {
  // Clear memory
  // NOTE: replace '10' with EEPROM_SIZE to erase all data
  for (int i = 0; i < 10; i++) {
    write_byte(address, i, 0xFF);
  }
  write_byte(address, 0, FIRST_SAMPLE);
  write_byte(address, 1, SAMPLE_BYTES);
  Serial.print("EEPROM at address 0x");
  Serial.print(address, HEX);
  Serial.println(" has been initialized.");
}

/* Write a sample to the chip. */
void write_sample(int address, unsigned int index, byte *data) {
  Wire.beginTransmission(address);
  Wire.write((int)(index >> 8));   // MSB
  Wire.write((int)(index & 0xFF)); // LSB
  Serial.print("START: ");
  Serial.println(index);
  for (int i = 0; i < SAMPLE_BYTES; i++) {
    Wire.write(data[i]);
  }
  Wire.endTransmission();

  delay(5); // wait for chip to write data
}

/* Write a byte to the chip at specific index (offset). */
void write_byte(int address, unsigned int index, byte data) {
  Wire.beginTransmission(address);
  Wire.write((int)(index >> 8));   // MSB
  Wire.write((int)(index & 0xFF)); // LSB
  Wire.write(data);
  Wire.endTransmission();

  delay(5);
}

/* Read a sample from an index (offset). */
void read_sample(int address, unsigned int index, byte *buffer) {
  Wire.beginTransmission(address);
  Wire.write((int)(index >> 8));   // MSB
  Wire.write((int)(index & 0xFF)); // LSB
  Wire.endTransmission();

  Wire.requestFrom(address, SAMPLE_BYTES);
  for (int i = 0; i < SAMPLE_BYTES; i++) {
    if (Wire.available()) {
      buffer[i] = Wire.read();
    }
  }
}

/* Read a byte from an index (offset). */
byte read_byte(int address, unsigned int index)  {
  byte data = 0xFF;

  Wire.beginTransmission(address);
  Wire.write((int)(index >> 8));   // MSB
  Wire.write((int)(index & 0xFF)); // LSB
  Wire.endTransmission();

  Wire.requestFrom(address,1);

  if (Wire.available()) {
    data = Wire.read();
  }
  return data;
}

/* Save a sample to the data chip and increment next address counter. */
void record_sample(int address, int data) {
  byte sample[SAMPLE_BYTES];

  sample[0] = data >> 8;
  sample[1] = (byte)data;
  write_sample(address, next_index, sample);
  next_index += SAMPLE_BYTES;
  write_byte(address, 0, next_index);
}

void setup(void) {
  int bytes_per_sample = SAMPLE_BYTES;
  byte buffer[SAMPLE_BYTES];
  delay(5000);
  Serial.begin(115200);
  Wire.begin();

  next_index = read_byte(MEM_ADDR, 0);
  bytes_per_sample = read_byte(MEM_ADDR, 1);
  Serial.println("Welcome to the Arduino external EEPROM project.");
  Serial.print("Byte pointer: ");
  Serial.println(next_index, DEC);
  Serial.print("Bytes per sample: ");
  Serial.println(bytes_per_sample, DEC);
  Serial.print("Number of samples:");
  Serial.println((next_index/bytes_per_sample)-1, DEC);

  // Add some sample data
  record_sample(MEM_ADDR, 6011);
  record_sample(MEM_ADDR, 8088);

  // Example of how to read sample data - read last 2 values
  read_sample(MEM_ADDR, next_index-(SAMPLE_BYTES * 2), buffer);
  Serial.print("First value: ");
  Serial.println((int)(buffer[0] << 8) + (int)buffer[1]);
  read_sample(MEM_ADDR, next_index-SAMPLE_BYTES, buffer);
  Serial.print("Second value: ");
  Serial.println((int)(buffer[0] << 8) + (int)buffer[1]);
}

void loop() {
  if (digitalRead(BUTTON_PIN) == LOW) {
    initialize(MEM_ADDR);
    delay(500); // debounce
  }
  //
  // Read sensor data and record sample here
  //
}
Notice that you include some additional statements for communicating the progress of the sketch via the serial monitor. Take some time to examine these so that you are familiar with what to expect when the sketch runs.
![]() Tip If you want to write protect the chip, disconnect the WP pin. Doing so makes the chip read only.
Tip If you want to write protect the chip, disconnect the WP pin. Doing so makes the chip read only.
To test the sketch, be sure the code compiles and you have your hardware set up correctly. When you have a sketch that compiles, upload it to your Arduino and launch a serial monitor.
When the sketch is loaded for the first time, you need to press the button to initialize the EEPROM. This is because the values on the chip are uninitialized for a new chip. You only have to do this the first time you run the sketch. Once you’ve done that, you should see output similar to that in Figure 5-4.

Figure 5-4. Example output
Did you see something similar? If you run the sketch again (for example, by pressing the Reset button), you should see the value for the start index (from the write_sample() method) increase. Go ahead and give it a try.
Once you’ve done it a few times, press the pushbutton and notice what happens. As you can see in Figure 5-4, the start index is reset and the next samples are store at the beginning of memory.
For More Fun
The sketch for this project has a lot of promise. No doubt you can think of a number of things you could do with this code. The following are some suggestions for improving the code and experimenting with using an external EEPROM:
- Add some visual aids for use in embedded projects (cases with no serial monitor capability). You can add an LED that illuminates when there is data on the chip. You can also add a set of 7-segment LEDs to display the number of data samples stored.
- Improve the code for reuse. Begin by removing the redundancy described earlier in the read and write methods, and then move the code to a class to make it easier to use the EEPROM in other sketches.
- Add a second EEPROM chip to expand the amount of storage available. Hint: you need to set each chip to a different address, but the methods used are the same.
- Perhaps a bit easier and more in line with the hardware-hacking element of Arduino is moving the EEPROM to another Arduino and reading all the values stored. This demonstrates the nonvolatile nature of EEPROM chips.
![]() Caution Use appropriate grounding to avoid electrostatic discharge (ESD) damage to the chip.
Caution Use appropriate grounding to avoid electrostatic discharge (ESD) damage to the chip.
Project: Writing Data to an SD Card
Aside from an EEPROM chip, you can also store data locally on an Arduino by writing the data to an SD drive. The SD drive is a good choice for storing data because the data is stored in files, which other devices can read (and write to).
For example, although writing data to an EEPROM chip is not difficult, reading that chip on a personal computer requires writing a sketch for the Arduino to transfer the data. However, the SD card can be removed from the Arduino (once files are closed) and inserted in an SD drive connected to a personal computer, allowing you to read the files directly. Thus, the SD card makes a better choice for sensor networks where your sensor nodes are not connected via a network or other wireless connections.
There are several choices for adding an SD card reader to an Arduino. Two of the most popular are the Arduino Ethernet shield and the microSD shield from SparkFun (www.sparkfun.com/categories/240). If you use the Arduino Ethernet shield, you can use the networking capabilities and the SD card together. A number of similar devices are available from a variety of vendors.
Adafruit also has a Data Logging shield for Arduino with an onboard SD drive (www.adafruit.com/product/1141). The Data Logging shield also includes an RTC, making it possible to store date and time along with the sample. I discuss using an RTC in the next project.
![]() Tip Both the microSD shield and the Data Logging shield offer a prototyping area that you can use to mount your sensor components or even an XBee module.
Tip Both the microSD shield and the Data Logging shield offer a prototyping area that you can use to mount your sensor components or even an XBee module.
An SD drive allows you to create a hybrid node where you store data locally as well as transmit it to another node in the network. This redundancy is one of the ways you can build durability in to your sensor network. For example, if a node loses its connection to another node via the network, it can still record its data locally. Although it is a manual process to recover the data (you must go get the SD card), the fact that the data is recoverable at all means the network can survive network failures without losing data.
It is possible to use an EEPROM as a local storage backup option, but an EEPROM is harder to use, is not as durable as an SD card, does not have the same storage capacity, and is not as easy to use in other devices.
There is one other very important thing to consider concerning building a durable sensor node. Having a local backup of the data may not be helpful if you do not know when the data was stored. The Arduino does not have any time-keeping capability beyond a limited accuracy cycle time. Thus, if you store data locally without a timestamp of any kind that you can relate to other data, the samples taken may not be meaningful beyond the sequence itself (the order of the values).
To mitigate this, you can add an RTC module to the Arduino. The RTC allows you to store the date and time a sample was taken. This information may be critical if you are trying to plot values over time or want to know when a spurious or otherwise interesting event took place.
Hardware Setup
The hardware for this project uses the Arduino Ethernet shield, the microSD shield from SparkFun (with an SD card installed), or the Data Logging shield from Adafruit. For simplicity, I used the Arduino Ethernet shield and show the code changes necessary to use the microSD shield or the Data Logging shield (via #define statements).
You also need the RTC module. There is an excellent product from Adafruit that performs very well and includes an onboard battery that powers the clock even when the Arduino is powered down. Adafruit’s DS1307 Real Time Clock breakout board kit (www.adafruit.com/products/264) is an outstanding module to add to your project. Figure 5-5 shows the Adafruit RTC module.

Figure 5-5. DS1307 Real Time Clock breakout board (courtesy of Adafruit)
SparkFun also has a product named Real Time Clock Module (www.sparkfun.com/products/99) that uses the same DS1307 chip and interface as the Adafruit offering. You can use either in this project.
![]() Note The Adafruit RTC module requires assembly. The RTC module from SparkFun does not.
Note The Adafruit RTC module requires assembly. The RTC module from SparkFun does not.
The RTC module uses an I2C interface that is easy to connect to the Arduino. Simply connect 5V power to the 5V pin, ground to the GND pin, the SDA pin to pin 4 on the Arduino, and the SCL pin to pin 5 on the Arduino. Figure 5-6 shows the wiring diagram for connecting the RTC module.

Figure 5-6. Arduino with an Ethernet shield and RTC module
![]() Note If you are using the Leonardo board, you have to use the new SCL/SCA pins located next to AREF, GND, and pin 13 nearest the USB connector.
Note If you are using the Leonardo board, you have to use the new SCL/SCA pins located next to AREF, GND, and pin 13 nearest the USB connector.
Notice that the Ethernet shield is installed on the Arduino. Wiring connections would be the same if you were using the SparkFun microSD shield.
With the wiring in place, you are ready to start writing a sketch to write data to the SD card. But first, you must download and install the RTC library from Adafruit (https://github.com/adafruit/RTClib). Click the Download Zip button, extract the archive, rename the folder RTClib, and move it to your Arduino/Library folder.
Once the library is downloaded and installed (and you’ve restarted the Arduino IDE), you can begin a new sketch named sd_file_example. Enter the following code to specify the modules you need to use in the sketch. You need the Wire, RTC, SD, and String libraries:
#include <Wire.h>
#include <RTClib.h>
#include <SD.h>
#include <String.h>
Next, you need to define the pin to use to communicate with the SD drive. The following are the definitions for all three SD drive options described earlier. I use the Ethernet shield in this example; but if you are not using the Ethernet shield, you can comment out that line and uncomment out the line that corresponds with the shield you are using. You also include a definition for the name of the file you use to store samples:
// Pin assignment for Arduino Ethernet shield
#define SD_PIN 4
// Pin assignment for Sparkfun microSD shield
//#define SD_PIN 8
// Pin assignment for Adafruit Data Logging shield
//#define SD_PIN 10

// Sensor data file - require 8.33file name
#define SENSOR_DATA "sensdata.txt"
Now you declare some variables. You need one for the RTC module and one for the file you use on the SD drive:
RTC_DS1307 RTC;
File sensor_data;
With the preliminaries complete, you need a method to save a sensor sample to the SD card. The method must read the date and time from the RTC module, accept the sample as a parameter, and store the data. In this example, you place the date and time first, followed by the sample value. Name this method record_sample().
Reading from the RTC module is easy with the RTC library. You simply use the library to get the current date and time with the now() method. From there, you can call methods to get the month, day, year, hour, and so on. Forming the string to write to the file can be done in a variety of ways. I used the string class to construct the string. Feel free to use any other method you favor instead:
// Capture the date and time
DateTime now = RTC.now();
Writing to the file is very easy. You simply open the file in write mode (FILE_WRITE) that automatically permits any writes to be written to the end of the file (append). This is nice because you don’t have to worry about seeking or finding out where a file pointer is in the file. Opening the file returns a file object instance, which you can use to write data. Writing to the file (once it is opened) requires only a single method call. The following shows a simplified set of calls to open a file using the SD library and write data. I leave the details of the record_sample() method for you to explore in Listing 5-2:
// Open the file
sensor_data = SD.open(SENSOR_DATA, FILE_WRITE);
// Save the data
sensor_data.write(1234);
sensor_data.write("
");
// Close the file
sensor_data.close();
Of course, you need a few things to properly set up the components and libraries. The setup() method should contain, at a minimum, initialization for the Serial, Wire, and RTC libraries (by calling their begin() methods) and a call to the SD library to start communication with the SD drive. The following is an excerpt of the code needed for these steps. Notice that you also initialize the date and time for the RTC based on the last compiled date and time of the sketch (effectively, the date and time it was uploaded):
void setup () {
  Serial.begin(9600);
  delay(5000);  //Give time for user to connect serial monitor

  Wire.begin();
  RTC.begin();

  if (!RTC.isrunning()) {
    Serial.println("RTC is NOT running!");
    // Set time to date and time of compilation
    RTC.adjust(DateTime(__DATE__, __TIME__));
  }

  // disable w5100 SPI
  pinMode(10,OUTPUT);
  digitalWrite(10,HIGH);

  // Initialize the SD card.
  Serial.print("Initializing SD card...");
  if (!SD.begin(SD_PIN)) {
    Serial.println("initialization failed!");
    return;
  }
  Serial.println("initialization done.");
...
}
![]() Note Notice that also you have code to turn off the Ethernet W5100 SPI interface. This is only necessary for the Ethernet shield and then only if you do not plan to use the networking capabilities.
Note Notice that also you have code to turn off the Ethernet W5100 SPI interface. This is only necessary for the Ethernet shield and then only if you do not plan to use the networking capabilities.
There is one other thing you might want to add. You may want to check to see if you can read the file on the SD card. It is not enough to simply initialize the SD library. It is possible the SD drive will communicate properly but you cannot open or create files on the card itself. Add the following to the setup() method as an extra check. In this case, you check to see whether the file exists and, if it does not, attempt to create the file. You print a message if you get an error on the open call:
// Check for file. Create if not present
if (!SD.exists(SENSOR_DATA)) {
  Serial.print("Sensor data file does not exit. Creating file...");
  sensor_data = SD.open(SENSOR_DATA, FILE_WRITE);
  if (!sensor_data) {
    Serial.println("ERROR: Cannot create file.");
  }
  else {
    sensor_data.close();
    Serial.println("done.");
  }
}
The loop() method is where you place calls to the record_sample() method. In this case, leave the loop() method empty for brevity. Feel free to add your own code to read sensors here and call the record_sample() method for each.
Listing 5-2 shows the complete code for this project. Although the explanation thus far has been about the key parts of the sketch, notice that the listing adds additional error-handing code to make sure the SD drive is initialized properly and the file exists and can be written.
Listing 5-2. Storing Data on an SD Card
/**
Sensor Networks Example Arduino SD card data store
This project demonstrates how to save sensor data to a
microSD card.
*/
#include <Wire.h>
#include <RTClib.h>
#include <SD.h>
#include <String.h>
// Pin assignment for Arduino Ethernet shield
#define SD_PIN 4
// Pin assignment for Sparkfun microSD shield
//#define SD_PIN 8
// Pin assignment for Adafruit Data Logging shield
//#define SD_PIN 10
// Sensor data file - require 8.3 file name
#define SENSOR_DATA "sensdata.txt"
RTC_DS1307 RTC;
File sensor_data;
void record_sample(int data) {
// Open the file
sensor_data = SD.open(SENSOR_DATA, FILE_WRITE);
if (!sensor_data) {
Serial.println("ERROR: Cannot open file. Data not saved!");
return;
}
// Capture the date and time
DateTime now = RTC.now();
String timestamp(now.month(), DEC);
timestamp += ("/");
timestamp += now.day();
timestamp += ("/");
timestamp += now.year();
timestamp += (" ");
timestamp += now.hour();
timestamp += (":");
timestamp += now.minute();
timestamp += (":");
timestamp += now.second();
timestamp += (" ");
// Save the sensor data
sensor_data.write(×tamp[0]);
String sample(data, DEC);
sensor_data.write(&sample[0]);
sensor_data.write(" ");
// Echo the data
Serial.print("Sample: ");
Serial.print(timestamp);
Serial.print(data, DEC);
Serial.println();
// Close the file
sensor_data.close();
}
void setup () {
Serial.begin(9600);
delay(5000); //Give time for user to connect serial monitor
Wire.begin();
RTC.begin();
if (!RTC.isrunning()) {
Serial.println("RTC is NOT running!");
// Set time to date and time of compilation
RTC.adjust(DateTime(__DATE__, __TIME__));
}
// disable w5100 SPI
pinMode(10,OUTPUT);
digitalWrite(10,HIGH);
// Initialize the SD card.
Serial.print("Initializing SD card...");
if (!SD.begin(SD_PIN)) {
Serial.println("initialization failed!");
return;
}
Serial.println("initialization done.");
// Check for file. Create if not present
if (!SD.exists(SENSOR_DATA)) {
Serial.print("Sensor data file does not exit. Creating file...");
sensor_data = SD.open(SENSOR_DATA, FILE_WRITE);
if (!sensor_data) {
Serial.println("ERROR: Cannot create file.");
}
else {
sensor_data.close();
Serial.println("done.");
}
}
// Record some test samples.
record_sample(1);
record_sample(2);
record_sample(3);
}
void loop () {
// Read sensor data here and record with record_sample()
}
I added debug statements to the setup() method for illustration purposes and to make sure the sketch works. Placing these calls in the setup() method permits you to load the sketch (or reboot the Arduino) and check the contents of the SD card to see if the code worked. If you place the statements in the loop() method, then depending on when you turn off your Arduino (unplug it), you may not know how many lines were added or even if the file were closed properly. Placing the record_sample() statements in the setup() method means you have expected output to check.
![]() Tip If you get SD drive initialization errors, check the pin assignment used in the definition section to make sure you are using the correct pin for your SD drive/shield.
Tip If you get SD drive initialization errors, check the pin assignment used in the definition section to make sure you are using the correct pin for your SD drive/shield.
If you encounter file-write or -open errors, make sure the SD card is formatted as a FAT partition, the SD card is not write protected, and you can create and read files on the drive using your personal computer.
Testing the Sketch
To test the sketch, be sure the code compiles and you have your hardware set up correctly. Once you have a sketch that compiles, upload it to your Arduino and launch a serial monitor. Figure 5-7 shows the expected output.

Figure 5-7. Sample output for the SD card sketch
![]() Note The first time you run the sketch, you may see a message about initializing the SD card and creating the file. This is normal. Subsequent runs (restarts of the Arduino) will show the output like that in Figure 5-7.
Note The first time you run the sketch, you may see a message about initializing the SD card and creating the file. This is normal. Subsequent runs (restarts of the Arduino) will show the output like that in Figure 5-7.
If you run the sketch a number of times as it is written, it will insert three rows at the end of the file each time the sketch is initialized. This is because you placed sample calls to record_sample() in the setup() method for debugging purposes. These calls would naturally be placed in the loop() method after you read your sensors. Listing 5-3 shows an example of the file contents after running the sketch (starting the Arduino) four times.
Listing 5-3. Example Sensor File Contents
6/29/2013 19:43:56 1
6/29/2013 19:43:56 2
6/29/2013 19:43:56 3
6/29/2013 19:46:54 1
6/29/2013 19:46:54 2
6/29/2013 19:46:54 3
6/29/2013 19:47:18 1
6/29/2013 19:47:18 2
6/29/2013 19:47:18 3
6/29/2013 19:47:19 1
6/29/2013 19:47:19 2
6/29/2013 19:47:19 3
If you examine the file and find more sets of entries than you expect, try deleting the data from the file, starting your Arduino, and then pressing the Reset button twice. When you look at the contents, you should see exactly three sets of entries (one for the initial start because the sketch was in memory to begin with, and once for each time you restarted the Arduino).
If you see only partial sets (fewer than three rows for each set), check to ensure that you are allowing the Arduino to start before powering it off. It is best to use the serial monitor and wait until all three statements are echoed to the monitor before shutting down the Arduino.
Should the case arise that your sketch compiles and no errors are shown in the serial monitor but the data file is empty, check to make sure the card is usable and not corrupt. Try reformatting the card with the FAT file format.
HANDLE WITH CARE
MicroSD cards are very fragile. They can be damaged easily if handled improperly or subjected to ESD or magnetic fields. If your card does not work properly and you cannot reformat it, it is possible that it is damaged beyond use. You can try using a formatting program from sdcard.org, but if it fails, your card is no longer viable. So far, this has happened to me only once.
Now that you have examined two primary methods for storing data locally on an Arduino, let’s look at the options available for the Raspberry Pi.
Local Storage Options for the Raspberry Pi
Because the Raspberry Pi is a personal computer, it has the capability to create, read, and write files. Although it may be possible to use an EEPROM connected via the GPIO header, why would you do that? Given the ease of programming and the convenience of using files, there is very little need for another form of storage.
You also know the Raspberry Pi can be programmed in a number of ways and with one of the most popular languages, Python.4 Working with files in Python is very easy and is native to the default libraries. This means there is nothing that you need to add to use files.
The following project demonstrates the ease of working with files in Python. The online Python documentation explains reading and writing files in detail (http://docs.python.org/2/tutorial/inputoutput.html#reading-and-writing-files).
One thing you will notice is that it doesn’t matters where the file is located—on the SD card or an attached USB drive. You only need know the path to the location (folder) where you want to store data and pass that to the open() method.
Savvy Python programmers5 know that the Python library contains additional libraries and classes for manipulating folders, navigating paths, and much more. For more information, examine the Python documentation for the OS and Sys libraries. For example, look for normpath() and the Path6 class.
Project: Writing Data to Files
This project demonstrates how easy it is to use files on the Raspberry Pi with Python. Because no additional hardware or software libraries are needed, I can skip those sections and jump directly into the code.
Start your Raspberry Pi, and log in. Open a new file with the following command (or similar):
nano file_io_example.py
You name the file with a .py extension to indicate that it is a Python script. Enter the following code in the file:
import datetime

my_file = open("/home/pi/sample_data.txt", "a+")
my_file.write("%s %d
" % (datetime.datetime.now(), 101))
my_file.close()
In this example, you first import the datetime. You use the datetime to capture the current date and time. Next, you open the file (notice that you are using the Pi users’ home directory), write a row to the file, and then close the file.
Notice the open() method. It takes two parameters—the file path and name and a mode to open the file. You use "a+" to append to the file (a) and create the file if it does not exist (+). Other values include r for reading and w for writing. Some of these can be combined: for example "rw+" creates the file if it does not exist and allows for both reading and writing data.
![]() Note Using write mode truncates the file. For most cases in which you want to store sensor samples, you use append mode.
Note Using write mode truncates the file. For most cases in which you want to store sensor samples, you use append mode.
For each execution, you should see one row with a slightly different time value corresponding to when the script was run. To execute the file, use the following command:
python ./file_io_example.py
Go ahead and try to run the script. If you get errors, check the code and correct any syntax errors. If you encounter problems opening the file (you see I/O errors when you run the script), try checking the permissions for the folder you are using. Try running the script a number of times, and then display the contents of the file. The following shows the complete sequence of commands for this project:
pi$ nano file_io_example.py
pi$ python ./file_io_example.py
pi$ python ./file_io_example.py
pi$ python ./file_io_example.py
pi$ more sample_data.txt
2013-07-07 21:35:08.794776 101
2013-07-07 21:35:09.641735 101
2013-07-07 21:35:10.304823 101
Did you get similar results? If not, correct any errors and try again until you do. As you can see from this simple example, it is very easy to write data to files using Python on the Raspberry Pi.
Remote Storage Options
Remote storage means the data is sent to another node or system for recording. This normally requires some form of communication or network connectivity to the remote system. Sensor networks by nature are connected and thus can take advantage of remote storage.
To give you an idea of what I am discussing, consider an Arduino sensor node with an XBee module connected to a Raspberry Pi–based node. Suppose also that you want to write your sample data to files. Rather than using an SD card on the Arduino node to store data, you could send that data to the Raspberry Pi–based node and store the data in a file there. The main motivation is that it is much easier to use files via Python on the Raspberry Pi. If you also factor in the possibility of having multiple Arduino sensor nodes with XBee modules, you can use the Raspberry Pi–based node as a data aggregate, storing all the data in a single file.
SINGLE FILE OR MULTIPLE FILES?
I sometimes get this question when discussing storing aggregate data. If your data is similar (for example, temperature), you can consider storing data from like sensors to the same file. However, if the data differs (such as temperature from one node and humidity from another), you should consider using different files. This makes reading the files easier because you don’t have to write code (or use tools) to separate the data.
But are you really talking about only storing data in files? The answer is no. There are a number of mechanisms for storing data remotely. Although storing data in files is the easiest form, you can also store data in the cloud or even on a remote database server.
If you are experienced with using databases for storing and retrieving data, this method will appeal to you—especially if you plan to use other tools to process the data later. For example, you may want to perform statistical analyses or create charts that track the samples over time. Because working with databases is a complex topic, I examine this form of remote storage in the next couple of chapters.
You have already seen how easy it is to use files, but what about storing data in the cloud? What is that about? Simply stated, storing data in the cloud involves using a cloud-based data storage service to receive your data and host it in some way. The most popular form presents the data for others on the Internet to view or consume for their own use.
The following section discusses storing sample data in the cloud using a popular cloud-based data-hosting service named Xively (https://xively.com/). Storing data in this manner is a key element in the concept of the Internet of Things (http://en.wikipedia.org/wiki/Internet_of_Things). You see example projects for using Xively on both the Arduino and the Raspberry Pi.
Storing Data in the Cloud
Unless you live in a very isolated location, you have likely been bombarded with talk about the cloud. Perhaps you’ve seen advertisements in magazines and on television, or read about it in other books, or attended a seminar or conference. Unless you’ve spent time learning what cloud means, you are probably wondering what all the fuss is about.
Simply stated,7 the cloud is a name tagged to services available via the Internet. These can be servers you can access (running as a virtual machine on a larger server), systems that provide access to a specific software or environment, or resources such as disks or IP addresses that you can attach to other resources. The technologies behind the cloud include grid computing (distributed processing), virtualization, and networking. The correct scientific term is cloud computing. Although a deep dive into cloud computing is beyond the scope of this book, it is enough to understand that you can use cloud computing services to store your sensor data. In this case, you can use Xively.
![]() Tip Don’t believe all the hype or sales talk about any product that includes “cloud” in its name. Cloud computing services and resources should be accessible via the Internet from anywhere, available to you via subscription (fee or for free), and permit you to consume or produce and share the data involved. Also, consider the fact that you must have access to the cloud to get to your data. Thus, you have no alternative if the service is unreachable (or down).
Tip Don’t believe all the hype or sales talk about any product that includes “cloud” in its name. Cloud computing services and resources should be accessible via the Internet from anywhere, available to you via subscription (fee or for free), and permit you to consume or produce and share the data involved. Also, consider the fact that you must have access to the cloud to get to your data. Thus, you have no alternative if the service is unreachable (or down).
Xively provides a host of platform as a service products for use with Internet of Things projects. One of those products is the ability to store data and provide trend views of the data. That is, you can upload data to Xively and see a graph that plots the values over time. For sensor networks, this means you can see changes in samples visually. For example, if you were to plot temperature readings taken over the course of a week, you could spot a shift in the values by seeing a dip or spike in the line graph.
Although Xively offers a number of products available via paid subscription, there is a free access level (called a developer account) that permits users to store data for a limited time. Currently, data is saved for a maximum of 30 days, and you can connect up to 5 devices. Complete details about a developer account are listed on the Xively account information page (https://xively.com/pricing/#developer-account).
WHAT ABOUT PACHUBE OR COSM?
If you have read about a product and service called Pachube (pronounced patch bay) or one called Cosm that sounds a lot like Xively, there is a good reason for this. Xively is the new name for Cosm, which was once named Pachube. In the fast-paced world of startups and Internet technology, name and ownership or custodial changes are not uncommon.
Any books or references to these earlier names are not entirely out of date and may still be useful to read to get ideas on what type of data to host and present. For example, the latest Arduino IDE has example projects for Pachube that are still relevant.
Xively works via an application programming interface (API). Xively provides API libraries for a wide range of platforms including the Arduino and Python. You use the Python library for your Raspberry Pi.
The API permits you to connect to your Xively account via a special access (called an API key—discussed shortly) and save data to a specific location (called a channel). You can then log in to your Xively account and view the stored data.
The following section provides a quick walkthrough for getting up and running with Xively. Xively also provides a guided tour of using its services with greater detail about the concepts and things you can access. After you complete the next section, it may be helpful to view the 10-minute test drive (https://xively.com/testdrive/) to reinforce the concepts.
Getting Started with Xively
To use Xively, you must first sign up for a developer’s account. Go to https://xively.com/signup/ and fill in the form, including a desired username and your e-mail address; choose a password; and complete a short questionnaire (your name and zip code are mandatory). Then click Sign Up.
You must wait to log in until you have received an e-mail from Xively to activate your account. Click the link in the e-mail and log in, and you are taken to the developer home page and asked to add a device. Click Add Device. The form is shown in Figure 5-8.
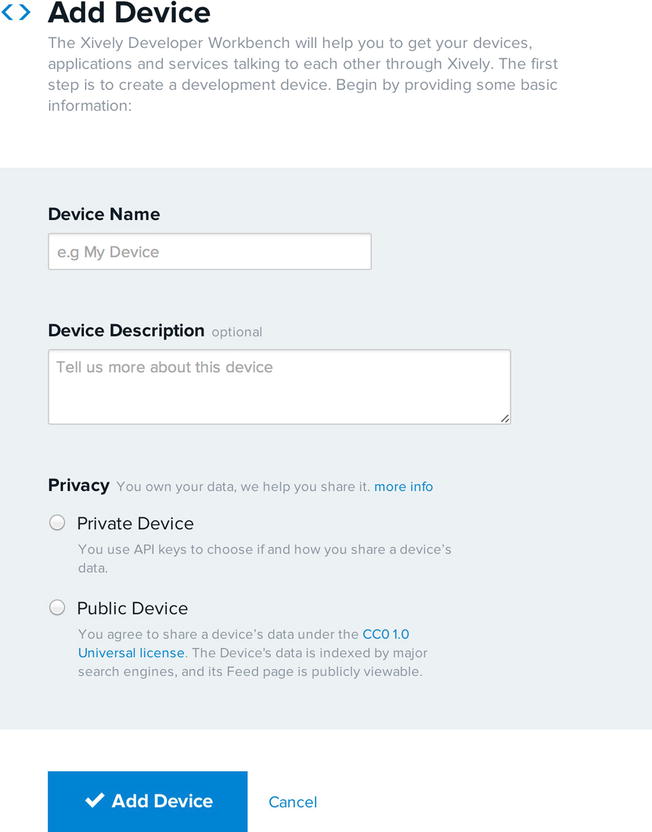
Figure 5-8. Adding a device for Xively
Enter a name for the device (for example, Arduino Sensor #1) and a description, and choose whether to make the device public (viewable by all) or private, which requires the use of special API keys. You should choose the private option for use with the projects in this book. API keys are created automatically, as you see after you enter the data for the device. When you have finished entering the data and choosing the access level, click Add Device. Go ahead and set up another device for a Raspberry Pi. Hint: click Develop on the menu at the top, and then click Add Device.
You also have a specific feed number for each device you create. This number is located near the top of the device home page. You need this number together with your API key to send data to the specific device on your account. Take a moment to note both the feed number and API key for your device. You use these in the example projects that follow.
When you create a device, you see options for creating channels. Channels are containers for the data you will upload. Each channel is a set of data plotted on a line graph. For sensor networks and the example projects that follow, you use one channel for each sensor sample. For example, you use one channel to record temperature in Celsius and another to record temperature in Fahrenheit.
You can create as many channels as you want or need. Be sure to note the exact spelling of the channel name, because you need it when you use the Xively API. To create a channel, click Add Channel on your device page. Figure 5-9 shows the small form for entering data for a channel.

Figure 5-9. Adding a channel to a device
Enter a name for the channel, one or more tags separated by a comma (used for searching), and an optional unit of measure and symbol. You can also set a baseline value for the channel. Once this data is entered, click Save Channel.
![]() Note A device hosted on Xively is called a feed. The Xively API also refers to a feed’s channel as a datastream.
Note A device hosted on Xively is called a feed. The Xively API also refers to a feed’s channel as a datastream.
That’s all you need to do to get started with Xively (at least, the barest of steps), but there is much more to Xively than setting up devices and channels. Be sure to view the 10-minute tour of Xively if you haven’t already.
Now that you have a Xively developer’s account and have set up your Arduino and Raspberry Pi devices, let’s explore how to use the Xively API.
Writing data to Xively is accomplished using a platform-specific library. Fortunately, there are libraries for the Arduino and the Raspberry Pi (via Python). Although it is possible to read and write data to and from a Xively feed, this section explores how to write (store) data. You can learn how to read data as an exercise, should you desire to use Xively as a temporary data store for later processing of the data.
The steps to write data to a Xively feed include the following. Although each of these is done slightly differently for each platform-specific library API, the flow is the same:
- Store your feed ID and API key. You store these as either constants or strings for use in connecting to Xively.
- Create an array of datastreams, and name each one. These identify the channels for the feed to which you write data. You store each datastream (channel) as a separate element.
- Make a connection to Xively for a specific feed. Connect to the Xively service, and prepare a protocol connection for communicating with the server.
- Write data to the feed. Send the data for storing and presenting the trend graph(s).
The code to do these steps for the Arduino for the first Xively project is as follows. I left out some of the finer details for brevity:
#include <Xively.h>

char xivelyKey[] = “<YOUR_KEY_HERE>”;
#define FEED_NUMBER <YOUR_FEED_HERE>
char sensor1_name[] = "celsius";
char sensor2_name[] = "fahrenheit";
XivelyDatastream datastreams[] = {
  XivelyDatastream(sensor1_name, strlen(sensor1_name), DATASTREAM_FLOAT),
  XivelyDatastream(sensor2_name, strlen(sensor2_name), DATASTREAM_FLOAT),
};
XivelyFeed feed(FEED_NUMBER, datastreams, 2 /* number of datastreams */);
XivelyClient xivelyclient(...);
int ret = xivelyclient.put(feed, xivelyKey);
The code to do these steps in Python for the Raspberry Pi example project is as follows:
import xively

XIVELY_API_KEY = "<YOUR_KEY_HERE>"
XIVELY_FEED_ID = <YOUR_FEED_HERE>
api = xively.XivelyAPIClient(XIVELY_API_KEY)
feed = api.feeds.get(XIVELY_FEED_ID)
feed.datastreams = [
    xively.Datastream(id='celsius', current_value=tempc, ...),
    xively.Datastream(id='fahrenheit', current_value=tempf, ...),
]
feed.update()
Now that you understand the basics of writing data to Xively, let’s take a look at how to do it in more detail for the Arduino. This is followed by an example for the Raspberry Pi.
Project: Writing Data to Xively with an Arduino
This project demonstrates how to write sensor data to a Xively device. Unlike the previous projects in this chapter, you use a sensor and generate some samples. In this case, you monitor temperature and save the Celsius and Fahrenheit values to channels on your Xively Arduino device. If you have not yet created a Xively device for the Arduino, do that now and record the feed ID and API key generated.
The hardware for this project is an Arduino with an Arduino Ethernet shield (or compatible), a network cable, a breadboard, breadboard wires, a TMP36 temperature sensor, and a 0.10uF capacitor. Wire the sensor and the capacitor as shown in Figure 5-10. Attach pin 1 of the sensor to the 5V pin on the Arduino, pin 2 of the sensor to the A0 pin on the Arduino, and pin 3 to ground on the Arduino. The capacitor is also attached to pins 1 and 3 of the sensor (orientation does not matter).

Figure 5-10. Wiring setup for the Xively temperature feed for the Arduino
To use the Ethernet shield, you need to connect it via a network cable to a viable network connection via a router or switch. Check the link indicators on the networking device to make sure the device detects the Ethernet shield (you may need to turn on the Arduino, because some networking devices require the end device to be powered).
![]() Tip If you are not certain that the networking device is working or your cable is viable, try connecting a laptop or similar device. If you can establish connectivity with your laptop, the Arduino Ethernet shield will also work correctly (once set up in the sketch).
Tip If you are not certain that the networking device is working or your cable is viable, try connecting a laptop or similar device. If you can establish connectivity with your laptop, the Arduino Ethernet shield will also work correctly (once set up in the sketch).
Software Setup
The software needed for this project consists of the Xively library for the Arduino and a special HTTP client. You see how to obtain these libraries and take a short walkthrough of the code needed to communicate and store your sensor data in Xively. You saw a TMP36 sensor used with an Arduino in Chapter 3, and the code needed to read samples is the same. I leave the explanation of this code for you to explore in Listing 5-4.
You can download the Xively API Arduino library from https://github.com/xively/xively_arduino. Uncompress this folder, rename it Xively (or similar), and place it in your Arduino/Libraries folder. You can download the HTTP client from https://github.com/amcewen/HttpClient. Uncompress this folder, rename it HttpClient (or similar), and place it in your Arduino/Libraries folder.
![]() Tip Be sure to restart the Arduino IDE if it was running when you copied the folders.
Tip Be sure to restart the Arduino IDE if it was running when you copied the folders.
Now that you have the necessary libraries downloaded and copied, open a new Arduino project and name it Arduino_Xively. Start the file with the following includes. You need the SPI and Ethernet headers for the Ethernet card. The Xively library uses the HTTPClient header. Finally, you include the Xively header:
#include <SPI.h>
#include <Ethernet.h>
#include <HttpClient.h>
#include <Xively.h>
To use the Ethernet shield, you must also declare a MAC address. The IP address for the Ethernet shield is requested via DHCP. You define the MAC address as an array. This can be a random set of values, provided they are in the range 0x00–0xFF. You can use what is shown here:
byte mac_addr[] = { 0xDE, 0xAD, 0xBE, 0xEF, 0xFE, 0xED };
Next you define your Xively API key and feed ID. You also define the pin number for your TMP36 sensor. This example uses pin 0. You can choose whatever pin you want to use—just change this define, and the rest of the code will point to the correct pin:
char xivelyKey[] = "<YOUR_KEY_HERE>";
#define FEED_NUMBER <YOUR_FEED_HERE>
#define SENSOR_PIN 0
Recall that when I discussed how to use the Xively library, I said that you need to set up an array for your feed with each channel (also called a datastream) in its own element. In this project, you need two elements: one for temperature values in Celsius and another in Fahrenheit. Notice the names used in the following code. These names must match those defined as channels for your device on Xively. Spelling counts, so make sure they match what you defined in Xively:
char sensor1_name[] = "celsius";
char sensor2_name[] = "fahrenheit";
XivelyDatastream datastreams[] = {
  XivelyDatastream(sensor1_name, strlen(sensor1_name), DATASTREAM_FLOAT),
  XivelyDatastream(sensor2_name, strlen(sensor2_name), DATASTREAM_FLOAT),
};
Recall also that you must define an instance of the feed class initializing the class with your feed number, the array of datastreams (channels), and the number of datastreams. Following that, you need to create an instance of the EthernetClient class from the HTTPClient library and pass that to a new instance of the XivelyClient class. The following statements effect these implementations:
XivelyFeed feed(FEED_NUMBER, datastreams, 2 /* number of datastreams */);
EthernetClient client;
XivelyClient xivelyclient(client);
You create a method to read the sensor and return the temperature in Celsius and Fahrenheit. Name the method get_temperature(), and use the code from Chapter 3 to complete it. I leave this as an exercise for you but include the correct solution in a moment.
As in the previous projects, you also need a record_sample() method that writes the samples to Xively. Create a new method, and complete it as follows. Notice that here you call the put() method for the Xively client to send the samples to Xively. You need only pass an instance of your feed and your API key. That’s it—it’s that easy:
void record_sample(float tempc, float tempf) {
  datastreams[0].setFloat(tempc);
  datastreams[1].setFloat(tempf);

  Serial.print("Uploading to Xively ... ");
  int ret = xivelyclient.put(feed, xivelyKey);
  Serial.print("done. Return code = ");
  Serial.println(ret);

  // Wait for data upload
  delay(15000);
}
Two important steps are needed for the setup() method. You must initialize the serial class (so you can use the serial monitor) and initialize the Ethernet client. You use the begin() method for each of these operations. The Ethernet client class accepts a number of parameters, but in this case you need only the MAC address. See the Arduino documentation for additional parameters you can use, including passing a static IP address.
For the Ethernet class, you place the call to initialize the client in a loop with a one-second delay. If the call fails, it prints a warning and waits one second before trying again. If you encounter a situation where this occurs more than a couple of times or it never exits the loop, check to make sure you have plugged your Ethernet shield into a working network connection (connected to a router or switch).
The complete setup() method is as follows:
void setup() {
  Serial.begin(9600);
  delay (5000); // Give time to connect to serial monitor
  Serial.println("Starting cloud data upload.");

  while (!Ethernet.begin(mac_addr)) {
    Serial.println("Error starting Ethernet, trying again.");
    delay(1000);
  }
}
Finally, the loop() method contains a simplified set of operations as shown next. You merely call your get_temperature() method to get the temperature values and then call the record_sample() method to write the values to Xively. Keeping the loop() method short and high-level makes it easier to debug or add new samples:
void loop() {
  float temp_celsius;
  float temp_fahrenheit;

  // read and record sensor data
  get_temperature(&temp_celsius, &temp_fahrenheit);
  record_sample(temp_celsius, temp_fahrenheit);
}
Now that you understand the flow and contents of the sketch, you can complete the missing pieces and start testing. Listing 5-4 shows the complete sketch for this project.
Listing 5-4. Arduino-Based Xively Feed
/**
  Sensor Networks Example Arduino Xively Cloud Storage

  This project demonstrates how to save sensor data to an Xively feed.
*/

#include <SPI.h>
#include <Ethernet.h>
#include <HttpClient.h>
#include <Xively.h>

// Ethernet shield Mac address
byte mac_addr[] = { 0xDE, 0xAD, 0xBE, 0xEF, 0xFE, 0xED };

// Your Xively key
char xivelyKey[] = "<YOUR_KEY_HERE>";

// Your feed number
#define FEED_NUMBER <YOUR_FEED_HERE>

// Pin number for TMP36
#define SENSOR_PIN 0

// Define the strings for your datastream IDs
char sensor1_name[] = "celsius";
char sensor2_name[] = "fahrenheit";
XivelyDatastream datastreams[] = {
  XivelyDatastream(sensor1_name, strlen(sensor1_name), DATASTREAM_FLOAT),
  XivelyDatastream(sensor2_name, strlen(sensor2_name), DATASTREAM_FLOAT),
};

// Finally, wrap the datastreams into a feed
XivelyFeed feed(FEED_NUMBER, datastreams, 2 /* number of datastreams */);

EthernetClient client;
XivelyClient xivelyclient(client);

void get_temperature(float *tempc, float *tempf) {
  int adc_data = analogRead(SENSOR_PIN);

  Serial.print("Temperature is ");
  *tempc = ((adc_data * 1200.0 / 1024.0) - 500.0) / 10.0;
  Serial.print(*tempc);
  Serial.print("c, ");
  *tempf = ((*tempc * 9.0)/5.0) + 32.0;
  Serial.print(*tempf);
  Serial.println("f");

  // wait for 1 second
  delay(1000);
}

void record_sample(float tempc, float tempf) {
  datastreams[0].setFloat(tempc);
  datastreams[1].setFloat(tempf);

  Serial.print("Uploading to Xively ... ");
  int ret = xivelyclient.put(feed, xivelyKey);
  Serial.print("done. Return code = ");
  Serial.println(ret);

  // Wait for data upload
  delay(15000);
}

void setup() {
  Serial.begin(9600);
  delay (5000); // Give time to connect to serial monitor

  Serial.println("Starting cloud data upload.");

  while (!Ethernet.begin(mac_addr)) {
    Serial.println("Error starting Ethernet, trying again.");
    delay(1000);
  }
}

void loop() {
  float temp_celsius;
  float temp_fahrenheit;

  // read and record sensor data
  get_temperature(&temp_celsius, &temp_fahrenheit);
  record_sample(temp_celsius, temp_fahrenheit);
}
![]() Note Be sure to substitute your API key and feed number in the locations marked. Failure to do so will result in compilation errors.
Note Be sure to substitute your API key and feed number in the locations marked. Failure to do so will result in compilation errors.
Take some time to make sure you have all the code entered correctly and that the sketch compiles without errors. Once you reach this stage, you can upload the sketch and try it out.
To test the sketch, be sure the code compiles and you have your hardware set up correctly. Once you have a sketch that compiles, upload it to your Arduino and launch a serial monitor. Figure 5-11 shows an example of the output you should see.

Figure 5-11. Sample serial monitor output
Did you see similar output? If you did not, check the return code as displayed in the serial monitor. You should be seeing a return code of 200 (meaning success). If the return code was a single digit (1, 2, 3, and so on), you are likely encountering issues connecting to Xively. If this occurs, connect your laptop to the same network cable, and try to access Xively.
![]() Tip You can find a complete list of Xively return codes at https://xively.com/dev/docs/api/communicating/http/http_status_codes/.
Tip You can find a complete list of Xively return codes at https://xively.com/dev/docs/api/communicating/http/http_status_codes/.
If the connection is very slow, you could encounter a situation in which you get an error code other than 200 every other or every N attempts. If this is the case, you can increase the timeout in the loop() method to delay processing further. This may help for some very slow connections, but it is not a cure for a bad or intermittent connection.
Let the sketch run for 15–30 minutes before you visit Xively. Once the sketch has run for some time, navigate to Xively, log in, and click your device page. You should see results similar to those shown in Figure 5-12. Notice the peak near the end of the graph. I simulated a drop and spike in the data by pressing a cold object (a spoon that had been in the freezer) on the sensor, followed by a warm device (my finger).

Figure 5-12. Sample Xively feed for an Arduino
If all is working for you and you see output similar to that shown in Figures 5-11 and 5-12, congratulations: you’ve just created data in the cloud!
For More Fun
You can have a lot of fun with this script. Try connecting other sensors and creating other channels for them on your device in Xively. You can also experiment with reading the data you saved in Xively.
Now that you know how to save data to Xively on the Arduino, let’s explore how to do the same on the Raspberry Pi.
Project: Writing Data to Xively with a Raspberry Pi
This project demonstrates the ease of using the Xively Python library on the Raspberry Pi. You create the same sensor node as in the last project, but on a Raspberry Pi instead of an Arduino. If you have not completed the last project, take some time to read through it so the concepts introduced are familiar in this project.
You will use a Python script to read data from an analog temperature sensor (TMP36) and record it to your Xively feed. Recall that the Raspberry Pi does not have any analog to digital converters (ADCs), so you have to use a special module to add that functionality. In this case, you use an I2C module that provides 12-bit precision for reading values. You can use a more precise module (for example, 16-bit precision) if you cannot obtain the ADC module mentioned in the next section or have a different version already.
Hardware Setup
The hardware for this project consists of a Raspberry Pi, a Raspberry Pi breakout connector, a breadboard, the TMP36 sensor, a 0.10uF capacitor, jumper wires, and an ADC module.
I mentioned the Raspberry Pi does not include any ADCs, so you cannot use an analog sensor. In this project, you explore how to use a multichannel ADC with the Raspberry Pi to enable the use of the TMP36 analog temperature sensor. Figure 5-13 shows the 12-bit ADC from Adafruit (www.adafruit.com/products/1083). This module supports up to four sensors (channels). In the figure, you can see pins A0–A3; these are the pins used for each of the channels supported.
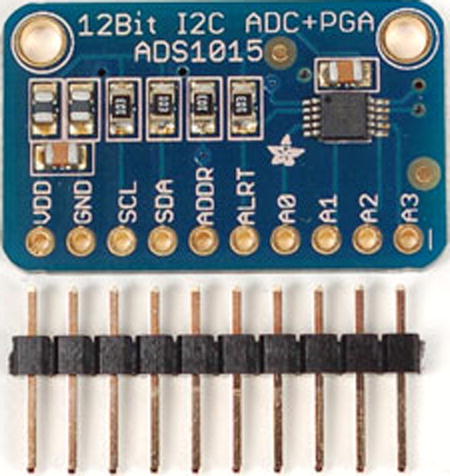
Figure 5-13. 12-Bit ADC module (courtesy of Adafruit)
![]() Tip You are exploring the use of the ADC module with a Raspberry Pi, because it supports the I2C protocol, but you can use the module with the Arduino too. See http://learn.adafruit.com/adafruit-4-channel-adc-breakouts for more details.
Tip You are exploring the use of the ADC module with a Raspberry Pi, because it supports the I2C protocol, but you can use the module with the Arduino too. See http://learn.adafruit.com/adafruit-4-channel-adc-breakouts for more details.
You also require connectivity to the Internet via a network connection on the Raspberry Pi. The Internet connection can be via a wired Ethernet connection or via a wireless connection. There are no specific requirements for connectivity as there are with an Arduino.
The ADC module is wired as follows (see Figure 5-14). Connect the VDD pin on the ADC module to the 5V pin on the Raspberry Pi breakout connector. Connect the GND pin on the ADC module to the GND pin on the Raspberry Pi breakout connector. Connect the SCL pin on the ADC module to the SCL pin on the Raspberry Pi breakout connector. Connect the SDA pin on the ADC module to the SDA pin on the Raspberry Pi breakout connector.

Figure 5-14. Wiring the TMP36 and ADC to the Raspberry Pi
Connect the TMP36 sensor as follows (again, see Figure 5-14). Connect pin 1 to the same 5V connection as the ADC module and pin 3 to the GND connection on the ADC module. Pin 2 on the sensor connects to the A0 pin on the ADC module. Finally, connect the 0.10uF capacitor to pins 1 and 3 on the sensor. Orientation does not matter.
![]() Caution Be sure to double-check your connections and compare them to Figure 5-14. Failure to connect things properly on the Raspberry Pi can lead to a damaged board.
Caution Be sure to double-check your connections and compare them to Figure 5-14. Failure to connect things properly on the Raspberry Pi can lead to a damaged board.
Once you have made these connections, power on your Raspberry Pi and issue the following command
$ sudo i2cdetect –y 0
You should see the ADC module appear as address 0x48 in the output, as shown in Figure 5-15.
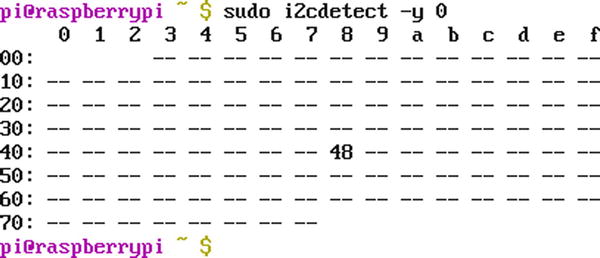
Figure 5-15. Verifying the ADC module
Software Setup
The software needed for this project includes the Xively Python library, the Python setup tools library, and the Adafruit Python library that you used in Chapter 04. Issue the following commands to install the Xively library for Raspberry Pi (https://github.com/xively/xively-python) and install it so that it is accessible via any Python script:
wgethttps://github.com/xively/xively-python/archive/master.zip
unzip master.zip
cd xively-python-master
sudo python ./setup.py install
You can also download the library by using a web browser, navigating to https://github.com/xively/xively-python, and clicking the Download Zip button.
Although several blogs and tutorials on using the Python Xively library do not mention it, I found that I needed to install the Python setup tools library before I could use the Xively library. To do this (if you haven’t already), issue the following command:
sudo apt-get install python-setuptools
Recall from Chapter 4 that the Python library from Adafruit is available from GitHub. To download the module and install it, see the section entitled “Project: Building a Raspberry Barometric Pressure Sensor Node.” I assume this library is placed in your home folder.
Now that you have the libraries you need, it is time to write a script to read samples from a TMP36 sensor (via the ADC module) and save data to Xively. To make things easier, you will create the Python script in the same folder as the Python library from Adafruit. If you have installed this library on your system and it is accessible via the Python path environment variable, you can place the new script anywhere you like. The following commands navigate to the desired folder and open an editor to enter the statements for the script:
cd ∼/Adafruit-Raspberry-Pi-Python-Code
cd Adafruit_ADS1x15
nano raspi_xively.py
Because the code for this project is logically the same as the previous project (other than the fact that one is for the Arduino and the other is for Python), I focus only on the specific differences: the use of the ADC module and the handling of the main method for the script. I leave the exploration of the common elements as an exercise. These include connecting to Xively, reading samples from the sensor, and outputting diagnostic statements.
You begin by adding the statements to import the libraries you need. In this case, you need the datetime, sys, time, and Xively libraries. You also import the ADS1x15 library code from the Adafruit Python code:
import datetime
import sys
import time
import xively

from Adafruit_ADS1x15 import ADS1x15
Next, you need to work with the ADS module. The following statements identify the address of the module (0x00 by default) and create an instance of the ADS1x15 class:
ADS1015 = 0x00  # 12-bit A/D Converter
adc = ADS1x15(ic=ADS1015)
To read a value from the ADC module, you use the following method. Here you read a single element (value) on pin 0 with a maximum value of 5 volts and a sample rate (accuracy) of 500. You use this method in the get_temperature() method to read the sensor samples:
volts = adc.readADCSingleEnded(0, 5000, 500)
The last thing you need is a special construct of Python scripts. The following code defines a main() method. Up until this point in the script, nothing has been defined as code to run when the script is loaded. The main() method is analogous to the loop() method in an Arduino sketch. In this case, you do the same operations—read samples and record them in Xively:
def main():
    print "Starting cloud data upload."
    while True:
        tempc, tempf = get_temperature()
        record_samples(tempc, tempf)
The next section of code defines a gate (if statement) that runs if the script file is loaded via the Python interpreter. It wraps the call to main() in an exception loop that you can exit using the Ctrl+C key sequence. In this case, the exception KeyboardInterrupt is captured and the script ends (pass is executed as the last statement):
if __name__ == '__main__':
    try:
        args = sys.argv[1:]
        main(*args)
    except KeyboardInterrupt:
        pass
This is a good trick to know because it has a second purpose. It permits other scripts to include the script (import it) and reuse its methods but does not execute the main() method. This is because the __name__ would be something other than __main__. In this way, you can make the code reusable without having the main method execute.
Listing 5-5 shows the complete code for the script for this project. Be sure to double-check all the code you’ve entered thus far and compare your solutions for record_sample() and get_temperature() to ensure that they both will work.
Listing 5-5. Complete Code for the raspi_xively.py Script
#
# Sensor Networks Example Raspberry Pi Xively Cloud Storage
#
# This project demonstrates how to save sensor data to an Xively feed.
# Requires the use of a A/D converter. Specifically, the ADC1015 from
# Adafruit (http://www.adafruit.com/products/1083).
#
import datetime
import sys
import time
import xively

from Adafruit_ADS1x15 import ADS1x15

XIVELY_API_KEY = "<YOUR_KEY_HERE>"
XIVELY_FEED_ID = <YOUR_FEED_HERE>

ADS1015 = 0x00  # 12-bit A/D Converter

# Set the ADC using the default mode (use default I2C address)
adc = ADS1x15(ic=ADS1015)

def get_temperature():
    # Read channel 0 in single-ended mode, +/- 5V, 500 sps
    volts = adc.readADCSingleEnded(0, 5000, 500)

    tempc = (((float(volts)*1200.0)/1024.0)-500.0)/10.0
    tempf = ((tempc *9.0)/5.0)+32.0

    print "Samples generated: celsius: %f" % tempc,
    print "fahrenheit: %f" % tempf

    return (tempc, tempf)

def record_samples(tempc, tempf):
    api = xively.XivelyAPIClient(XIVELY_API_KEY)
    feed = api.feeds.get(XIVELY_FEED_ID)
    now = datetime.datetime.now()
    print "Uploading to Xively ...",
    feed.datastreams = [
        xively.Datastream(id='celsius', current_value=tempc, at=now),
        xively.Datastream(id='fahrenheit', current_value=tempf, at=now),
    ]
    feed.update()
    print "done."
    time.sleep(5)

def main():
    print "Starting cloud data upload."
    while True:
        tempc, tempf = get_temperature()
        record_samples(tempc, tempf)

if __name__ == '__main__':
    try:
        args = sys.argv[1:]
        main(*args)
    except KeyboardInterrupt:
        pass
![]() Note Be sure to substitute your API key and feed number in the locations marked. Failure to do so will result in runtime errors.
Note Be sure to substitute your API key and feed number in the locations marked. Failure to do so will result in runtime errors.
Now that you have all the code entered, let’s test the script and see if it works.
Testing the Script
Python scripts are interpreted programs. Although there is a fair amount of syntax checking at the start of a script, logic errors are not discovered until the statement is executed. Thus, you may encounter errors or exceptions if the script was not entered correctly (for example, if you misspelled a method or variable name). This may also happen if you failed to replace the placeholder for the API key and feed number.
To run the script, enter the following command. Let the script run for several iterations before using Ctrl+C to break the main loop. Figure 5-16 shows an example of the output you should see:
python ./raspi_xively.py

Figure 5-16. Sample output from the raspi_xively.py script
Let the script run for 15–30 seconds, and then navigate to your Raspberry Pi device page on Xively. You should see your sensor data displayed, similar to that shown in Figure 5-17.
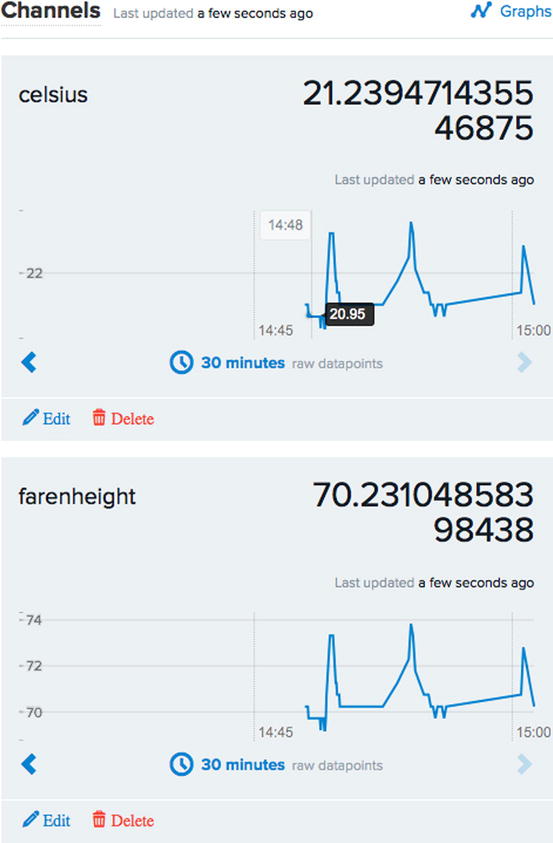
Figure 5-17. Sample Xively feed for the Raspberry Pi
If you do not see similar data, go back and check the return codes as discussed in the last project. You should see return codes of 200 (success). Check and correct any errors in network connectivity or syntax or logic errors in your script until it runs successfully for several iterations (all samples stored return code 200). If there are no errors but your data is still not displaying in the graph, check your time zone in your Xively profile. If the time zone is not set or is set incorrectly, the time in the chart will not match your local time, and thus the data will not be visible.
If you see similar data, congratulations! You now know how to generate data and save it to the cloud using two different platforms.
Storing Sensor Data in a Database
As you may have surmised, it is possible to store sensor data to a database on a Raspberry Pi. You can use MySQL as your database server and the Connector/Python library to write Python scripts that read sensor data and store the data in tables for later processing. Because there is a lot more involved than a few dozen lines of code (like setting up MySQL on the Raspberry Pi), you explore this topic in greater detail in Chapters 6 and 7.
Component Shopping List
A number of components are needed to complete the projects in this chapter, as listed in Table 5-2. Some of them, like the XBee modules and supporting hardware, are also included in the shopping list from other chapters. These are shown in Table 5-3.
Table 5-2. Components Needed

Table 5-3. Components Reused from Previous Chapters

Summary
This chapter explored the local storage options for the Arduino and Raspberry Pi. You completed a number of small projects demonstrating each of the possible storage options. I also discussed storing sensor data on remote systems, including how to store data using a cloud computing service named Xively.
In the next chapter, I take a break from this exploration of sensor projects and begin discussing another form of remote storage: a database server. Chapter 6 focuses on setting up a MySQL server, and Chapter 7 focuses on using the MySQL server with the Arduino via a special connector (library) written for the Arduino.
1Or at least the data from the time period in question.
2Except for the new Arduino Yún, which has an SD drive and USB ports for connecting external devices. The Yún is sure to be a game changer for the Arduino world.
3This refers to the old FAT file system requirements for file naming, where you can have a maximum of eight characters for the file name and three for the extension (http://en.wikipedia.org/wiki/8.3_filename). Do you remember those days?
4Ni! (With apologies to Monty Python.)
5Called Pythonistas.
6A path! A path! (More apologies to Monty Python.)
7Experienced cloud researchers will tell you there is a lot more to learn about the cloud.