
Types of game testing
Unit testing
Debugging
Android Profiler
We’ve gone through the programming phase of our project; next, we go through testing and debugging. It’s in this stage that we must find all errors and inconsistencies in the code. A polished game doesn’t have rough edges; we need to test it, debug it, and make sure it doesn’t hog computing resources.
Types of Game Testing
Functional testing. A game is basically an app. Functional testing is a standard way of testing an app. It’s called functional because we’re testing the app’s features (also known as functions) as they are specified in the requirement specification—the requirement specification is something you (or the game designer) would have written during the planning stages of the game. This would have been written in a document (usually called functional requirements specification). Examples of what you might find in a functional specification are “user must log in to the game server before entering the game” and “user may be able to select or go back to levels which have been completed; user cannot select a level which has not been completed.” The testers, usually called QA or QC (short for quality assurance and quality control, respectively), are the ones who carry out these tests. They will create test assets, craft a test strategy, execute them, and eventually report on the results of the executions. Failing tests are usually assigned back to the developer (you) to fix and resubmit. What I’m describing here is a typical practice for a development team that has a separate or dedicated testing team; if you’re a one-person team, the QA will most likely be you as well. Testing is an entirely different skill; I strongly encourage you to enlist the help of other people, preferably those who have experience in testing.
Performance testing . You could probably guess what this type of testing does just from its name. It pushes the game to its limit and sees it performs under stress. What you want to see here is how the game responds when subjected to above-normal conditions. Soak testing or endurance testing is a kind of performance testing; usually, you leave the game running for a long long time and in various modes of operation, for example, leave the game for a really long time while it’s paused or at the title screen. What you’re trying to find here is how the game responds to these conditions and how it utilizes system resources like the memory, CPU, network bandwidth, and so on; you will use tools like the Android Profiler to carry out these measurements.
Another form of performance testing is volume testing ; if your game uses a database, you might want to find out how the game will respond when data is loaded to the database. What you’re checking is how the system responds under various loads of data.
Spike testing or scalability testing is also another kind of performance test. If your game depends on a central server, this test will usually raise the number of users (device endpoints) connected to the central server. You’d want to observe how a spike in number of users affects player experience; is the game still responsive, was there an effect on frames per second, are there lags, and so on?
Compatibility testing is where you check how the game behaves on different devices and configurations of hardware/software. This is where AVDs (Android Virtual Devices) will come in handy; because AVDs are simply software emulators, you don’t have to buy different devices. Use the AVDs whenever you can. There will be some games that will be difficult to test reliably on emulators; when you’re in that situation, you really have to fork over money for testing devices.
Compliance or conformance testing . This is where you check the game against Google Play guidelines on apps or games; make sure you read Google Play’s Developer Policy Center at https://bit.ly/developerpolicycenter. Make sure you are also acquainted with PEGI (Pan European Game Information) and ESRB (Entertainment Software Rating Board). If the game has objectionable content that’s not aligned with a specific rating, they need to be identified and reported. Violations could be a cause for rejection, which may result in costly rework and resubmission.
Localization testing is important especially if the game is intended for global markets. Game titles, contents, and texts need to be translated and tested in the supported languages.
Recovery testing . This is taking edge case testing to another level. Here, the app is forced to fail, and you’re observing how the application behaves as it fails and how it comes back after it fails. It should give you insight whether you’ve written enough try-catch-finally blocks or not. Apps should fail gracefully, not abruptly. Whenever possible, runtime errors should be guarded by try-catch blocks; and when the exception happens, try to write a log and save the state of the game.
Penetration or security testing . This kind of testing tries to discover the weaknesses of the game. It simulates the activities that a would-be attacker will do in order to circumvent all the security features of the game; for example, if the game uses a database to store data, especially user data, a pen tester (a professional who practices penetration testing) might play through the game while Wireshark is running—Wireshark is a tool that inspects packets; it’s a network protocol analyzer. If you stored passwords in clear text, it will show up in these tests.
Sound testing . Check if there are any errors loading the files; also, listen to the sound files if there’s a cracking sound or others.
Developer testing . This is the kind of testing you (the programmer) do as you add layers and layers of code to the game. This involves writing test code (in Java as well) to test your actual program. This is known as unit testing. Android developers usually perform JVM testing and instrumented testing; we’ll discuss these some more in the following sections.
Unit Testing
Unit testing is actually functional testing that a developer performs, not the QA or QC. A unit test is simple; it’s a particular thing that a method might do or produce. An application typically has many unit tests because each test is a very narrowly defined set of behavior. So, you’ll need lots of tests to cover the whole functionality. Android developers usually use JUnit to write unit tests.
JUnit is a regression testing framework written by Kent Beck and Erich Gamma; you might remember them as the one who created extreme programming and the other one from Gang of Four (GoF, Design Patterns), respectively, among other things.
Java developers have long used JUnit for unit testing. Android Studio comes with JUnit and is very well integrated in it. We don’t have to do much by way of setup. We only need to write our tests.
JVM Test vs. Instrumented Test
If you look at any Android application, you’ll see that it has two parts: a Java-based behavior and an Android-based behavior.
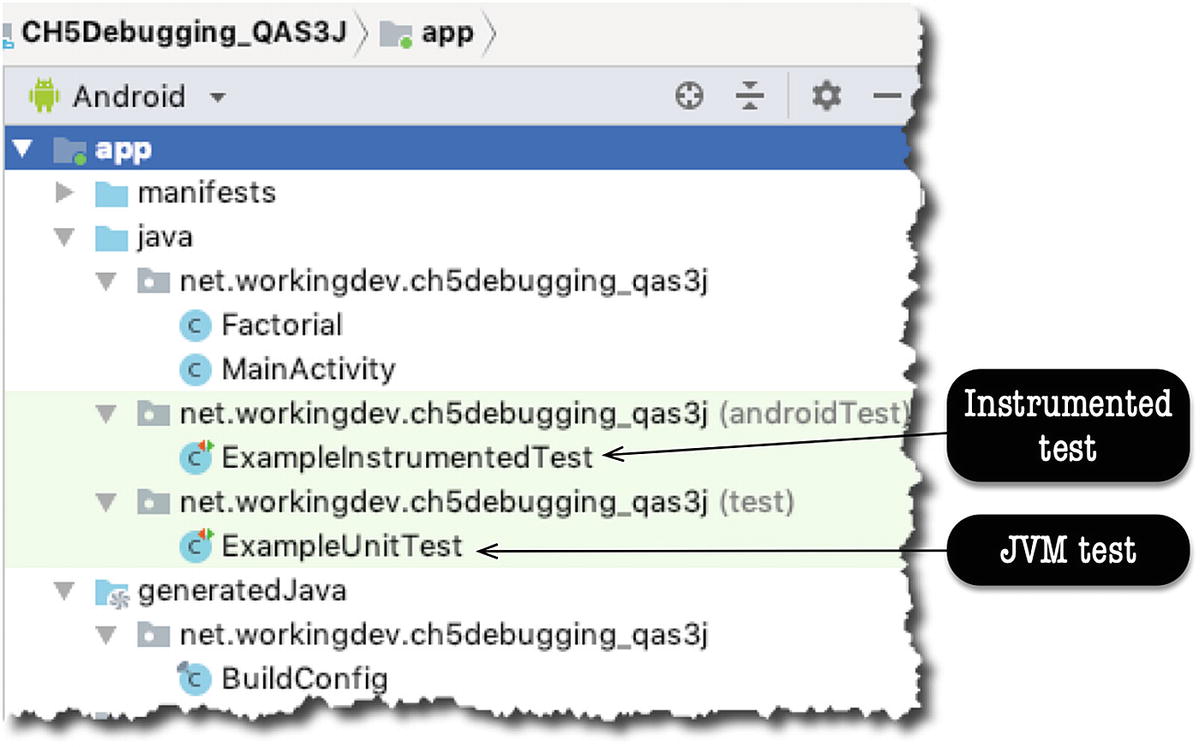
JVM test and instrumented test in Android view
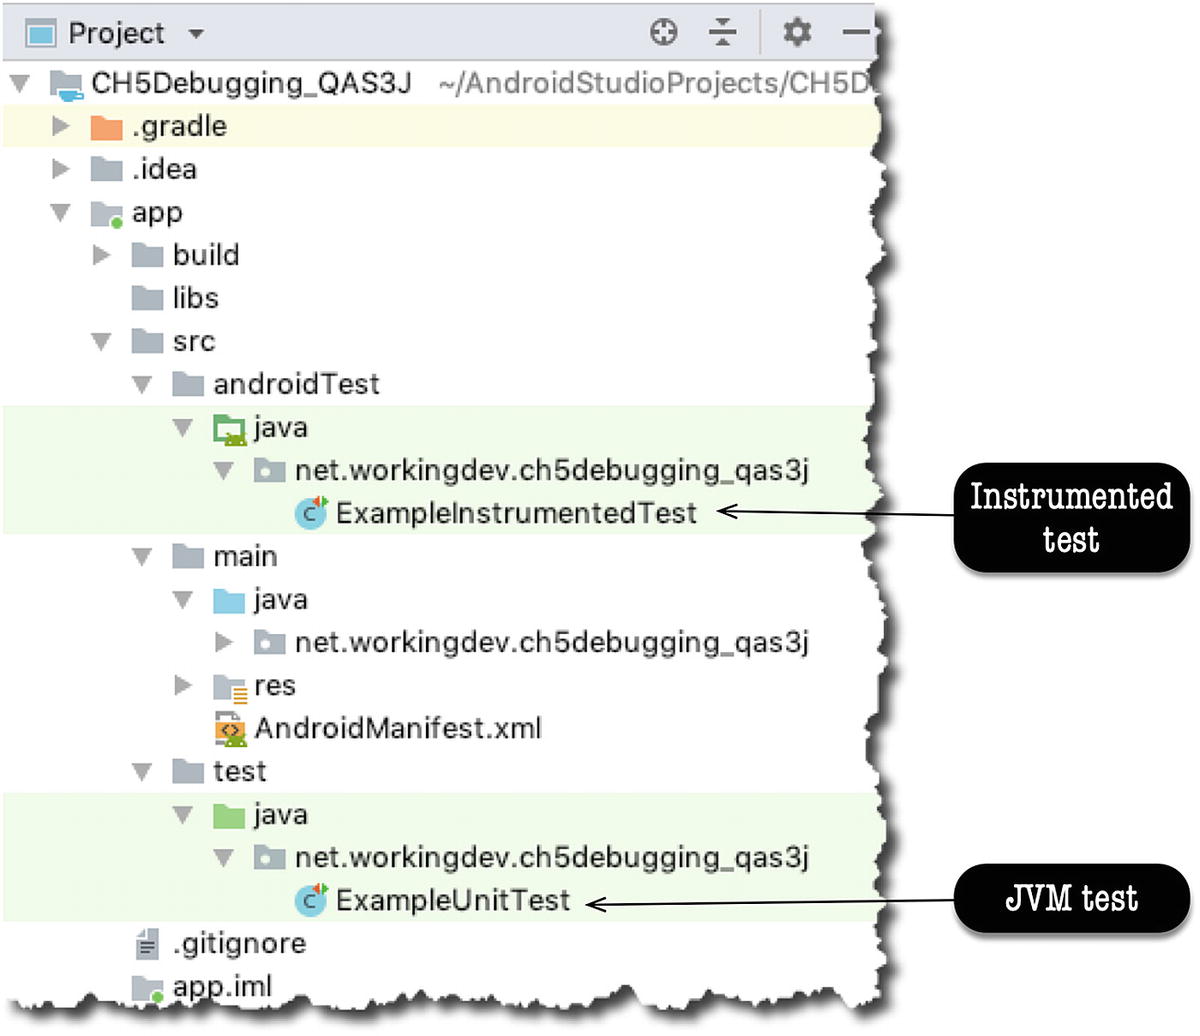
JVM test and instrumented test in Project view
As you can see from either Figure 8-1 or 8-2, Android Studio went the extra mile to generate sample test files for both the JVM and the instrumented test. The example files are there to serve as just quick references; it shows us what unit tests might look like.
A Simple Demo
Factorial.java
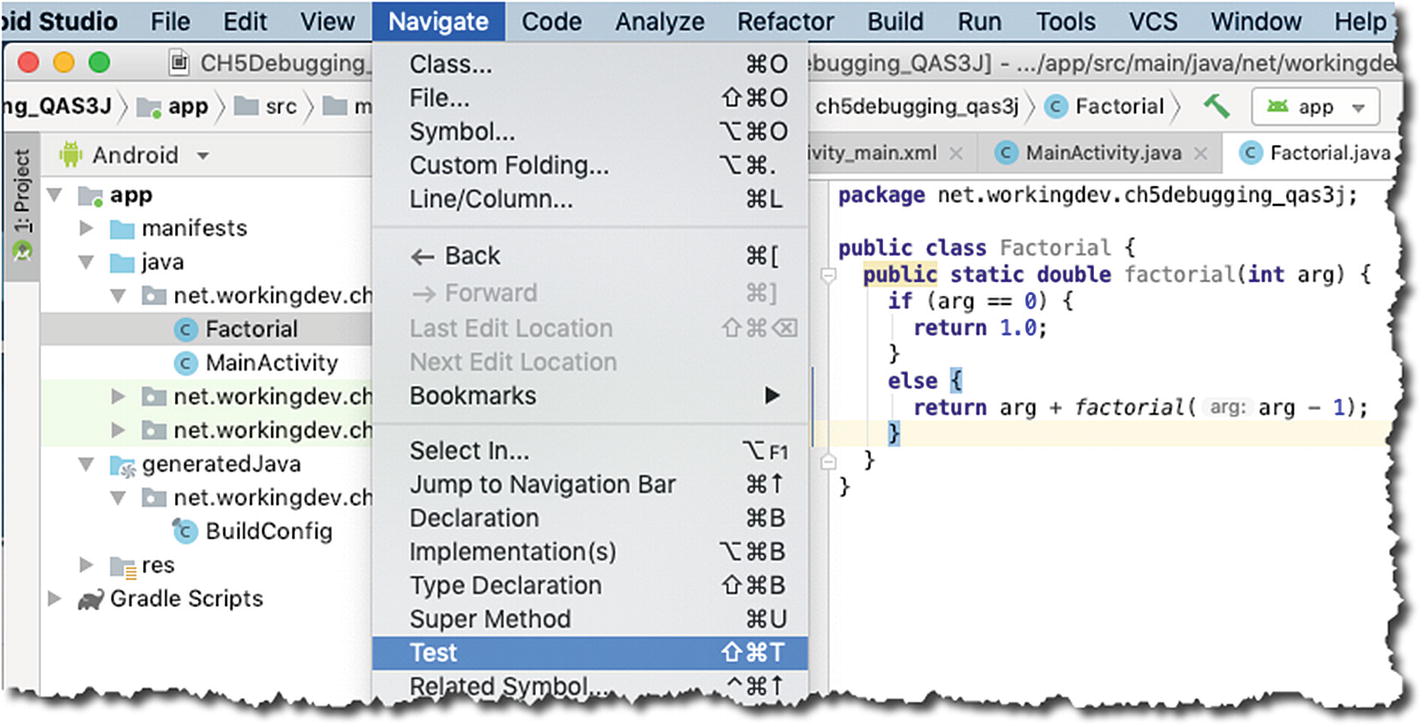
Create a test for Factorial.java
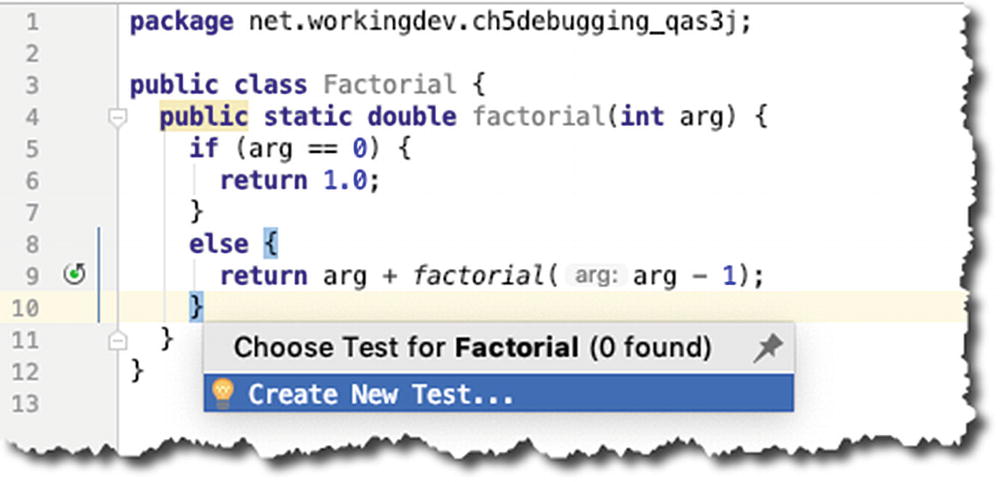
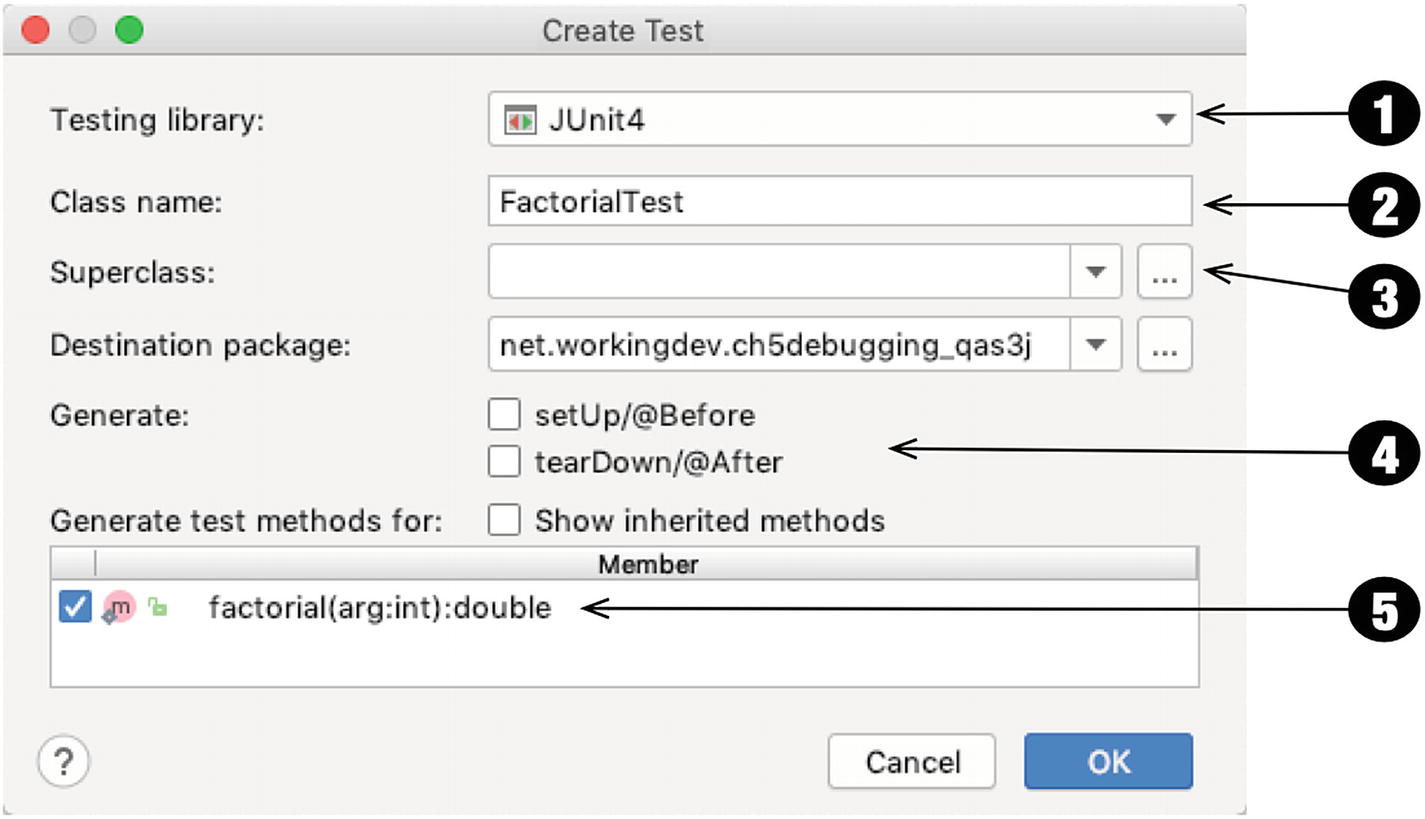
Create New Test pop-up
➊ | You can choose which testing library you want to use. You can choose JUnit 3, 4, or 5. You can even choose Groovy JUnit, Spock, or TestNG. I used JUnit4 because it comes installed with Android Studio. |
➋ | The convention for naming a test class is “name of the class to test” + “Test”. Android Studio populates this field using that convention. |
➌ | Leave this blank; we don’t need to inherit from anything. |
➍ | We don’t need setUp() and tearDown() routines for now, so leave these unchecked. |
➎ | Let’s check the factorial() method because we want to generate a test for this. |
Create FactorialTest
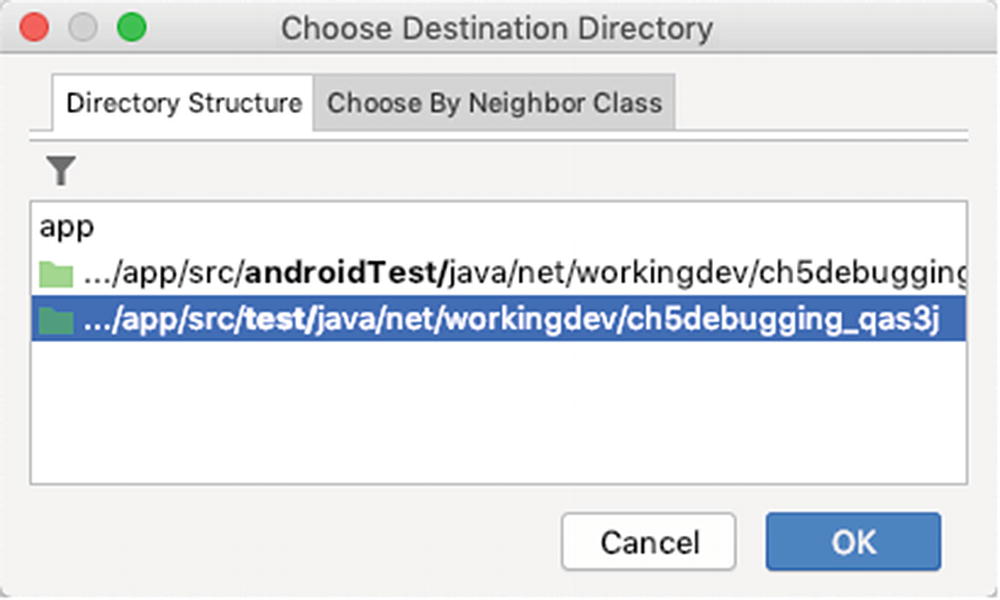
Choose Destination Directory
➊ | The file Factorial.java was created under the test folder. |
➋ | A factorial() method was created, and it’s annotated as @Test. This is how JUnit will know that this method is a unit test. You can prepend your method names with “test”, for example, testFactorial(), but that is not necessary, the @Test annotation is enough. |
➌ | This is where we put our assertions. |
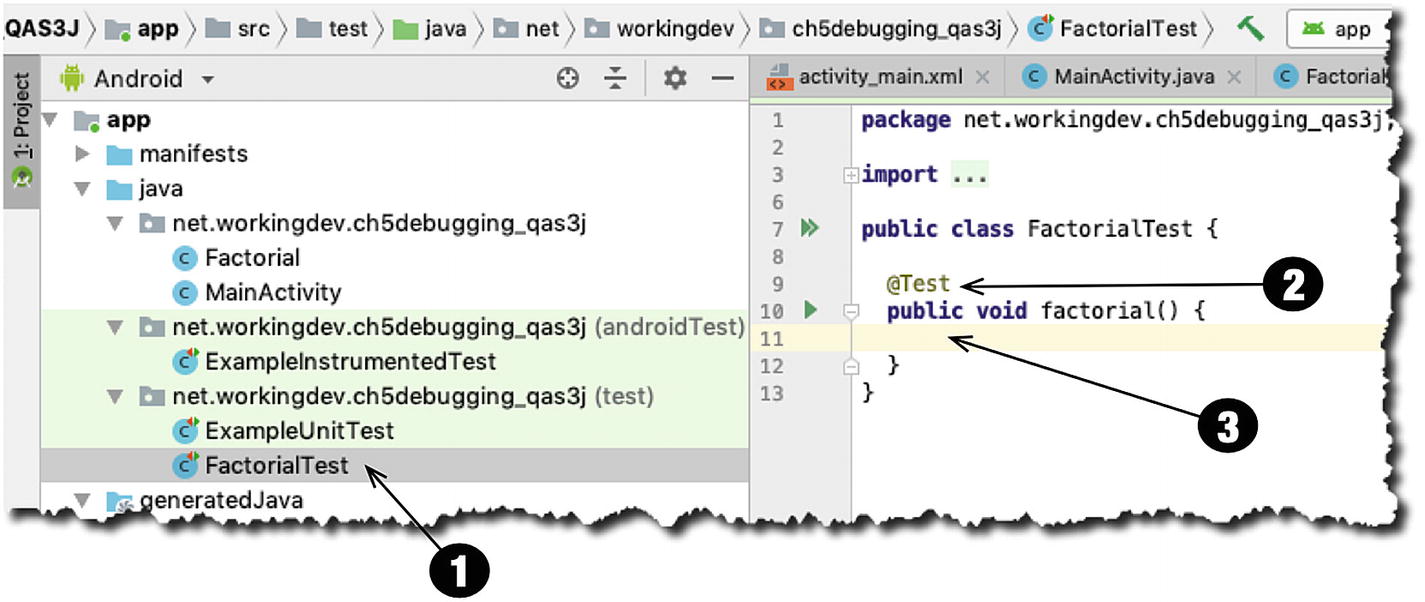
FactorialTest.java in Project view and the main editor
See how simple that was? Creating a test case in Android Studio doesn’t really involve us that much in terms of setup and configuration. All we need to do now is write our test.
Implementing the Test
Common assert methods
Method | Description |
|---|---|
assertEquals() | Returns true if two objects or primitives have the same value |
assertNotEquals() | The reverse of assertEquals() |
assertSame() | Returns true if two references point to the same object |
assertNotSame() | Reverse of assertSame() |
assertTrue() | Tests a Boolean expression |
assertFalse() | Reverse of assertTrue() |
assertNull() | Tests for a null object |
assertNotNull() | Reverse of assertNull() |
FactorialTest.java
Our FactorialTest class has only one method because it’s for illustration purposes only. Real-world code would have many more methods than this, to be sure.
Notice that each test (method) is annotated by @Test. This is how JUnit knows that factorial() is a test case. Notice also that assertEquals() is a method of the Assert class, but we’re not writing the fully qualified name here because we’ve got a static import on Assert—it certainly makes life easier.
➊ | The Expected value is your control data; this is usually hardcoded in the test. |
➋ | The Actual value is what your method returns. If the expected value is the same as the actual value, the assertEquals() passes—your code is behaving as expected. |
➌ | Delta is intended to reflect how close the actual and expected values can be and still be considered equal. Some developers call this parameter the “fuzz” factor. When the difference between the expected and actual values is greater than the “fuzz factor,” then assertEquals() will fail. I used 0.0 here because I don’t want to tolerate any kind of deviation. You can use other values like 0.001, 0.002, and so on; it depends on your use case and how much fuzz your app is willing to tolerate. |
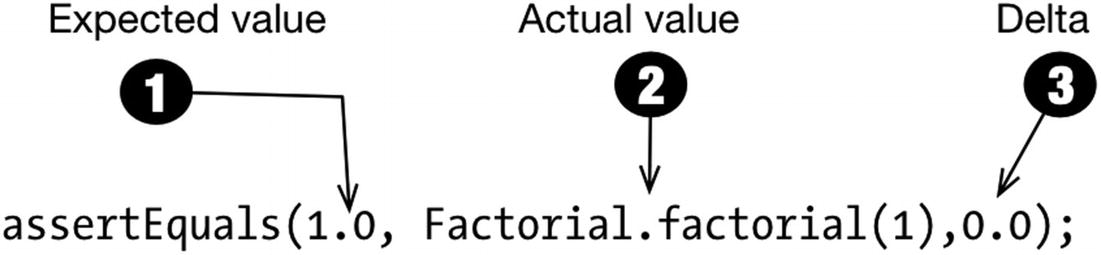
assertEquals method
Now, our code is complete. You can insert a couple more asserts in the code so you can get into the groove of things, if you prefer.
There are a couple of things I did not include in this sample code. I did not override the setUp() and tearDown() methods because I didn’t need it. You would normally use the setUp() method if you need to set up database connections, network connections, and so on. Use the tearDown() method to close whatever it is you opened in the setUp().
Now, we’re ready to run the test.
Running a Unit Test
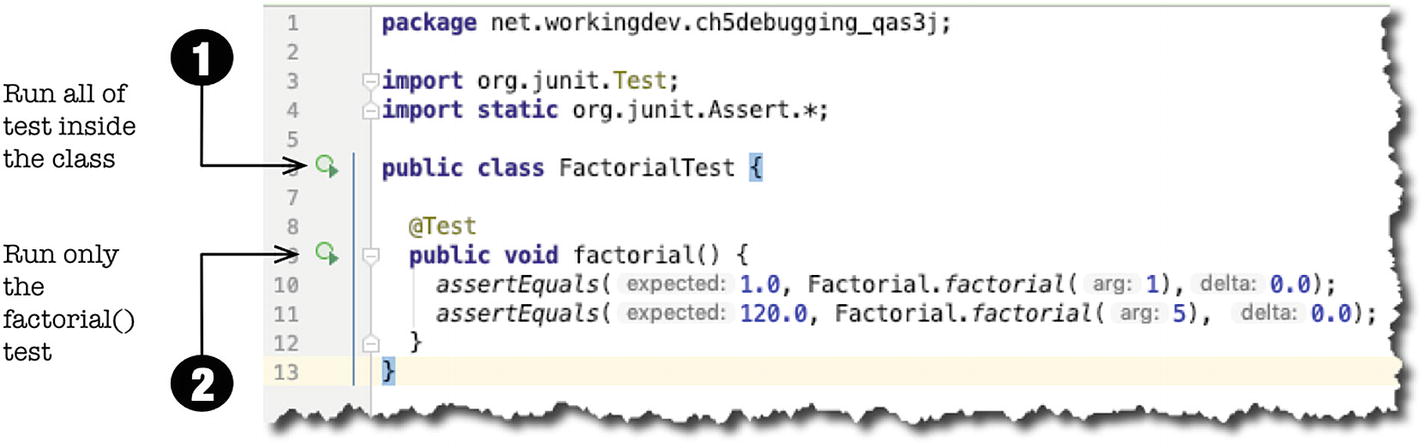
FactorialTest.java in the main editor
Similarly, you can also run the test from the main menu bar; go to Run ➤ Run.
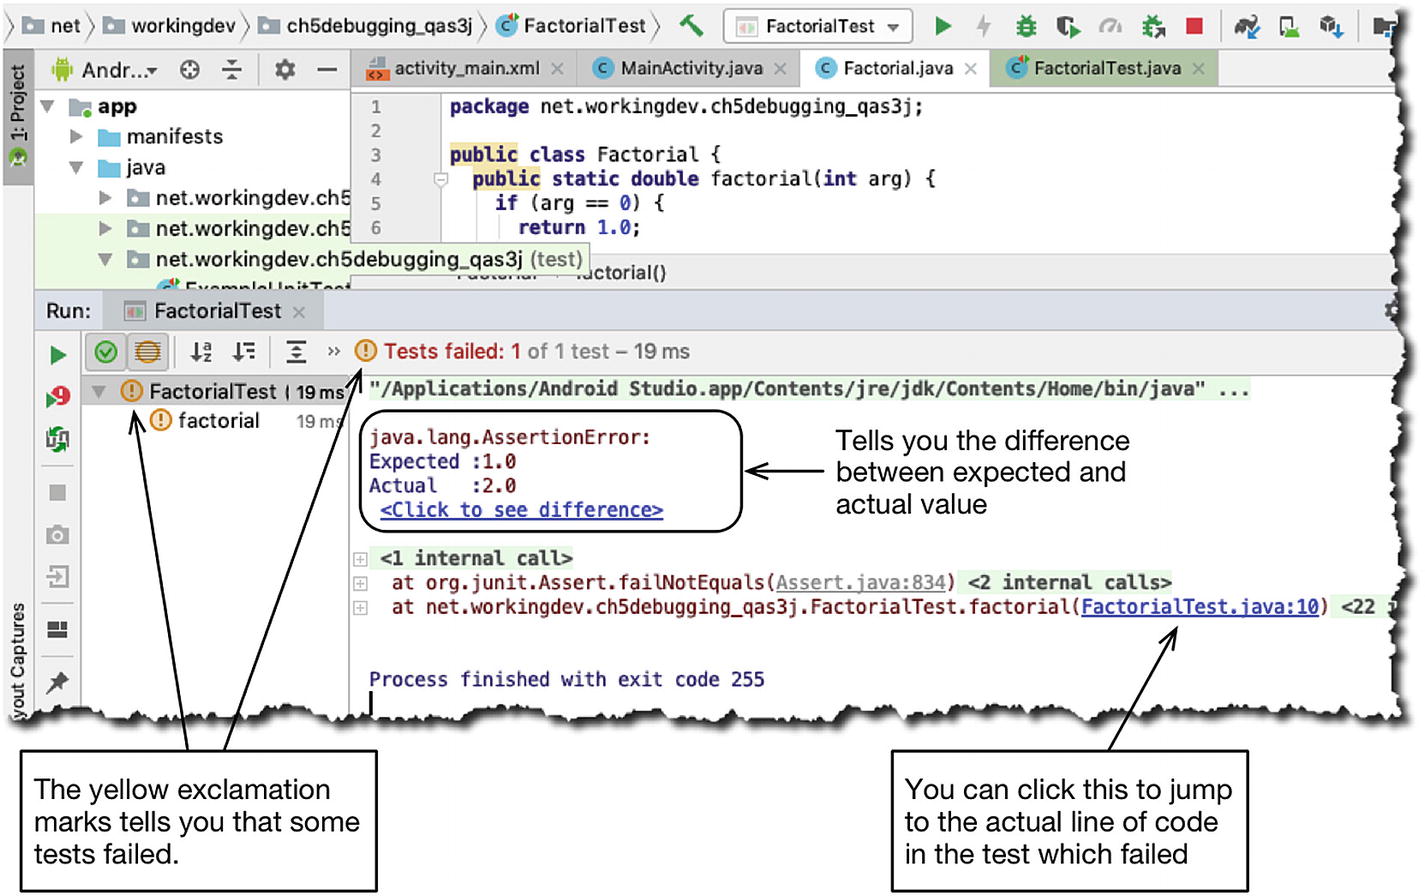
Result of running FactorialTest.java
Android Studio gives you plenty of cues so you can tell if your tests are passing or failing. Our first run tells us that there’s something wrong with Factorial.java; the assertEquals() has failed.
When a test fails, it’s best to use the debugger to investigate the code. FactorialTest.java is no different than any other class in our project; it’s just another Java file, we can definitely debug it. Put some breakpoints on strategic places of your test code, then instead of “running” it, run the “debugger” so you can walk through it.
Our test failed because the factorial of 1 isn’t 2, it’s 1. If you look closer at Factorial.java, you’ll notice that the factorial value isn’t calculated properly.
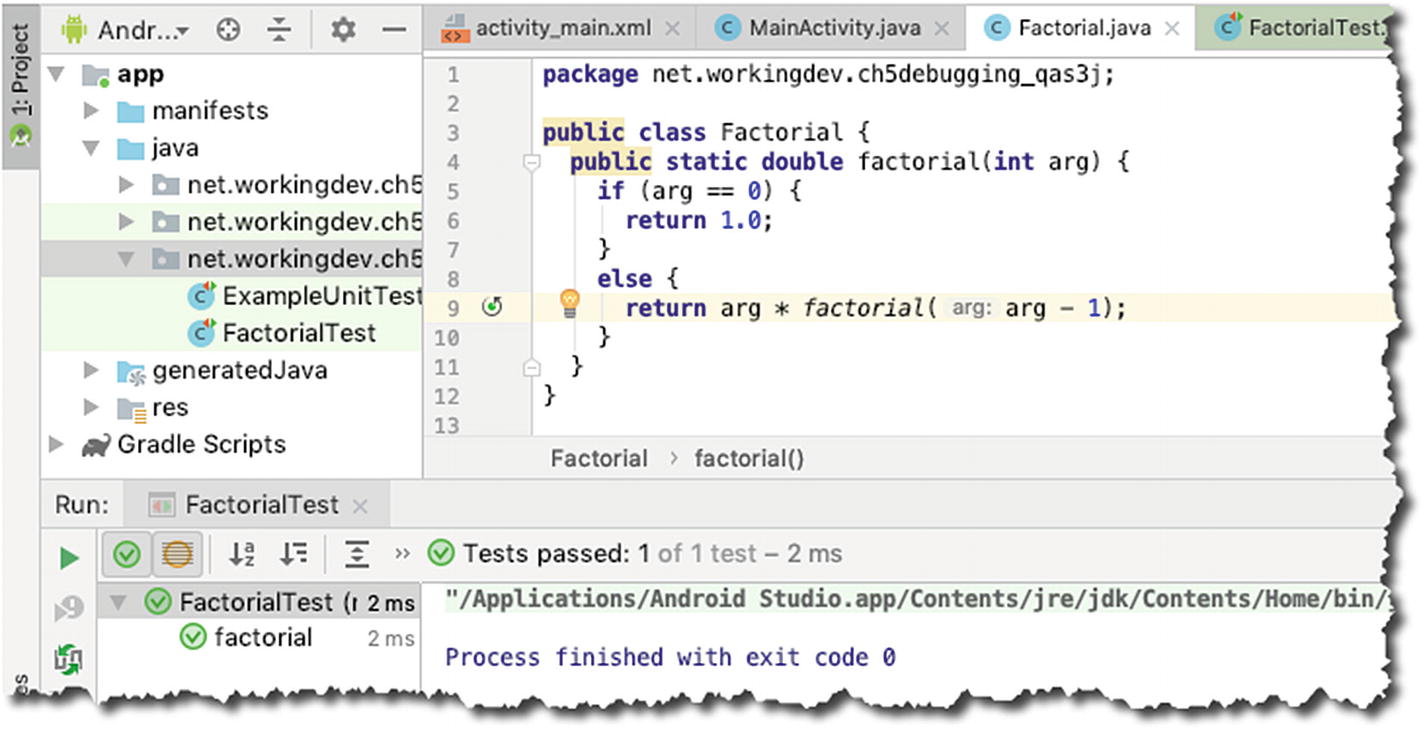
Successful test
Instead of yellow exclamation marks, we now see green check marks. Instead of seeing “Test failed,” we now see “Test passed.” Now we know that our code works as expected.
Debugging
We’ve been writing code for a while now; I’m sure you’ve had some mishaps with your code by now and have seen the various ways that Android Studio prompted your attention about these errors.
Syntax Errors
One of the errors you’ll encounter with annoying frequency is syntax errors. They happen because you wrote something in the code that’s not supposed to be there; or you forgot to write something (like a semicolon). These errors can be as benign as forgetting a closing curly brace or can be as complex as passing the wrong type of argument to a method or a parameterized class when using generics. Fortunately, Android Studio is very competent in spotting these kinds of errors. It’s almost like the IDE is continuously reading the code and compiling it.
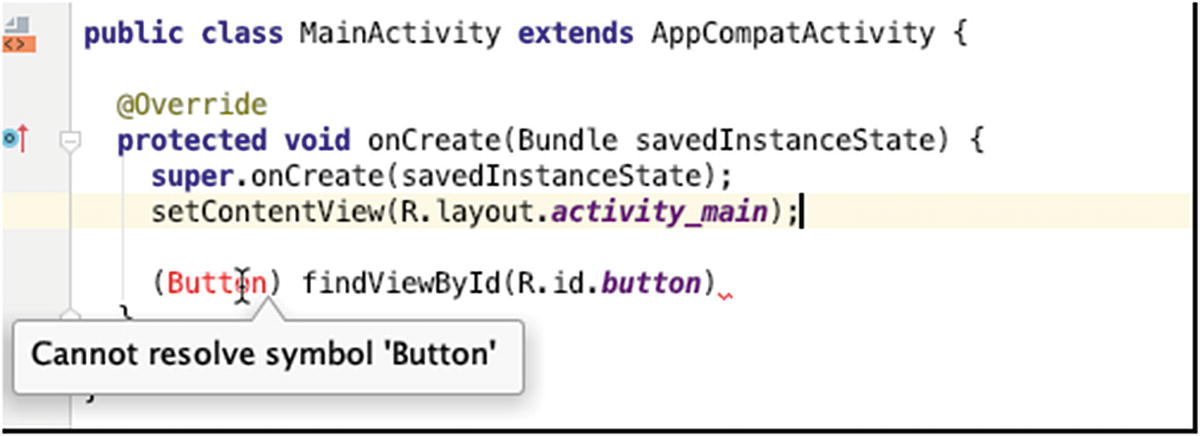
Syntax errors shown in the editor
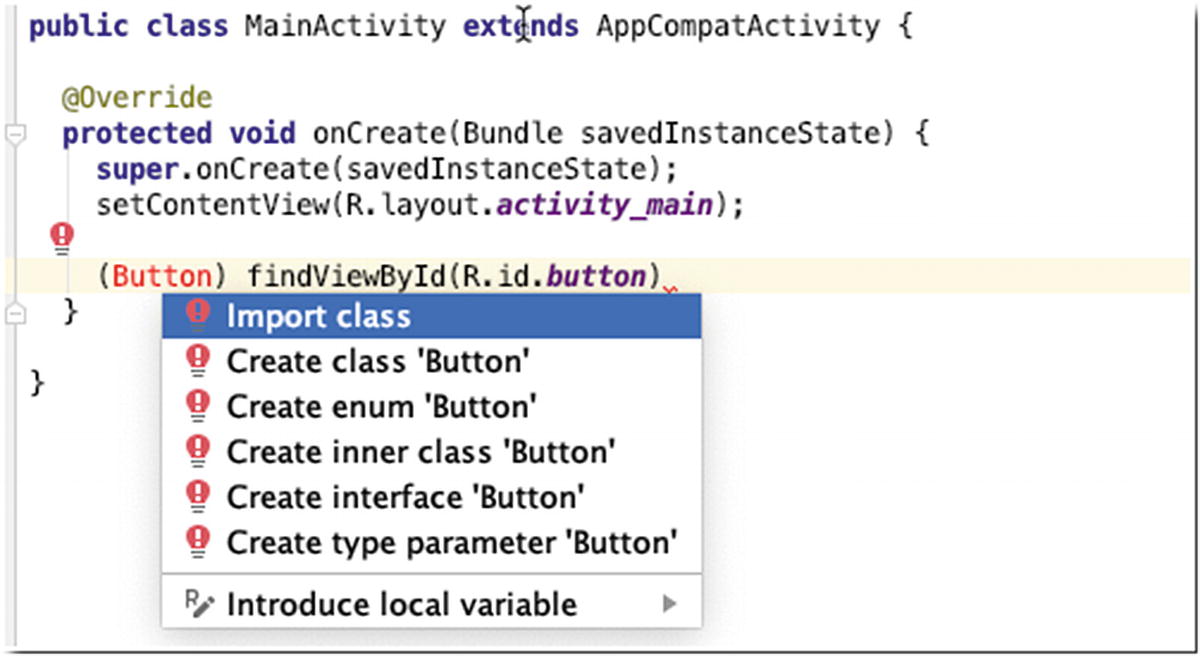
Quick Fix
Runtime Errors
The app gets something from the Internet, a picture or a file and so on, so it assumes that the Internet is available and there is a network connection. Always. Experience should tell you that isn’t always the case. Network connections go down sometimes, and if you don’t factor this in your code, it may crash.
The app needs to read from a file. Just like our first case earlier, your code assumes that the file will always be there. Sometimes, files get corrupted and may become unreadable. This should also be factored in the code.
The app performs Math calculations. It uses values that are inputted by users, and sometimes it also uses values that are derived from other calculations. If your code happens to perform a division and in one of those divisions, the divisor is zero, that will also cause a runtime problem.
For the most part, Java’s got your back when dealing with runtime errors. Exception handling isn’t optional in Java. Just make sure that you’re not skimping on your try-catch block; always put Exception handling code, and you should be fine.
Logic Errors
Logic errors are the hardest to find. As its name suggests, it’s an error on your logic. When your code is not doing what you thought it should be doing, that’s logic error. There are many ways to cope with it, but the most common methods are (1) using log statements and (2) using breakpoints and walking/stepping through the code.
Basic use of the Log class
In each case, tag is a String literal or variable. You can use the tag for filtering the messages in the Logcat window. The message is also a String literal or variable which contains what you actually want to see in the log.
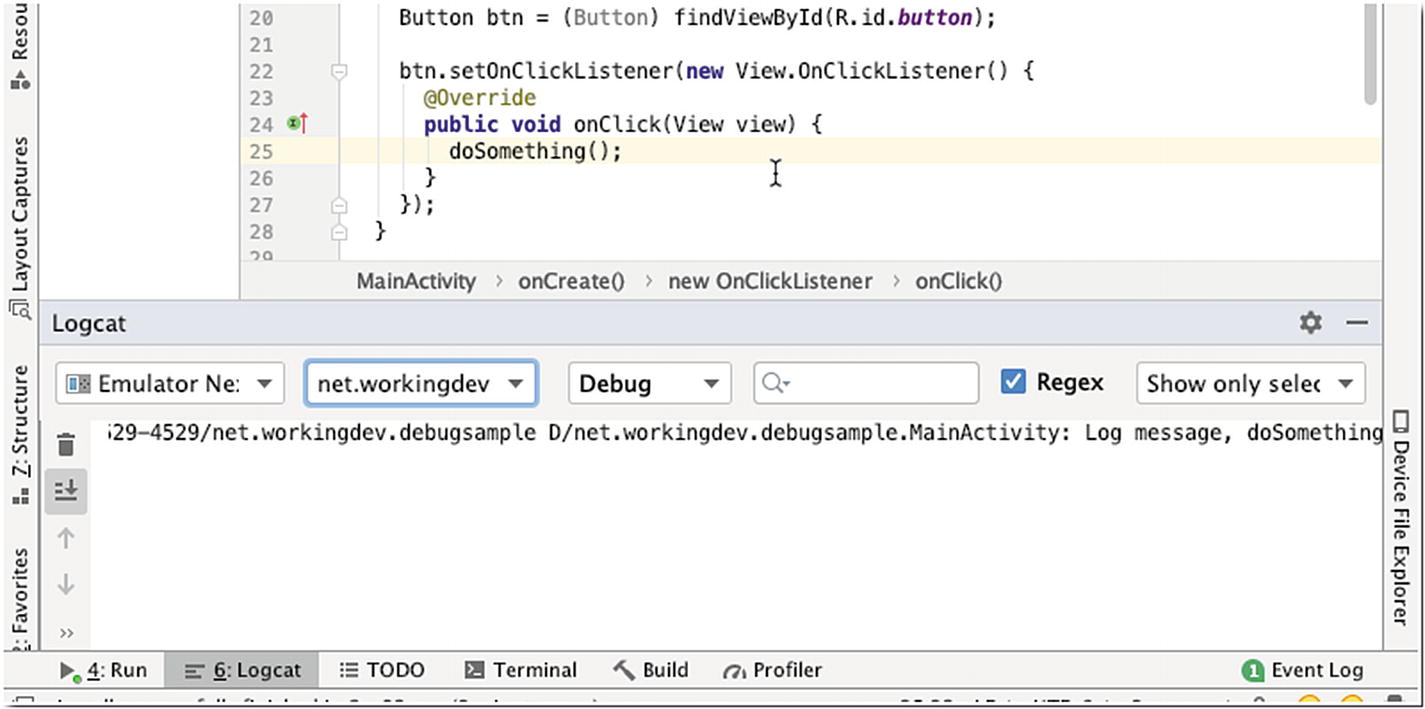
Logcat tool window
Walking through the Code
Android Studio includes an interactive debugger which allows you to walk and step through your code as it runs. With the interactive debugger, we can inspect snapshots of the application—values of variables, running threads, and so on—at specific locations in the code and at specific points in time. These specific locations in the code are called breakpoints; you get to choose these breakpoints.
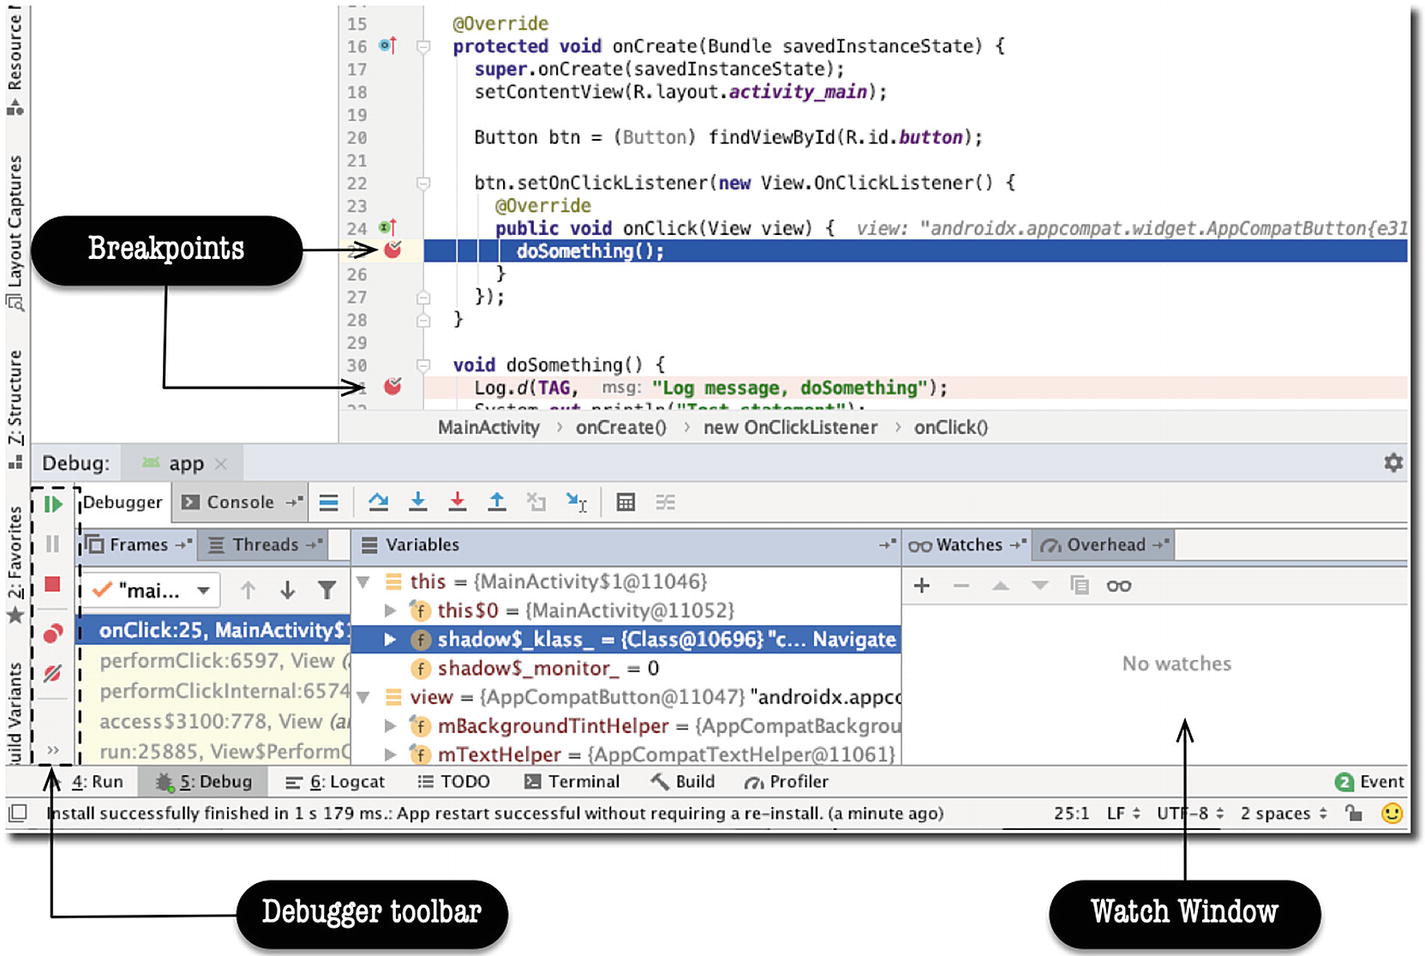
Debugger window
After the breakpoints are set, you have to run the app in debug mode. Stop the app if it is currently running, then from the main menu bar, click Run ➤ Debug ‘app’.
Running the app in debug mode isn’t the only way to debug the app. You can also attach the debugger process in a currently running application. There are situations where this second technique is useful; for example, when the bug you are trying to solve occurs on very specific conditions, you may want to run the app for a while, and when you think you are close to the point of error, you can then attach the debugger.
Use the application as usual. When the execution comes to a line where you set a breakpoint, the line turns from pink to blue. This is how you know the code execution is at your breakpoint. At this point, the debugger window opens, the execution stops, and Android Studio gets into interactive debugging mode. While you are here, the state of the application is displayed in the Debug tool window. During this time, you can inspect values of variables and even see the threads running in the app.
You can even add variables or expressions in the Watch window by clicking the plus sign with the spectacles icon. There will be a text field where you can enter any valid expression. When you press Enter, Android Studio will evaluate the expression and show you the result. To remove a watch expression, select the expression and click the minus sign icon on the Watch window.
To resume the program execution, you can click the “Resume program” button at the top of the debugger toolbar—it’s the green arrow pointing to the right. Alternatively, you can also resume the program from the main menu bar, Run ➤ Resume Program. If you want to halt the program before it finishes naturally, you can click the “Stop app” button on the debugger toolbar; it’s the red square icon. Alternatively, you can do this also from the main menu bar, Run ➤ Stop app.
Profiler
The profiler gives us insights on how our app/game is using computing resources, like the CPU, memory, network bandwidth, and battery.
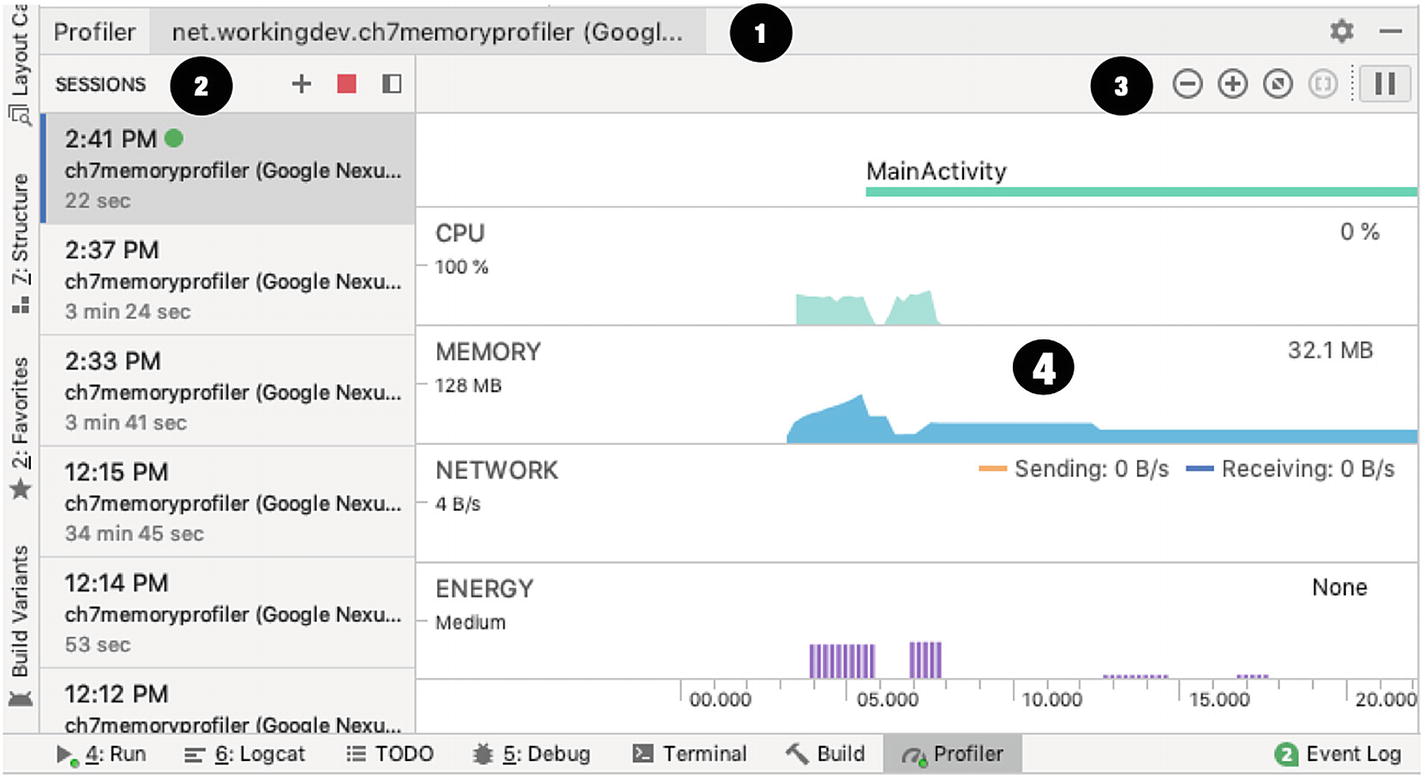
Profiler
➊ | It shows the process and device being profiled. |
➋ | It shows you which sessions to view. You can also add new sessions from here by clicking the + button. |
➌ | Use the zoom buttons to control how much of the timeline to view. |
➍ | The new shared timeline view lets you see all the graphs for the CPU, memory, network, and energy usage. At the top, you will also see important app events, like user inputs or Activity state transitions. |
As soon as you launch an application, either on an attached device or an emulator, you’ll see its graph on the Profiler.
If you try to profile an APK with a version lower than API level 26, you will see some warnings because Android Studio needs to fully instrument your code. You will need to enable “Advance profiling”; but, if your APK is Oreo or higher, you won’t see any warnings.
If you click any of the charts, the Profiler window will take you to one of the detailed views. If you click the CPU, for example, you’ll see the detailed view for the CPU utilization.
CPU

CPU view
Aside from the live utilization graph, the CPU detailed view also shows a list of all the threads in the app and their states—you can see if the threads are waiting for I/O or when they are active.
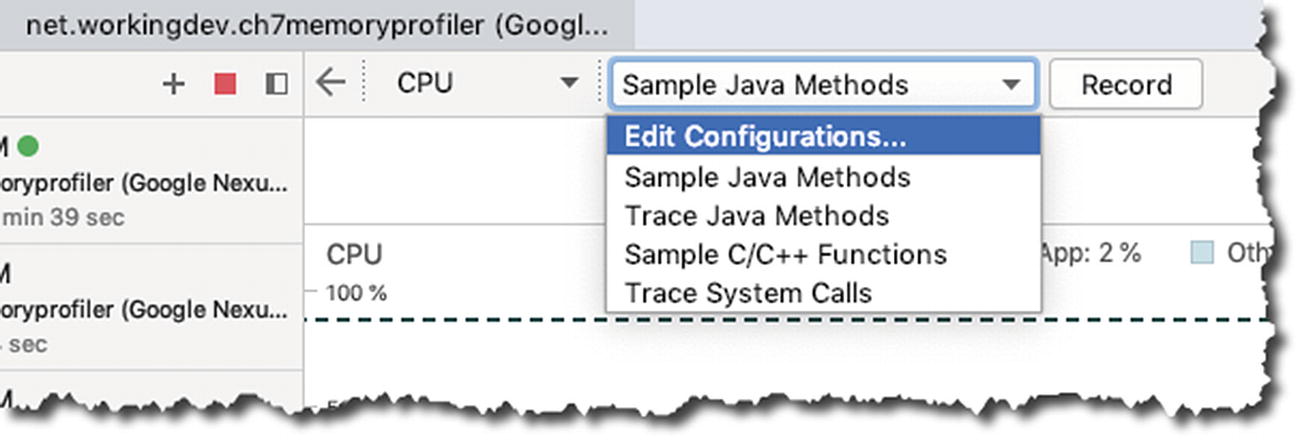
Edit Configurations
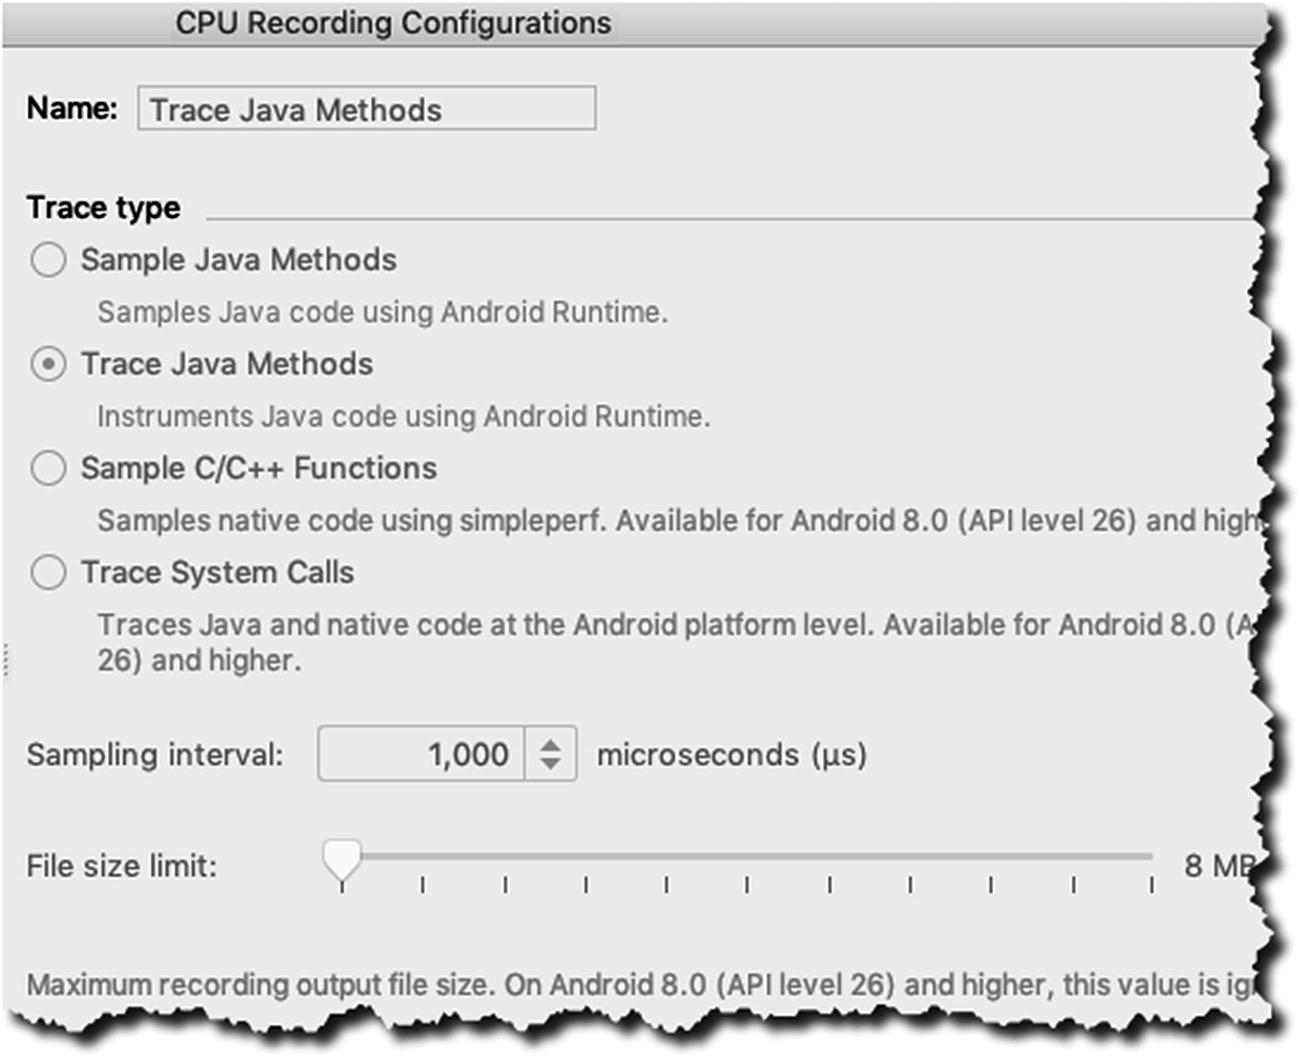
CPU Recording Configurations
Figure 8-19 shows the “Sampling interval” and “File size limit” settings, which you can use to adjust how frequent the sampling will be and how big of a file size you’d like to allocate for the recording. Just to reiterate, the file size limitation is only present on Android devices that are running Android 8.0 or lower (< API level 26). If your device has a higher Android version, you’re not constrained by these limitations.
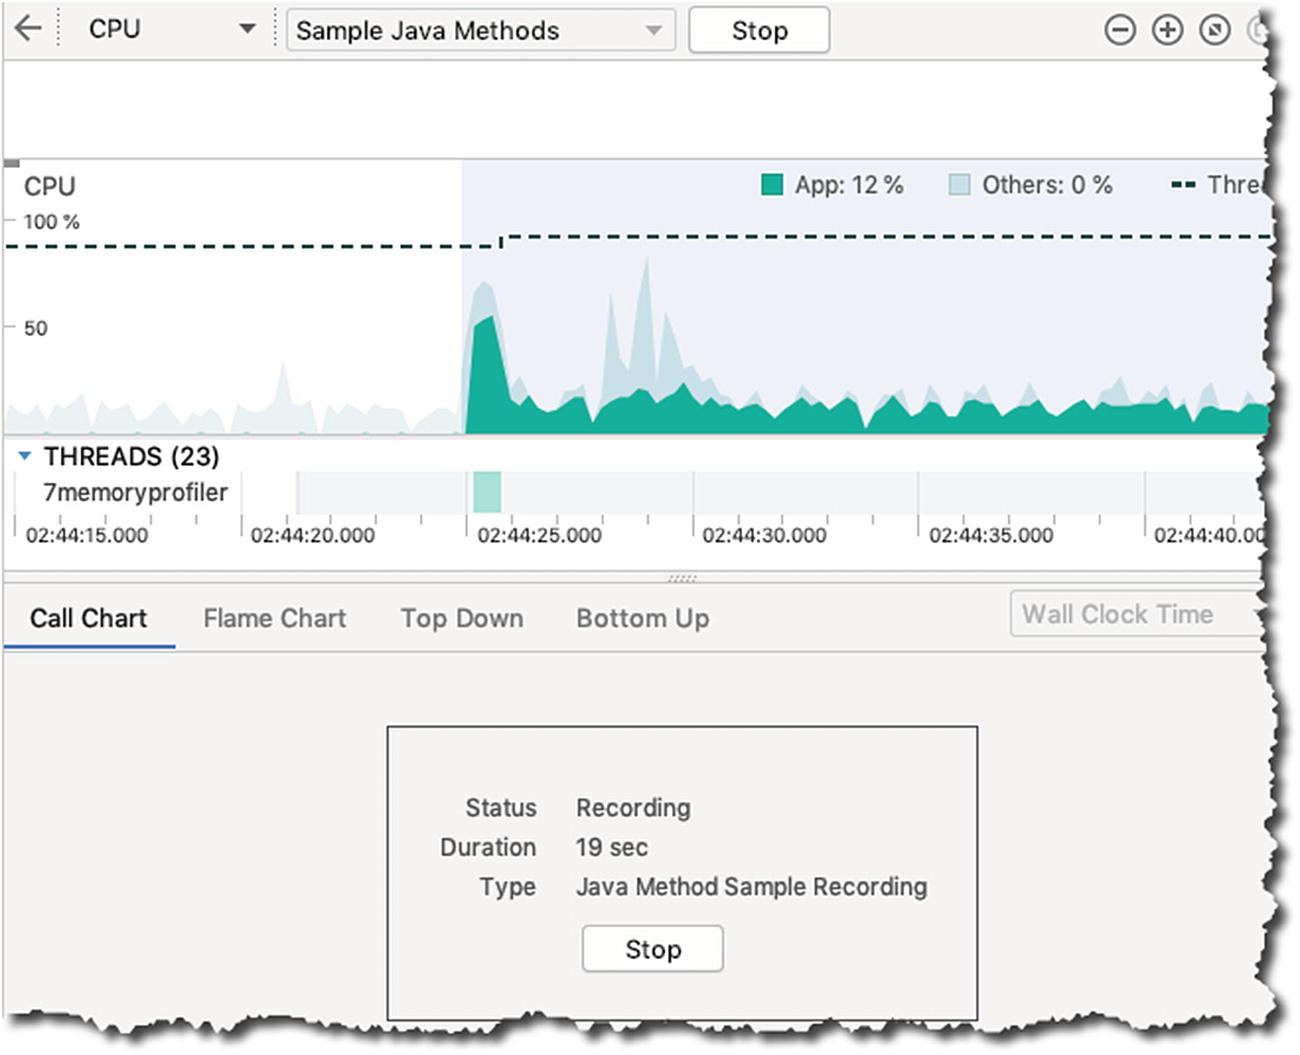
Recording session
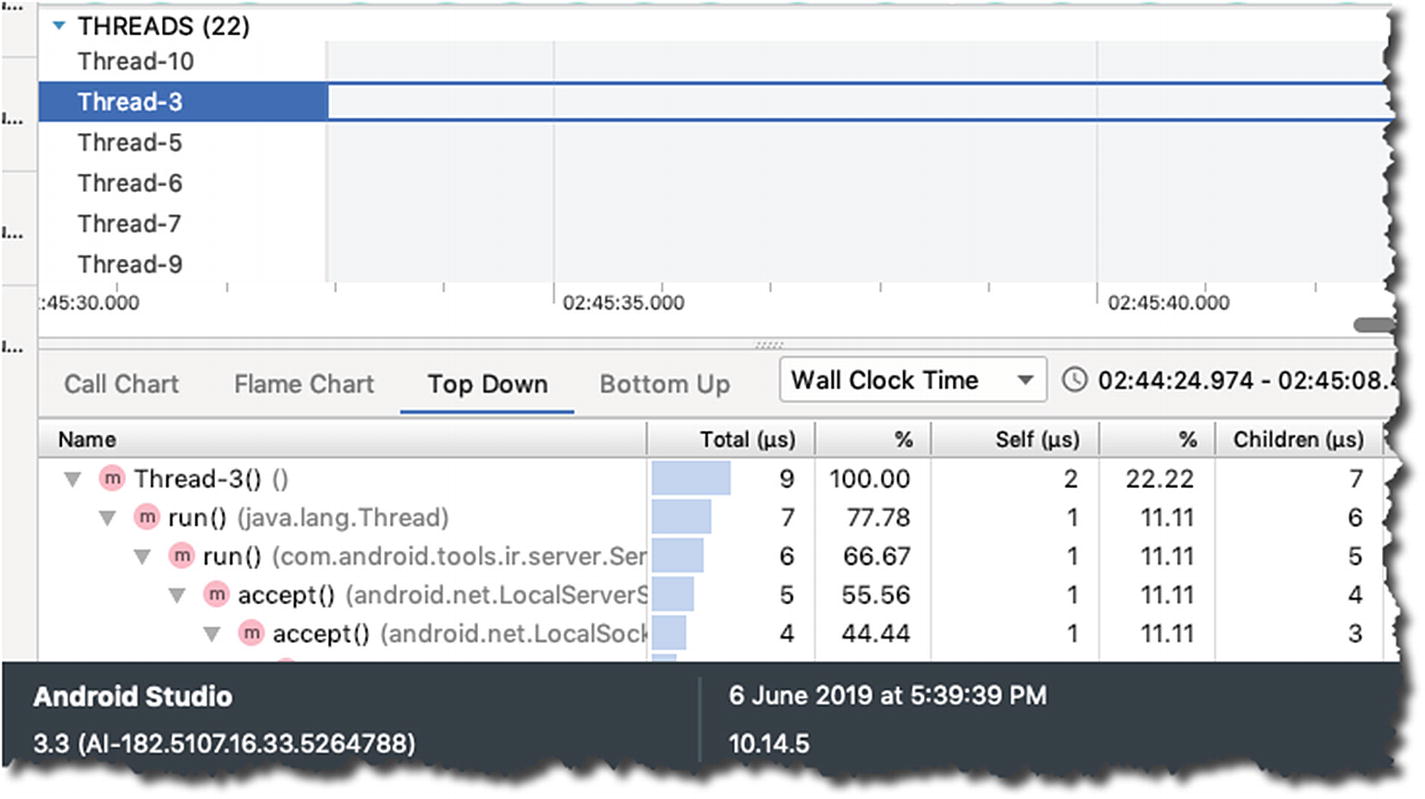
Inspecting the threads
Memory
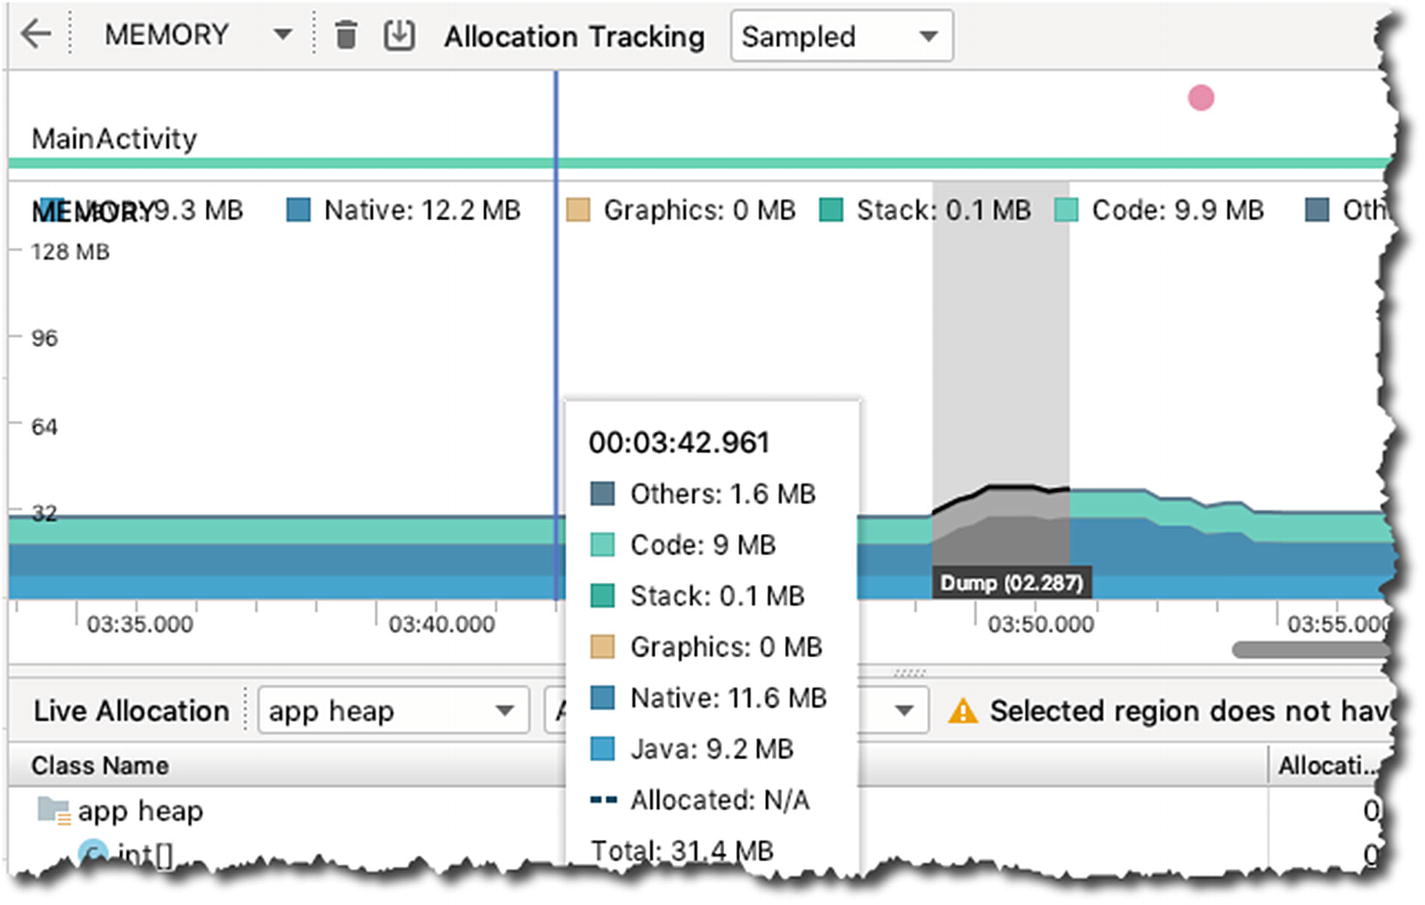
Memory view
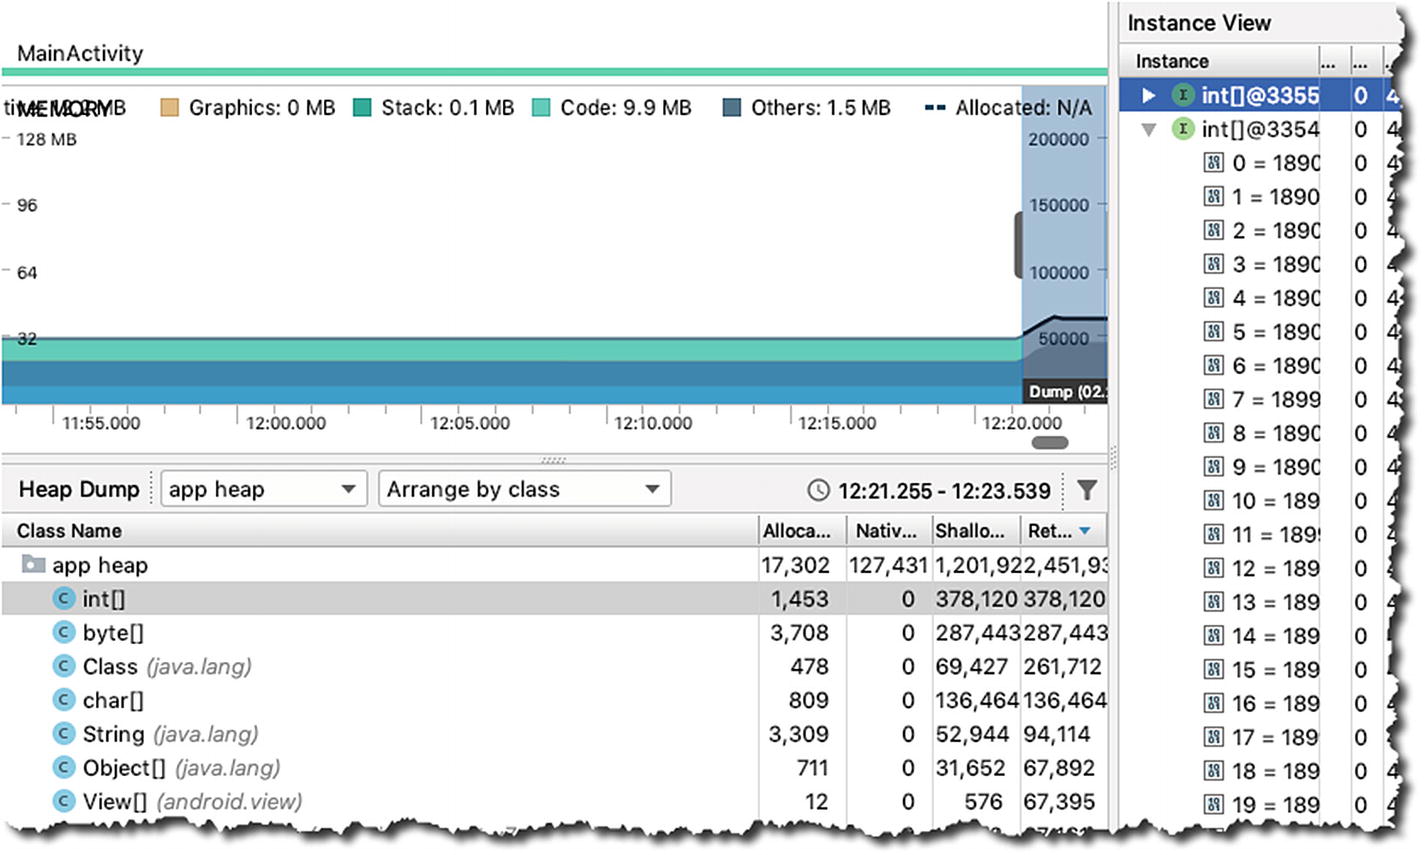
Java heap
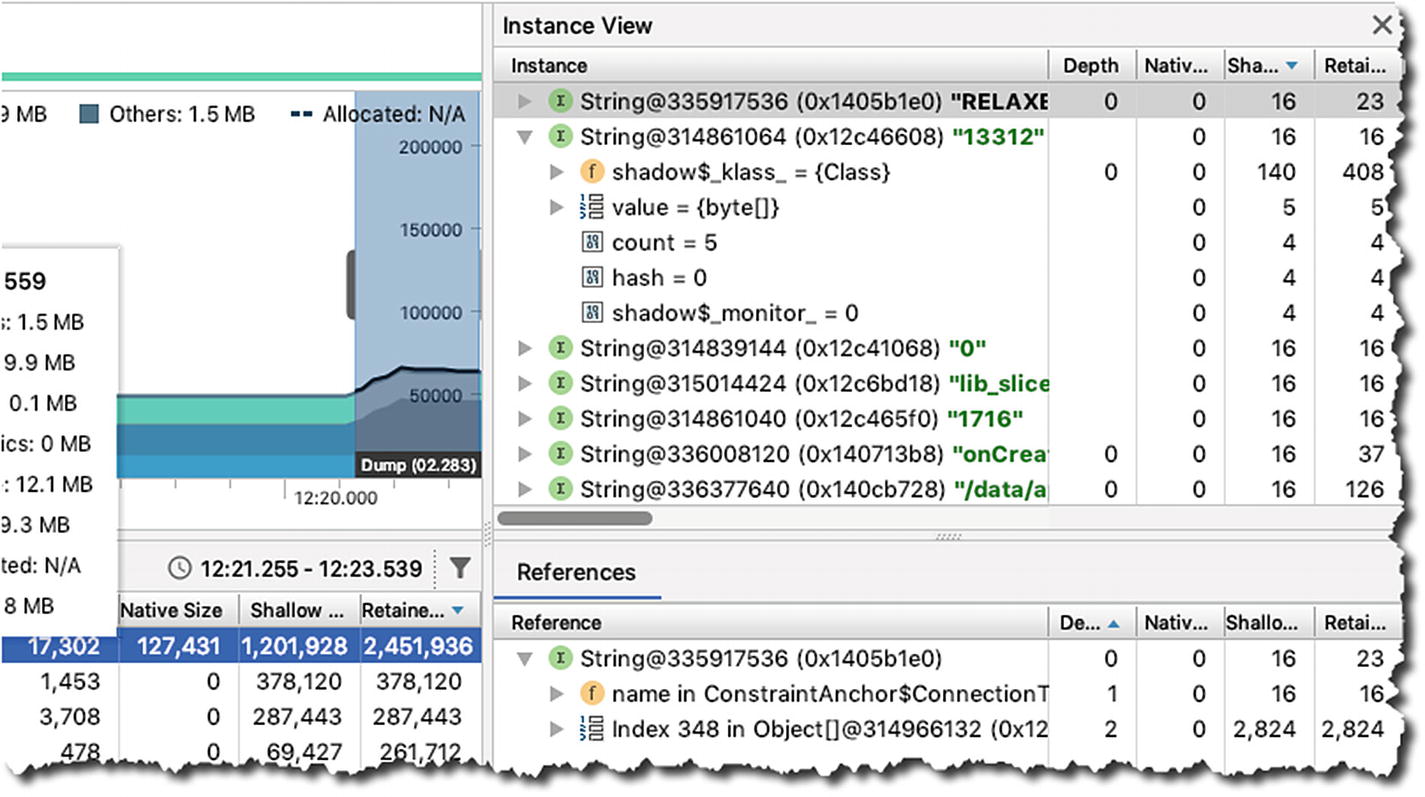
Instance view, Reference tab
The Reference tab can be very useful in finding memory leaks because it shows all the references pointing to the object you’re examining.
➊ | Click anywhere in the timeline of the memory graph to view the allocation tracker. This will show you a list of all objects that were allocated and deallocated at that point in time. |
➋ | This shows a list of all classes being used by the app at a point in time. |
➌ | This shows the list of all those objects allocated and deallocated at a specific point in time. |
➍ | The tracker even includes the call stack of the allocation. |
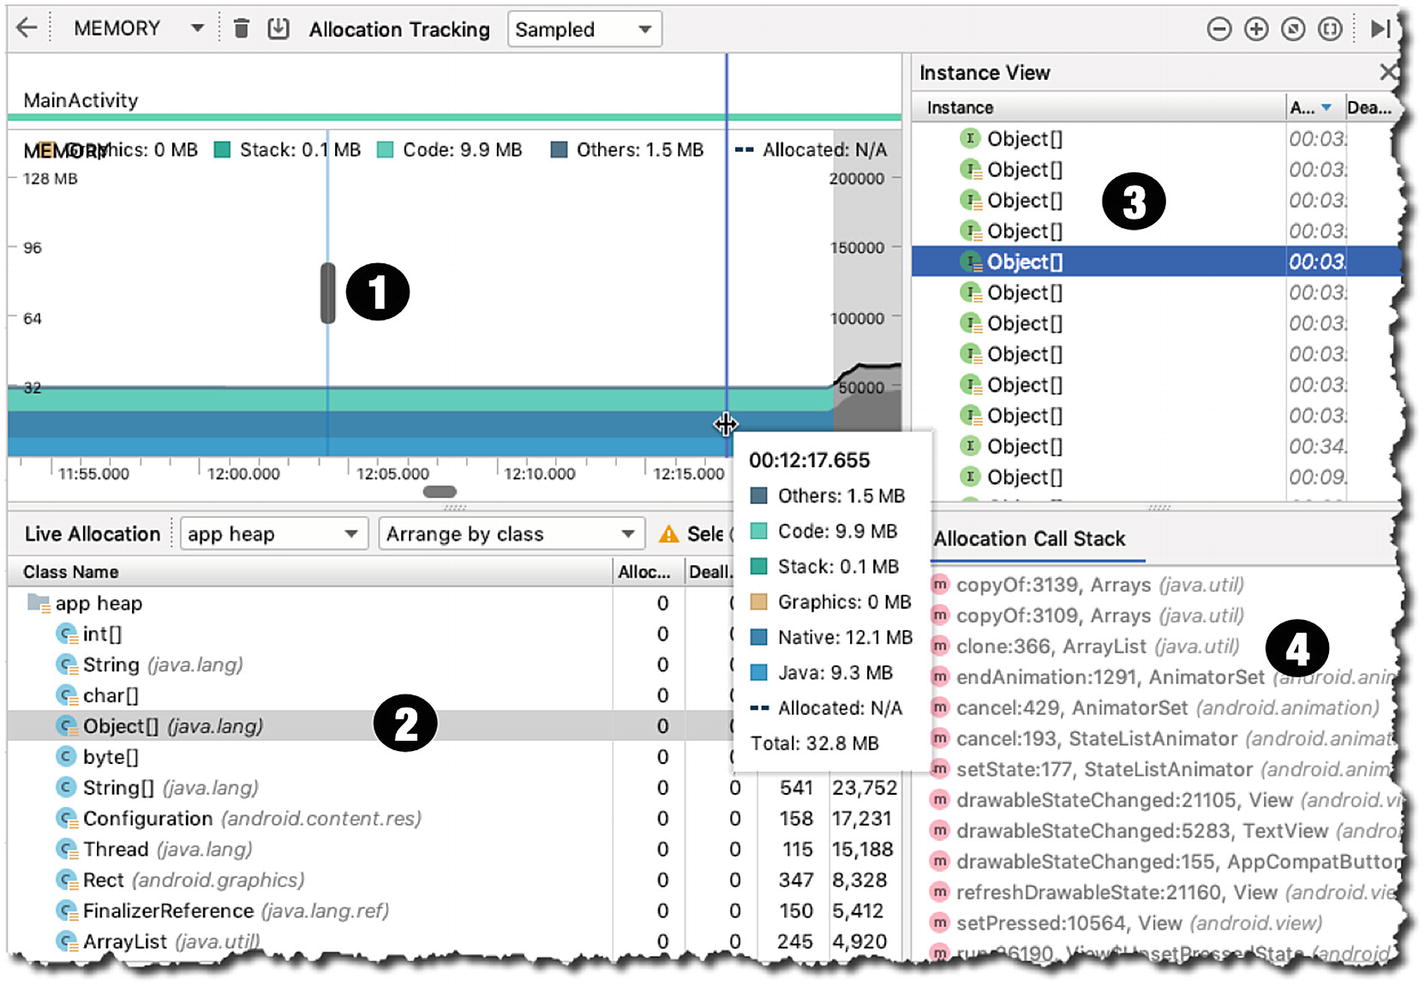
Allocation tracker
Network

Network profiler
Every time your app makes a request to the network, it uses the WiFi radio to send and receive data—the radio isn’t the most energy efficient; it’s power-hungry, and if you don’t pay attention to how your app makes network requests, that’s a sure way of draining the device battery faster than usual.
When you use the network profiler, a good way to start is to look for short spikes of network activity. When you see sharp spikes that rise and fall abruptly and they’re scattered all over the timeline, that smells like you could use some optimization by batching your network requests so as to reduce the number of times that the WiFi radio needs to wake up and send or receive data.
Energy
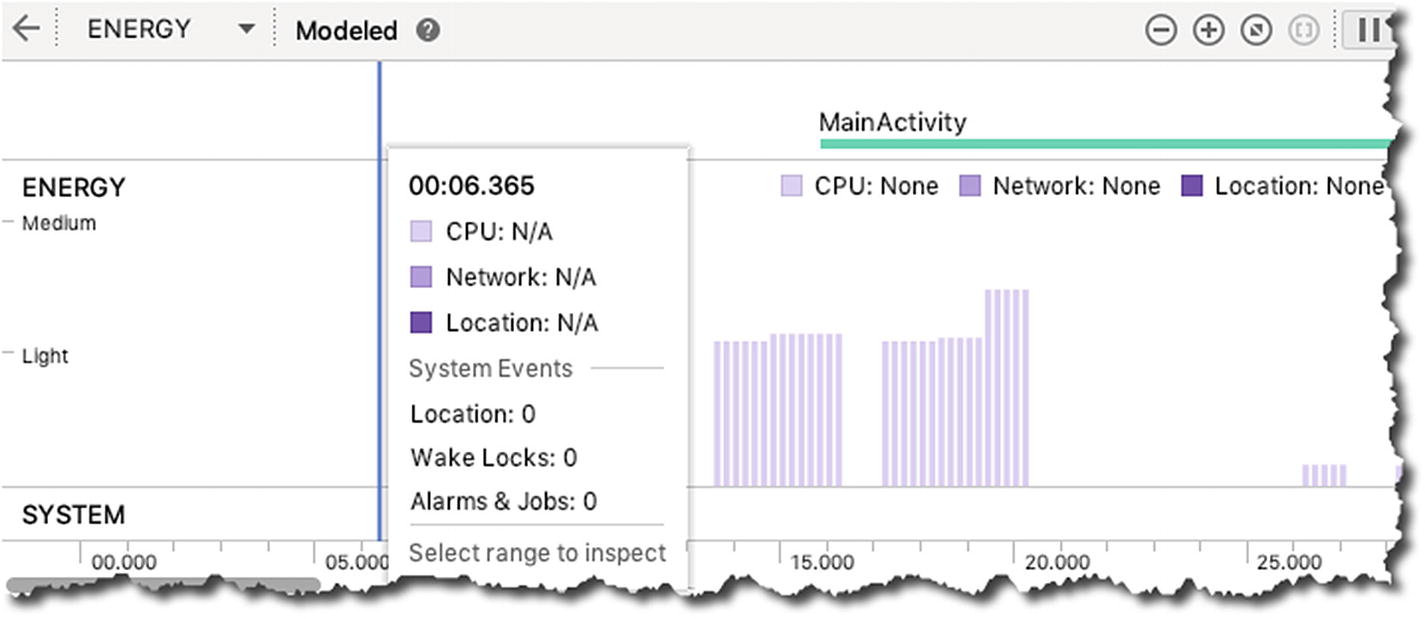
Energy profiler
A wake lock is a mechanism for keeping the CPU of the screen on when the device would otherwise go to sleep, for example, when an app plays a video, it may use a wake lock to keep the screen on even when there’s no user interaction—using a wake lock isn’t a problem, but forgetting to release one is; it keeps the CPU on longer than necessary which will surely drain the battery faster.
Alarms can be used to run background tasks that are outside your application’s context at specific intervals. When an alarm goes off, it can run some tasks; in case it runs an energy-intensive piece of code, you’ll definitely see it in the Energy profiler.
A job can perform actions when certain conditions are met, for example, when the network becomes available. You would usually create a job with JobBuilder and use JobScheduler to schedule the execution; when a job kicks in, you will be able to see them also in the Energy profiler.
That was a quick touch of the Android Studio Profiler; make sure you check out the official documentation at https://developer.android.com/studio/profile/android-profiler. Using the Profiler can give you insights about which part of your game code is hogging resources. Optimizing the use of resources can save battery; your users will thank you for it.
Key Takeaways
We’ve talked about various kinds of testing you can do for your games; you don’t have to do them all, but make sure you do the test that applies to your game.
Dev testing (unit testing) should be a core development task; try to get into the habit of writing your test cases together with your actual code.
Android Studio Profile can inspect your app’s behavior from under the hood. It can give you insights on how the app is consuming resources; use this tool when you’re doing performance testing.