
3.10 Approximations based on the likelihood
3.10.1 Maximum likelihood
Suppose, as usual, that we have independent observations ![]() whose distribution depends on an unknown parameter θ about which we want to make inferences. Sometimes it is useful to quote the posterior mode, that is, that value of θ at which the posterior density is a maximum, as a single number giving some idea of the location of the posterior distribution of θ; it could be regarded as the ultimate limit of the idea of an HDR. However, some Bayesians are opposed to the use of any single number in this way [see Box and Tiao (1992, Section A5.6)].
whose distribution depends on an unknown parameter θ about which we want to make inferences. Sometimes it is useful to quote the posterior mode, that is, that value of θ at which the posterior density is a maximum, as a single number giving some idea of the location of the posterior distribution of θ; it could be regarded as the ultimate limit of the idea of an HDR. However, some Bayesians are opposed to the use of any single number in this way [see Box and Tiao (1992, Section A5.6)].
If the likelihood dominates the prior, the posterior mode will occur very close to the point ![]() at which the likelihood is a maximum. Use of
at which the likelihood is a maximum. Use of ![]() is known as the method of maximum likelihood and is originally due to Fisher (1922). One notable point about maximum likelihood estimators is that if
is known as the method of maximum likelihood and is originally due to Fisher (1922). One notable point about maximum likelihood estimators is that if ![]() is any function of θ then it is easily seen that
is any function of θ then it is easily seen that
![]()
because the point at which ![]() is a maximum is not affected by how it is labelled. This invariance is not true of the exact position of the maximum of the posterior, nor indeed of HDRs, because these are affected by the factor
is a maximum is not affected by how it is labelled. This invariance is not true of the exact position of the maximum of the posterior, nor indeed of HDRs, because these are affected by the factor ![]() .
.
You should note that the maximum likelihood estimator is often found by the Newton–Raphson method. Suppose that the likelihood is ![]() and that its logarithm (in which it is often easier to work) is
and that its logarithm (in which it is often easier to work) is ![]() . In order to simplify the notation, we may sometimes omit explicit reference to the data and write
. In order to simplify the notation, we may sometimes omit explicit reference to the data and write ![]() for
for ![]() . We seek
. We seek ![]() such that
such that
![]()
or equivalently that it satisfies the so-called likelihood equation
![]()
so that the score vanishes.
3.10.2 Iterative methods
If ![]() is an approximation to
is an approximation to ![]() then using Taylor’s Theorem
then using Taylor’s Theorem
![]()
where ![]() is between
is between ![]() and
and ![]() . In most cases,
. In most cases, ![]() will not differ much from
will not differ much from ![]() and neither will differ much from its expectation over
and neither will differ much from its expectation over ![]() . However,
. However,
![]()
where ![]() is Fisher’s information which was introduced earlier in Section 3.3 in connection with Jeffreys’ rule. We note that, although
is Fisher’s information which was introduced earlier in Section 3.3 in connection with Jeffreys’ rule. We note that, although ![]() does depend on the value
does depend on the value ![]() observed, the information
observed, the information ![]() depends on the distribution of the random variable
depends on the distribution of the random variable ![]() rather than on the value
rather than on the value ![]() observed on this particular occasion, and to this extent the notation, good though it is for other purposes, is misleading. However, the value of
observed on this particular occasion, and to this extent the notation, good though it is for other purposes, is misleading. However, the value of ![]() does depend on
does depend on ![]() , because
, because ![]() does.
does.
It follows that as ![]() the value of
the value of ![]() tends to
tends to ![]() , so that a better approximation than
, so that a better approximation than ![]() will usually be provided by either of
will usually be provided by either of
![]()
the Newton–Raphson method, or by
![]()
the method of scoring for parameters. The latter method was first published in a paper by Fisher (1925a).
It has been shown by Kale (1961) that the method of scoring will usually be the quicker process for large n unless high accuracy is ultimately required. In perverse cases both methods can fail to converge or can converge to a root which does not give the absolute maximum.
3.10.3 Approximation to the posterior density
We can also observe that, since ![]() , in the neighbourhood of
, in the neighbourhood of ![]()
![]()
so that approximately
![]()
Hence, the likelihood is approximately proportional to an ![]() density, and so approximately to an
density, and so approximately to an ![]() density. We can thus construct approximate HDRs by using this approximation to the likelihood and assuming that the likelihood dominates the prior.
density. We can thus construct approximate HDRs by using this approximation to the likelihood and assuming that the likelihood dominates the prior.
3.10.4 Examples
Normal variance. For the normal variance (with known mean θ)
![]()
where ![]() , so that
, so that
![]()
In this case, the likelihood equation is solved without recourse to iteration to give
![]()
Further
![]()
Alternatively
![]()
and as ![]() , so that
, so that ![]() , we have
, we have
![]()
Of course, there is no need to use an iterative method to find ![]() in this case, but the difference between the formulae for
in this case, but the difference between the formulae for ![]() and
and ![]() is illustrative of the extent to which the Newton–Raphson method and the method of scoring differ from one another. The results suggest that we approximate the posterior distribution of
is illustrative of the extent to which the Newton–Raphson method and the method of scoring differ from one another. The results suggest that we approximate the posterior distribution of ![]() [which we found to be
[which we found to be ![]() if we took a conjugate prior] by
if we took a conjugate prior] by
![]()
With the data we considered in Section 2.8 on HDRs for the normal variance, we had n = 20 and S = 664, so that 2S2/n3=110.224. The approximation would suggest a 95% HDR between ![]() , that is the interval (13, 54) as opposed to the interval (19, 67) which was found in Section 2.8.
, that is the interval (13, 54) as opposed to the interval (19, 67) which was found in Section 2.8.
This example is deceptively simple – the method is of greatest use when analytic solutions are difficult or impossible. Further, the accuracy is greater when sample sizes are larger.
Poisson distribution. We can get another deceptively simple example by supposing that ![]() is an n-sample from
is an n-sample from ![]() and that
and that ![]() , so that (as shown in Section 3.4)
, so that (as shown in Section 3.4)

and the likelihood equation is again solved without iteration, this time giving ![]() . Further
. Further
![]()
and ![]() . This suggests that we can approximate the posterior of λ (which we found to be
. This suggests that we can approximate the posterior of λ (which we found to be ![]() if we took a conjugate prior) by
if we took a conjugate prior) by
![]()
Cauchy distribution. Suppose ![]() is an n-sample from C
is an n-sample from C![]() , so that
, so that
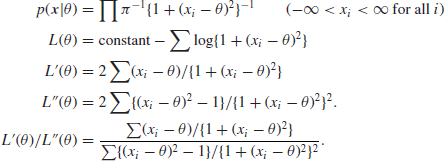
It is easily seen that
![]()
On substituting ![]() and using standard reduction formulae, it follows that
and using standard reduction formulae, it follows that
![]()
from which it can be seen that successive approximations to ![]() can be found using the method of scoring by setting
can be found using the method of scoring by setting
![]()
The iteration could, for example, be started from the sample median, that is, the observation which is in the middle when they are arranged in increasing order. For small n the iteration may not converge, or may converge to the wrong answer (see Barnett, 1966), but the process usually behaves satisfactorily.
Real life data from a Cauchy distribution are rarely encountered, but the following values are simulated from a C![]() distribution (the value of θ being, in fact, 0):
distribution (the value of θ being, in fact, 0):
![]()
The sample median of the n = 9 values is 0.397. If we take this as our first approximation ![]() to
to ![]() , then
, then
![]()
and all subsequent ![]() equal 0.179 which is, in fact, the correct value of
equal 0.179 which is, in fact, the correct value of ![]() . Since
. Since ![]() , an approximate 95% HDR for θ is
, an approximate 95% HDR for θ is ![]() , that is the interval (–0.74, 1.10). This does include the true value, which we happen to know is 0, but of course the value of n has been chosen unrealistically small in order to illustrate the method without too much calculation.
, that is the interval (–0.74, 1.10). This does include the true value, which we happen to know is 0, but of course the value of n has been chosen unrealistically small in order to illustrate the method without too much calculation.
It would also be possible in this case to carry out an iteration based on the Newton–Raphson method
![]()
using the above formula for ![]() , but as explained earlier, it is in general better to use the method of scoring.
, but as explained earlier, it is in general better to use the method of scoring.
3.10.5 Extension to more than one parameter
If we have two parameters, say θ and ![]() , which are both unknown, a similar argument shows that the maximum likelihood occurs at
, which are both unknown, a similar argument shows that the maximum likelihood occurs at ![]() , where
, where
![]()
Similarly, if ![]() is an approximation, a better one is
is an approximation, a better one is ![]() , where
, where
![]()
where the derivatives are evaluated at ![]() and the matrix of second derivatives can be replaced by its expectation, which is minus the information matrix as defined in Section 3.3 on Jeffreys’ rule.
and the matrix of second derivatives can be replaced by its expectation, which is minus the information matrix as defined in Section 3.3 on Jeffreys’ rule.
Further, the likelihood and hence the posterior can be approximated by a bivariate normal distribution of mean ![]() and variance–covariance matrix whose inverse is equal to minus the matrix of second derivatives (or the information matrix) evaluated at
and variance–covariance matrix whose inverse is equal to minus the matrix of second derivatives (or the information matrix) evaluated at ![]() .
.
All of this extends in an obvious way to the case of more than two unknown parameters.
3.10.6 Example
We shall consider only one, very simple, case, that of a normal distribution of unknown mean and variance. In this case,
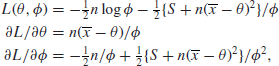
where ![]() , so that
, so that
![]()
Further, it is easily seen that
![]()
which at ![]() reduces to
reduces to
![]()
Because the off-diagonal elements vanish, the posteriors for θ and ![]() are approximately independent. Further, we see that approximately
are approximately independent. Further, we see that approximately
![]()
In fact, we found in Section 2.12 on normal mean and variance both unknown that with standard reference priors, the posterior for θ and ![]() is a normal/chi-squared distribution and the marginals are such that
is a normal/chi-squared distribution and the marginals are such that
![]()
which implies that the means and variances are
![]()
This shows that for large n the approximation is indeed valid.