1
Concepts and Approaches in Landscape Ecology
1.1 The Historical Development of Landscape Ecology as a Science
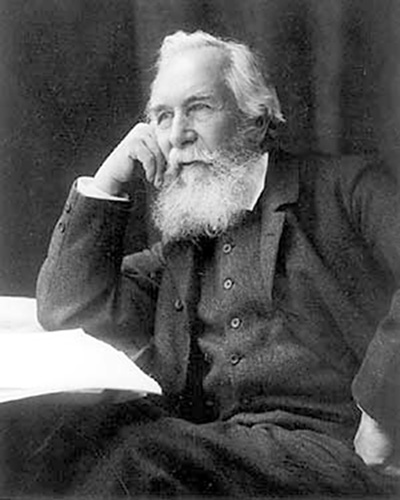
Ecology as a written science probably has its known beginnings in ancient Greece with Aristotle and particularly with his successor, Theophrastus, who was one of the first philosophers to study “the relationships between the organisms and their environment”. This definition of the term Ecology that was first used two millennia later by the German zoologist Ernst Haeckel, who, in 1866, associated the Greek words Oikos (house) and Logos (science) (Figure 1.1).

Figure 1.1 The Greek philosopher Theophrastus (371–287 BC) (left) and the German ecologist Ernst Haeckel (1834–1919 AC) (right).
Source: https://upload.wikimedia.org/wikipedia/commons/3/38/Theophrastus._Line_engraving._Wellcome_V0005785.jpg, https://upload.wikimedia.org/wikipedia/commons/2/2f/Ernst _Haeckel_2.jpg (3 December 2017).
Haeckel further expanded the definition of Ecology in his writings in 18691: “By ecology we mean the body of knowledge concerning the economy of nature, the investigation of the total relations of the animal both to its inorganic and to its organic environment; including above all, its friendly and inimical relations with those animals and plants with which it comes directly or indirectly into contact.”
Other subdisciplines of ecology focus on the study of the distribution and abundance of individuals of the same species (population ecology)2, on the interaction between populations (community ecology)3, or, especially after the very influential book published in 1953 by Eugene Odum4, on the study of ecosystems (systems ecology). Ecology has expanded from populations to communities and ecosystems, and more recently to landscape scales.
The English word “landscape” first appeared in the late sixteenth century when the term landschap was introduced by Dutch painters who used it to refer to paintings whose primary subject matter was natural scenery, associating the word “land” (of Germanic origin) and the suffix “schaft” or “scape”, meaning shape5 (Figure 1.2).

Figure 1.2 Landscape painting of Richmond castle (1639) by the Dutch landscape painter Alexander Keirincx (1600–1652).
Source: Yale Center for British Art, Paul Mellon Collection: Netherlandish Painters Active in Britain in the Sixteenth and Seventeenth Centuries, http://ezine.codart.nl/17/issue/46/artikel/netherlandish‐painters‐active‐in‐britain‐in‐the‐16th‐and‐17th‐centuries/?id=191 (17 February 2017).
In the seventeenth and eighteenth centuries, “landscape” continued to be associated with paintings, but a new meaning of the term developed when Alexander von Humboldt (1769–1857) started the new science of plant geography. Humboldt explored the visual qualities of painted landscapes transforming the concept of landscape from its primary visual meaning into an abstract entity by finding its ecological unity6 (Figure 1.3). The concept of landscape was moving from art to ecological science.

Figure 1.3 Painting of the German naturalist Alexander von Humboldt (1769–1859) (left) and photo of the German geographer Carl Troll (1899–1975) (right). https://en.wikipedia.org/wiki/Alexander_von_Humboldt#/media/File:Alexandre_humboldt.jpg, https://de.wikipedia.org/wiki/Carl_Troll (17 February 2017).
Source: Portrait of Alexander von Humboldt by Friedrich Georg Weitsch, 1806,
Following the work of Humboldt, it was another German geographer, Carl Troll, who first coined in 19397 the term “landscape ecology” hoping that a new science could be developed that integrated the spatial approach of geographers and the functional approach of ecologists (Figure 1.3).
However, the science of landscape ecology would be one of the latest forms of ecology to develop. It was not until the 1980s that the concept was more widely developed and works on landscape ecology started to be produced in Europe and in North America with the books by Vink (1983)8, Naveh and Lieberman (1984)9, and Forman and Godron (1986)10. After the publication of this latter book, which is now considered to be a main foundation of this science, references to landscape ecology started to become common in scientific literature and further developed after the beginning of the publication of the scientific journal of Landscape Ecology in 1987.
After that initial period, landscape ecology studies also became common in other basic and applied ecological journals. The development of landscape ecology was rapid and several important books were produced after the 1980s. In 1995 Forman published his comprehensive award‐winning book Land Mosaics: The Ecology of Landscapes and Regions11 (Figure 1.4).

Figure 1.4 The USA scientist Richard Forman (born 1935) with two of his fundamental books in Landscape Ecology.
Source: Harvard University, Graduate School of Design, http://www.gsd.harvard.edu/person/richard‐t‐t‐forman/ (2 May 2017).
Since 1995 several other books have been published by various authors in both Europe and North America, as in the Netherlands by Zonneveld (1995)12, in Italy by Farina (1998)13 and by Ingegnoli (2002)14, in France by Burel and Baudry (1999)15, in the United States by Turner, Gardner, and O´Neill (2001)16, by Coulson and Tchakerian (2010)17, and by Forman, again, with others, on Road Ecology: Science and Solutions (2003)18 and on Urban Ecology: Science of Cities (2014)19.
Also, many edited books with applications of landscape ecology analyses were published since the late 1980s, such as those by Turner (1987)20, Turner and Gardner (1991)21, Bissonette (1997)22, Klopatek and Gardner (1999)23, Sanderson and Harris (2000)24, Wiens, Moss, Turner, and Mladenoff (2006)25, Wu and Hobbs (2007)26, McKenzie, Miller, and Falk (2011)27, and Perera, Drew, and Johnson (2012)28.
Landscape ecology was definitely settled as a new science and several books were published on the corresponding quantitative methods, as that in the Netherlands by Jongman, ter Brak, and van Tongeren (1995)29 on data analysis in community and landscape ecology. A major development of analytical methods used in landscape ecology came in 1995 with the release of the FRAGSTATS software in association with the publication of a very useful USDA Forest Service General Technical Report by McGarigal and Marks30. Due to its popularity the program has been updated and recently upgraded to accommodate ArcGIS10 (version 3.4) and it has been central to other books for quantifying and measuring landscape characteristics, such as that of Leitão, Miller, Ahern, and McGarigal (2006)31. From this perspective, it is also important to recognize the book edited by Gergel and Turner (2002)32 covering many of the quantitative methods in landscape ecology.
During the last decades the science of landscape ecology developed with input from new technologies (Figure 1.5) and contributions from many other disciplines such as geology, soil science, plant ecology, wildlife ecology, conservation biology, genetics, human ecology, urban ecology, and landscape architecture. In addition, landscape ecology was enhanced by the rapid advancement of computer sciences, remote sensing, geographic information system technologies, and landscape modeling. Remote sensing images obtained from satellite platforms displaying features of the Earth’s surface first became available in the latter half of the twentieth century. Finally, landscape ecologists were able to view landscape patterns over large land areas and it became increasingly feasible to quantify change in both spatial and temporal dimensions. Currently the landscape ecology perspective is essential in addressing broad‐scale complex issues such as those associated with global change.
For example, the Landsat satellites have been collecting multispectral images at 15–80 m resolution since the 1970s at a 16‐day interval and the moderate‐resolution imaging spectroradiometers (MODISs) have been collecting 250–1000 m resolution images every 1–2 days since 2002. Technological advancement has also been made in data collection at very fine spatial scales. Light detection and ranging (LiDAR) is a technique with the ability to map objects in three dimensions by measuring the time it takes for a laser signal to travel from the sensor to the object and back to the sensor. Sensors mounted on unmanned aircraft systems (UASs) can provide images with subcentimeter resolutions.

Figure 1.5 The top image is a LiDAR acquisition of hundreds of conifer trees. The lower left image shows the branching structure of a tree and the lower right image is a synoptic view of one complete 360 degree scan of a mixed conifer forest near Moscow, Idaho, USA. The images were taken with a Leica green terrestrial laser scanner. Colors correspond to the relative return intensity of the LiDAR instrument, with greens and yellows showing high intensity returns and red showing low intensity returns.
Source: Courtesy of Lee Vierling and Jan Eitel, University of Idaho.
Computer‐based geographic information systems (GISs) have made it possible for landscape ecologists to handle the large amounts of spatial data available today. GIS data are constructed of spatial representations of points, lines, polygons, or pixels, accompanied by a database that describes each feature and its location. Increasing power of computational systems continues to allow us to analyze datasets at larger extents and with finer resolution.
1.2 Hierarchical Levels in Ecology
The hierarchy of ecological units and related sciences has been well represented as a set of Chinese boxes, each fitting inside the next larger box (Figure 1.6).

Figure 1.6 The ecological hierarchy and its scientific disciplines through five levels of integration (adapted from Koestler by Naveh and Liebermann, 1994)33.
This hierarchy of disciplines shows that science can develop in two opposite directions: downwards to the genetic and molecular level and upwards from the organism to the population, community, habitat/ecosystem, and landscape (total human ecosystem) level.
The combination of the different levels to understand ecological processes and spatial patterns is fundamental in Landscape Ecology. The combination of the two more extreme levels (genes and landscapes) has been the basis of the recent development of the new discipline of Landscape Genetics.
The emphasis on the genetic levels has been made possible by the fast development of modern equipment, methods, and techniques. Also, the emphasis on genes has been encouraged by the very challenging views of authors such as Richard Dawkins, who, in his 1976 book The Selfish Gene34 expresses his “stranger than fiction” feelings about the “astonishing truth” that “we are survival machines – robot vehicles blindly programmed to preserve the selfish molecules known as genes”.
The combination of Landscape and Genetics leading to the development of Landscape Genetics occurred after 2003 following the work of Manel and others35 with the aim of understanding how landscape features influence genetic variation, an approach that has the advantage of not requiring discrete populations to be identified in advance. However, it requires knowledge of genetics and methods using molecular markers or genomic scans that are beyond the scope of this book.
Landscape Genetics has evolved and has stimulated research in various areas, as in the study of the effect of landscapes on evolutionary processes36. The main emphasis of landscape genetics has nevertheless continued to be on the processes and patterns of gene flow37, that is, how genes are incorporated into the gene pool of one population from other populations. This involves the detection of genetic variation and the analysis of its relation to landscape characteristics, as in the existence of barriers or of habitats that facilitate gene flow.
As the landscape characteristics that influence gene flow are the same as those that influence the movement of organisms from one habitat patch to another through the landscape, the same landscape metrics (habitat fragmentation or connectivity) apply to both gene flow and organism movements.
Therefore, for the approach and the structure of this book we have selected the organism as our focus from which we will analyze landscapes. The organism‐centered approach has an advantage in that most people can readily identify with the individual organism and its life‐sustaining requirements.
The individual organism, the basic unit of consideration, can be aggregated into populations (individuals of the same species living in the same area), populations can be aggregated into communities (populations of different species living in the same patches), and patches (representing different habitats) can be aggregated into landscapes. Greater and greater numbers of patches can be aggregated to create larger and larger landscapes.
1.3 The Spatial Hierarchy of Land
Similar to the ecological hierarchy, there is also a spatial hierarchy of land. Forman illustrates this hierarchy well: “Suppose you had a giant zoom lens hooked up to your personal spaceship. You begin with a view of the whole planet, and slowly and evenly close the lens until you have a microscopic view of soil particles. At any point you would probably see a mosaic, a heterogeneous pattern of patches and corridors”38 (Figure 1.7).

Figure 1.7 The spatial hierarchy of land from the planet to the Iberian Peninsula and northern Africa, to the central Portugal region, to the city of Lisbon, to a mosaic of urban and green patches, and finally to the individual buildings and trees around the Astronomical Observatory of Ajuda in two scales. Viewing altitudes range from 5 × 10⁷ m for the planet to 5 × 10² m with all the intermediate images in a sequence of powers of ten, 107 m to 103 m.
Source: Google Maps.
We can now better define, in this hierarchy of land, the relationship between concepts such as ecosystems and landscapes. Ecosystems, as the concept was initially described by Tansley39, and landscapes have the common characteristic of not having a predetermined spatial scale. The scale of each can be set by the user. However, ecosystem ecology, as developed by Odum40, focuses on the effects of ecological processes such as nutrient cycling, the hydrologic cycle, and energy flow, and their influence on the relationships among plants, animals, air, water, and soil within a spatial unit. Landscape ecology is unique in its focus on the relationships among spatial units. Thus, landscapes must be heterogeneous with respect to at least one type of element.
Following these concepts it is now possible to define landscape as “a heterogeneous land area composed of a mosaic of interacting spatial units”. According to this definition there is not a specific size for a landscape or a specific scale for the analysis but they should be meaningful to the particular organism or process of interest. Also, according to the objective of the analysis, the various spatial units present in the landscape can be represented by different landscape elements, such as patches, lines, or points.
1.4 Fundamental Concepts: Landscape Scale and Size, Pattern, Process, and Change
A frequently asked question is “How does the landscape ecology approach differ from that of the other types of ecology? What are its fundamental concepts?” This is difficult to answer precisely. Many scientists consider the broad spatial and temporal scales that are often studied by landscape ecologists as an important distinction. However, landscapes need not be defined as broad scale and nor are broad scales the sole dominion of landscape ecologists.
Certainly those ecologists who study the biological response to long‐term paleoclimatic change or primary ecological succession have a long‐term perspective. Many other ecologists also study ecosystems with very broad spatial scales. In addition, landscape ecological approaches may be applied to small areas over short time periods, such as movements of small mammals within a landscape mosaic.
Perhaps the distinguishing feature of landscapes, regardless of their spatial or temporal scale, is that they are, by nearly all definitions, composed of mosaics of interacting patches of different types. The arrangement of these patches affects the nature of their interactions and the arrangement changes with time, as do the interactions (Figure 1.8).

Figure 1.8 Time and space scales of disturbances, biotic responses, and vegetational patterns as summarized by Delcourt and Delcourt41.
Other ecological disciplines attempt to minimize differences between sampled patches and develop stratified sampling strategies to account for and minimize these differences. Landscape ecology has emphasized the inclusion of the heterogeneity that is present.
From the perspective of an organism, we may define landscape as the area containing a mosaic of patches that are meaningful to its perception of the surrounding environment. As a consequence the extent (or size) of a landscape (overall area encompassed by its boundary) differs among organisms, generally between its normal home range and its regional distribution42.
The importance of considering the various perceptions of the environment is well illustrated in the work of McGarigal and Marks43: “Because the eagle, cardinal and butterfly perceive their environments differently and at different scales, what constitutes a single habitat patch for the eagle may constitute an entire landscape for the cardinal, and a single habitat patch for the cardinal may comprise an entire landscape for the butterfly that perceives patches on an even finer scale” (Figure 1.9).

Figure 1.9 Changing perception of the environment depending on organism scale44.
Also, the recognition of pattern depends on the size of the individual units of observation (grain) used in the representation of the landscape, which is in turn generally associated with scale. As in photography, the ability to recognize pattern is also related to contrast, or the amount of difference between adjacent elements and the relative abruptness of their boundary45. The recognition of pattern is therefore related to grain and contrast but the perception of the whole depends more on the interrelations of the elements than on their details.
A simple illustration of the process of pattern recognition is demonstrated by the comparison of satellite images of western North America (Figure 1.10). It is not necessary to have a very fine grain image to start detecting the patterns. In the image in the middle the western coast is already recognized without full knowledge of details of each pixel but simply by the perception of the whole.

Figure 1.10 Satellite Images of the western coast of North America with different pixel sizes (grain). The general pattern can already be recognized in the image with intermediate grain.
Source: Google Maps.
Similar illustrations are presented by Naveh and Lieberman46 as a demonstration of the importance of the holistic systems approach. They suggested that the comprehension of the landscape is better achieved by the identification of the structural relationships of the components than by their detailed study. This represents the advantage of landscape ecology over community and systems ecology in the recognition of pattern.
Landscape ecology is also an attractive approach to both the study and management of natural and human‐dominated ecosystems for a number of reasons. The inclusion of a mosaic of interacting patches presents a more realistic setting. It is certainly well known that patches in a mosaic often interact47.
In forest management, for example, this knowledge has been used for generations when planning timber harvest units where natural regeneration from seeds produced in surrounding uncut areas (patches) was expected. For this process the temporal scale is set by the harvesting age and the spatial scale by the seed dispersion distance (Figure 1.11).

Figure 1.11 Forest pattern resulting from wood harvesting in Western Oregon, USA.
Source: Marli Miller, geologypics.com, http://www.marlimillerphoto.com/images/Res‐58lr.jpg.
However, if initially focusing on plants and animals in more natural environments, the concept of a landscape also typically includes human activity48. Humans have influenced all ecosystems on the planet and in agricultural and urban landscapes human activity is a dominant factor in determining the mosaic expressed on the land.
As previously mentioned, there is no specific temporal or spatial scale at which landscape ecology focuses, as the appropriate scale varies with the objective of the analysis. From the perspective of humans, a landscape may be a kilometer‐wide area and patches can then be approximately 1–10 ha in natural vegetation, but may be larger or smaller in human‐dominated landscapes such as urban or agricultural landscapes (Figure 1.12). As for temporal scales, humans tend to view short‐term processes as occurring within a small fraction of human lifespans and long‐term processes as occurring in multiple human lifespans.

Figure 1.12 For many humans the size of the perceived landscape was for a long time limited by borders or walls. The walls of the city of Bragança, Portugal.
Source: F. Pratas, 2007, https://commons.wikimedia.org/w/index.php?curid=2443851.
In a very influential paper, Monica Turner49 referred to landscape ecology as the study of the reciprocal influences of pattern (structure) on process (function) and change (dynamics) of those interactions through time. She further indicated that landscape structure should be quantified to understand the relationships of pattern with ecological processes, as in the understanding of the influence of spatial heterogeneity in the spread of disturbances or the flows of energy, matter, nutrients, and organisms.
The assessment of landscape structure, function, and change through time is intended to make it possible to understand the dynamic relationships between pattern and process. However, as Monica Turner49 rightly pointed out, as landscapes are spatially heterogeneous areas, the measurement of spatial pattern and heterogeneity is dependent upon the scale at which the measurements are made and the structure, function, and change of landscapes are themselves scale‐dependent, and the scale at which studies are conducted may profoundly influence the conclusions.
1.5 The Representation of the Landscape and its Elements
From the beginning of cartography map features have been described by points, lines, and polygons (Figure 1.13). Cartographers have used points to identify the location of small islands or cities, lines to illustrate river courses or roads, or polygons for bigger islands or continents.

Figure 1.13 Nicolas Desliens Map of the World (1566).
Source: Nicolas_Desliens1.JPG, https://commons.wikimedia.org/wiki/File:Nicolas_Desliens_Map(1566).jpg#/media/File:Nicolas_Desliens_Map_(1566).jpg (17 February 2017).
.jpg#/media/File:Nicolas_Desliens_Map_(1566).jpg)
With aerial photography and satellite imagery, grid‐based or raster data provided new ways to represent the same landscapes in very different ways (Figure 1.14).

Figure 1.14 Land cover patterns in the Northern Great Plains, South Dakota, USA.
Source: Google Maps.
However, in many cases, these raster maps derived from aerial photographs or satellite images have to be transformed to vector maps for simplicity of analysis. In spite of the increasing use of aerial photography and satellite imagery, much of the spatial analysis continues to be done with points, lines, and polygons at the various scales, with geographic information systems using the vector digital representation of landscapes in two‐dimensional (2D) maps (Figure 1.15). Also the third (vertical) dimension can be captured in 2D vector maps by using elevation contour lines (Figure 1.16).

Figure 1.15 The automatic transformation of a digital aerial photograph of an area with forests (cork oak), agriculture, urban development, and roads in Rio Frio, close to Lisbon, into a vector map of land cover classes using the eCognition software, showing the original image (upper), the automatic delineation of polygons (center), and the resulting vector map with different classes (lower).
Source: Unpublished report by Cadima and Rego for the Management Plan of the Herdade de Rio Frio (Portugal).

Figure 1.16 Contour lines represent 3D objects in 2D maps.
Source: Gemma Nelson, https://www.ordnancesurvey.co.uk/blog/2015/11/map‐reading‐skills‐making‐sense‐of‐contour‐lines/.
In the vector representation of landscapes in maps, points are often used to represent the location of small objects (at the selected scale). Points can be associated with individual trees, buildings, and water holes, while lines can be used to look at coastlines, rivers or road networks, and polygons to represent patches with different land cover types, such as agricultural fields, urban areas, forests, shrublands, grasslands, or sand beaches. The elements of the landscape can therefore be spatially represented in a map by these three different landscape elements (points, lines, or/and patches), as illustrated in Figure 1.17. The detection of the pattern of a landscape can be assessed by the detection of the pattern of the different landscape elements (Figure 1.18).

Figure 1.17 Aerial image of Porto do Carro, Portugal, showing a mosaic including some scattered trees and isolated houses (points), river and road networks (lines), and forest, agricultural, and urban areas (patches).
Source: Google Earth, 2015.

Figure 1.18 The pattern of landscape elements viewed from an airplane can give “landscape detectives” extensive information about the ecology of a landscape.
Source: Karen Bloomberg, http://10steps.sg/inspirations/photography/11‐types‐of‐beautiful‐photos‐from‐plane‐window/ (17 February 2017).
We can therefore recognize from the scale of the mosaic the following spatial units representing landscape elements:
- Point – representing a significant landscape feature whose geographical location is important but whose area is not relevant for the organism or the landscape process of interest. In fact, points do not exist, but they can represent small patches for the purpose of the analysis.
- Line – representing a significant landscape feature that differs from the adjacent land on both sides, whose location and linear dimension are important for the functions of conduit (ecological line corridor), filter, or barrier but whose width is not relevant for the organism (does not provide habitat) or the process of interest. In fact, lines do not exist, but if a patch is long and its width is small at the scale and for the purpose of the analysis, lines can be an adequate representation of the object. However, if width is small but relevant the representation should be a strip corridor, which would be represented with a patch.
- Patch – representing a relatively homogeneous nonlinear area that differs from its surroundings. Differences between patches may be based on ecological (i.e. species composition) or other differences (i.e. land ownership, different watersheds) (Figure 1.18).
Forman50 further suggests the possibility of the recognition of another landscape element, the matrix or the background type (or class) in a mosaic, characterized by “extensive cover, high connectivity, and/or major control over dynamics”.
The same approach has been extended to professions of a different nature. Rapidly these approaches were demonstrated to be useful in Landscape Architecture and Land‐Use Planning51, and works in the urban context creating a new branch of this science: the Urban Landscape Ecology (Figure 1.19).

Figure 1.19 A book on Urban Landscape Ecology52 resulting from a Conference of the International Association for Landscape Ecology in the United Kingdom in 2014 with the participation of academics, practitioners and policy makers from around the world.
Source: Routledge, https://www.routledge.com/info/contact.
However, Landscape Ecology has also been expanding in its applications outside terrestrial ecosystems. Landscape Ecology has recently been used as a theoretical and analytical frameworks for “evaluating the ecological consequences of spatial patterns and structural changes in the submerged landscapes of coastal ecosystems”53. This expansion was the beginning of a new branch of Landscape Ecology: Seascape Ecology. Similarly to terrestrial landscape elements, the concepts of patches, matrix, and mosaics can also be defined and analyzed in submerged landscapes (Figure 1.20).

Figure 1.20 The seascape can be represented as (A) above: a patch‐matrix model with seagrass patches surrounded by a matrix of sediment or (B) below: a patch‐mosaic model, more complex, with different patch types originating more complex metrics54.
Source: Wedding, L.M., Lepczyk, C.A., Pittman, S.J., et al. (2011) Quantifying seascape structure: extending terrestrial spatial pattern metrics to the marine realm. Marine Ecology Progress Series, 427, 219–232.
The branch of Seascape Ecology has developed in various contexts (Figure 1.21). In Portugal a recent study used this approach to evaluate the characteristics of the underwater landscape related to SCUBA diving activity in the Algarve55. The development of this new scientific branch has recently resulted in a book written in 2017 by a pioneer of this new branch of science with the appealing title: Seascape Ecology: Taking Landscape Ecology into the Sea56.

Figure 1.21 Seascape Ecology was the subject of the Annual Conference of the International Association of Landscape Ecology UK in 2015.
Source: wikipedia.org, https://en.wikipedia.org/wiki/Underwater (3 December 2017).
Regardless of the nature of the landscape (urban or rural, terrestrial or submerged) there are common features in detecting the pattern of the landscape and its elements. This allows the current book to be applied to the various types of landscapes to be analyzed as they can be represented by elements such as points, lines, or patches that are changing in time due to landscape processes.
In this book we follow a sequential approach starting from the analysis of pattern of groups of points to groups of lines and then patches, presenting some possible interpretations associating the detected patterns of processes before discussing methods of analysis of change.
Key Points
- Landscape can be defined as a heterogeneous land area composed of a mosaic of interacting spatial units, or mosaics of interacting patches of different types.
- Landscape ecology is the study of the reciprocal influences of pattern (structure) on process (function) and change (dynamics) of those interactions through time. Landscape structure should be quantified to understand the relationships of pattern with ecological processes.
- Landscape analysis does not have a specific size or scale. Size and scale should be meaningful to a particular organism or process of interest.
- Temporal or spatial scale at which landscape ecology focuses varies with the objective of the analysis.
- The extent (or size) of a landscape differs among organisms or process of interest, and the recognition of pattern depends on the grain (or size of the individual units of observation) used in the representation of the landscape.
- The measurement of spatial pattern and heterogeneity is dependent upon the scale at which the measurements are made and the structure, function, and dynamics of landscapes are themselves scale‐dependent; the scale at which studies are conducted may profoundly influence the conclusions.
- A landscape can be spatially represented in a map by different landscape elements: points, lines, and/or patches.