
Chapter 3
Operationalizing Strategy
Models, whether conceptual or statistical, are a big part of Dynamic Customer Strategy. To accelerate organizational learning, we use conceptual models to make our view of how the market operates explicit so that everyone can understand not just the what of strategy but also the why.
But conceptual models don't feed our families—we have to take our conceptual models and put them into operation. That's the subject of this chapter—taking the conceptual and making it operational. Using our DCS and Big Data Framework in Figure 3.1, you can see we focus on that relationship between the conceptual and what we actually do, the operational.
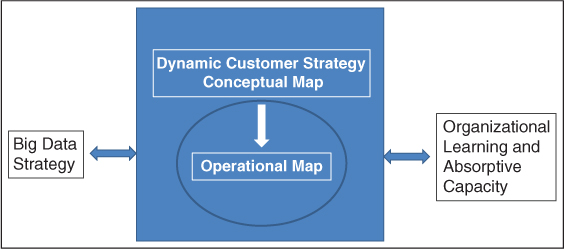
Figure 3.1 The Big Data and Dynamic Customer Strategy Framework
In this chapter, we focus on making the conceptual real, or operation, as highlighted with the oval in the framework.
Conceptual to Operational
If you recall in Chapter 2, we discussed models of loyalty to understand how you build your concept map. In that chapter, we emphasized the concept map, but here in Figure 3.2, I've condensed the model to focus on performance in order to simplify our discussion. Recall, too, that there are two types of loyalty: behavioral and attitudinal. Which one is meant by our model? Which form of loyalty is more important?

Figure 3.2 A Simple Model of Loyalty
For nearly two decades, the promises of increased customer loyalty have included the following:
- Willing to pay a price premium
- Insulation from competitive actions
- Willingness to forgive a bad experience or mistake
- Initiating of referrals
- Greater frequency of purchases
- Higher overall spending or CLV1
These benefits of loyal customers, however, are not equally attitudinal and behavioral. Being willing to pay a price premium may be a behavioral form of loyalty if switching costs are high, while telling friends about your product is an outcome of attitudinal loyalty.
Which is more important? Some consider attitudinal loyalty more important, because having people like your brand is necessary to get positive word of mouth, and attitudinal loyalty is what insulates you against competitive action. Attitudinal loyalty also gains you a pass when you screw up. But attitudinal loyalty doesn't mean high levels of purchasing or consumption. Pringles, the potato chips that are highly processed and stacked in a can, were the favorites of low-frequency consumers because the chips would stay fresh longer. These infrequent consumers of potato chips loved Pringles but they didn't buy much, a fact that nearly doomed the brand. Fortunately, Pringles was able to find a consumer segment with higher levels of consumption.
Some segments have no affinity toward a brand but they still become behaviorally loyal. One participant in our study on data cultures identified a particular segment where speed of service was most important.2 In this segment, liking was all about speed—get speed to serve right and you had their business.
So the question of which is more important depends on what you're trying to achieve and how your market operates. If your market will give you behavioral loyalty but you're trying for attitudinal, you may be wasting your time, effort, and money.
Let's think more deeply about the customer segment desiring speed of service. This segment defines performance based on speed, but what does speed to serve mean? Does it mean how long they wait to get served, how long it took to be served once they talked to a clerk, or how long it took from the point they drove into the parking lot to the point when they left? Or did they really know how to measure it and was their perception something you could influence?
The distinction between these measures isn't unimportant. If they mean total time from turning into the parking lot to leaving the parking lot, you have a lot more to manage than if they mean only the checkout process. Either way, you've got to understand what they mean when they say “fast.”
Now you have made the changes to your operations to increase speed of service—loyalty should also change, right? Do we wait to see if sales have changed? We could—but what else changed at the same time? Recall from the last chapter the concept of control. We have to control for other potential causes so we can determine to what extent our changes influenced sales.
Further, we need to understand if our model is operating the way we think it is. We need, therefore, some measure of loyalty as well.
If we're assuming that our form of loyalty is behavioral, we might look at share of wallet (SOW), or the percentage of the buyer's budget we get. If SOW increased, we increased behavioral loyalty. (Note: If SOW was already 100 percent or close to it, then we already had behavioral loyalty and something else happened.)
You might define behavioral loyalty differently, but this use of SOW to mark behavioral loyalty is an example of an operational definition. We have operationally defined behavioral loyalty at the concrete level (as opposed to the conceptual, or abstract, level) as SOW.
Operational Definitions
How would your customers define performance? What factors in their experience as your customers influence their level of repeat purchasing or SOW? Take a sheet of paper or find a blank page at the back of the book and write out a list. You don't have to simply list those things you're good at—list instead what's important to your customers.
Take your website, for example. What is it about that site that drives repeat visits and purchases and what is it that drives visitors away? You now have things you can do, because you've begun making the conceptual concrete—you've begun to make your model operational.
Many execs I work with struggle a bit with developing the conceptual model and taking it operational. First, many tend to think of models in the same form as the example: a few variables in a row. Think back to the Target example. Yes, there were only three variables, but they weren't linear. Or think about Porter's Five Forces: There's a conceptual model that just from the title you can guess has more than three variables.
Let's walk through an example. We'll substitute satisfaction for performance. In fact, I'm not sure that these two concepts are all that far off anyway, but I'll leave that discussion for Chapter 8. Right now, let's just say they are the same.
Satisfaction with…what? I'm going to build out a B2B example but call out retailing versions as we go along because conceptually the same things apply.
In a study I did of office equipment buyers, and illustrated in Figure 3.3 3 I found that satisfaction could be broken down into at least four distinct categories:
- Satisfaction with the product (what we typically think of when we think of satisfaction)
- Satisfaction with the salesperson (or checkout or the clerk in a retail store)
- Satisfaction with the buying process (or the shopping experience and ambiance of the store)
- Satisfaction with the service
Figure 3.3 Satisfaction in B2B Is Diffused across the Buying Company and for Different Elements
Satisfaction in B2B situations isn't limited to the product or the brand. Depending on their role in the process, some are also interested in how well the salesperson performs his or her job, while others are more interested in whether they felt represented in the decision process. All of these satisfaction levels then influence how the next decision is made.
Further, I found that how important these were to overall satisfaction varied depending on what role the person played in the decision. The decision maker was almost always very happy with the buying process; users not so much. Users felt left out of the process, unrepresented, and disenfranchised. Certain users, in fact, were so disgusted with the process that they were more likely to volunteer to participate in the next decision, and their satisfaction with the process influenced how frequently they placed service calls and whether they willingly offered positive or negative word of mouth about the product. Yet process was rarely managed or influenced by the salesperson.
Moreover, anybody involved who was satisfied with the process was more likely to blame the vendor if the product failed to meet expectations. Why? Because clearly the process was not to blame. On the other hand, if process satisfaction (including satisfaction with the salesperson) was poor, the vendor got a pass on subsequent failure to meet expectations.
So satisfaction is clearly more complicated than the typical single question asked of a single person, “How satisfied were you?” Yet all too often, B2B marketers only ask the decision maker, unaware of the behind-the-scenes manipulations of all of those users, influencers, gatekeepers, and others who are more or less satisfied and willing to take out their frustration on the next hapless salesperson.
Fred Reichheld's Net Promoter Score,4 though, would have us believe that a single question—“Would you recommend us to your friends?”—is all we need to operationalize satisfaction. That model of satisfaction, of course, is based on the difference between those who would recommend you (promote) and those who would not.
Some other well-known variables that are really operational definitions of concepts include:
- Loyalty program level (e.g., Silver, Gold, Platinum) as a way to operationalize customer value
- Gartner's Magic Quadrant score of technology providers as a way to operationalize quality along performance dimensions
- US News & World Report's rankings of universities as ways to operationalize overall quality, at least as they define quality.
Note that I'm not criticizing these well-known methods of operationalizing challenging and sometimes complex concepts. These are just offered as examples of operational definitions, some of which we may know fairly well, and some of which are like black boxes and all we are aware of is the final score.
What, then, is a good operational definition? To start with, it is a good measure that reflects the concept. If we are going to operationally define satisfaction as behavioral (that is, whether someone will give us positive word of mouth or say bad things about us), then Net Promoter Score (NPS) is a good measure—that definition is measurable. Other characteristics include:
- Reflects the Conceptual Definition accurately.
- Can be measured.
- Measure works as intended—it relates to other variables.
- Measure has face validity—it looks like it measures the concept.
- Measure is complete—it represents the full range of the concept.
- Measure has confirmatory validity—it can be confirmed by other measures of the same concept.
Having enough data to support its effectiveness is also needed, because the measure should relate to those things we expect it to: The measure works as intended. The problem with NPS is that when we plug it into the model, the measure doesn't always operate as intended. In some instances, NPS does predict intentions to repurchase; in others, it does not. In those instances, either the model is wrong or the variable isn't a good measure of satisfaction. I am, for example, more likely to warn you off Infiniti and Mercedes-Benz given my experience with both; I'm not going to tell you about my negative experience with Irish Spring soap. Soap simply isn't something that people generally talk about, so NPS is likely to be indistinguishable—most people would put middle scores simply because, who cares? Recommending may not be the way to behaviorally describe satisfaction in that instance.
I don't have a problem with the NPS per se; as measures go, it has enough data to support its effectiveness in some, but not all, instances.5 My point is that satisfaction as a concept is bigger than one question of one person and that to fully define and measure satisfaction operationally, NPS should be asked about the salesperson, the product, and the process and asked of as many people in the buying organization as possible.
Another point where NPS fails, in my opinion, is that a good operational definition reflects the concept. We call this characteristic face validity; that is, just by looking at the measure, we can see the relationship to the concept—it looks like it should measure the concept well. Since we expect satisfied people to act on their satisfaction (tell their friends), NPS looks like it should measure satisfaction; as a very broad indicator, and I do mean broad in that it is simple, it has high face validity. But if we consider that satisfaction is multidimensional and varies across people, NPS is not a valid measure of satisfaction in situations involving multiple buyers.
One complaint about NPS is that it is not helpful. Some critics have suggested adding “Why?” to “How likely are you to recommend us?” in order to identify areas of good or poor performance that are driving the score. One could argue, then, that NPS is incomplete. A good operational definition measures all (or as much as possible) of the concept.
Another characteristic is that the variable can be confirmed with other measures. There are other ways to observe whether someone actually recommends us or flames us. You could follow them around and see. You could ask their friends. You could ask them, say via text, every day whether they recommended or torched us. All of these are possible, yet very difficult. A good measure, especially one you are going to depend heavily on, should have some confirmatory validity; that is, it accurately measures the concept as confirmed by other measures.
Why not use the other measures? Typically, we settle on one that has been confirmed as valid but is the least expensive and/or easiest to collect. The others, however, enable us to ensure that all measures are measuring the same thing. Once that's done, we discard them in favor of the less expensive or easier-to-collect measure.
One way to tame Big Data, then, is through good operational definitions. I've developed a relatively simple example using a common metric, the NPS. But when we have Web browsing data that we need to use to determine whether advertising is working or to forecast sales of specific products, operational definitions serve the purpose of reducing Big Data down to manageable but important judgments. You may have all types of data to measure how well you are delivering on your promises to customers, but once you create the definition that NPS is equal to satisfaction, all of those observations and variables become one variable with only two values: satisfied or not, things are working or not. And that's far more manageable.
From Strategy to Action
Strategy is about making choices, selecting from alternatives the route you'll take. Strategy is also about implementing those choices, altering directions in the field based on what happens. The challenge is deciding on which alternatives—what actions? If you want to create loyalty, what actions should you take? What should you do to influence the customer experience, for example, so that a satisfied customer becomes more loyal?
If you have one criticism of the loyalty model illustrated in Figure 3.2, it should be that you don't know what to do, what action to take, as a result of the model. One step is to conceptually define what performance means in your business. What are the key dimensions customers use to define their experience? If you are a soap maker, perhaps it is lather, smell, cleaning power, and maybe a few other things, such as bacteria-fighting power. Put those together in a way that won't make me break out and I'll buy it. Once you've defined what the model means in your world, then you can operationalize it, or take it to the actionable level.
This all seems so obvious, so let's take a deeper look at what Microsoft, probably one of the best users of conceptual maps, has done in a specific situation.
Microsoft's DCS and Fail-Fast Mentality
Microsoft gives us an interesting case study into the importance of a data strategy and the role it plays in accelerating learning. They launched a free security training program after experimenting and learning that this program would yield a tremendous loyalty advantage that could be leveraged across a number of purchases. The goal was to have 50,000 IT professionals sign up for this free training. If successful, the program would have included professionals from the vast majority of midsize and large companies and yielded the kind of loyalty improvement that could be tied to significant near-term purchases (again, they knew that because of the earlier experiment).6
Using an Internet campaign, the word “free” coupled with Microsoft generated quite a bit of attention! So much so that the campaign generated 34 million impressions and a respectable click-through rate of 1 percent. Unfortunately, only 439 people signed up for the free program at the end of the first week. From 34 million to 439 is not very good.
If click-through is good but conversion is poor, the problem can be isolated to the landing page. The campaign is taking them to the last three feet (in retail terms, the distance from the shelf to the shopping cart), but the website isn't closing the sale. All of this was learned at the end of two weeks (a dismal second week following a poor first week)—plenty of time to make the needed corrections.
The important factor is not that Microsoft failed fast or that they failed at all. Rather, it is that they built a campaign that included a data plan. Without that data plan, how would they know where they were failing?
Further, this campaign was designed to run for 12 months—not 12 weeks but 12 months. To learn in two weeks and fix the problem (which they did) shows that they truly accelerated learning and responded.
Note that they also had a conceptual map. Click-through signals interest—click-through was their operational definition of interest—and “free” generated interest; interest leads to conversion if the website worked. The catalyst for interest was “free,” and because the landing page was created around various concepts, tracking Web browsing behavior helped identify where the disconnect occurred.
Since strategy is about making choices, let's take a look at decision making in organizations. In particular, we'll start with some of the barriers that can make effective decision making less likely.
Experiments and Decisions
Drawing a pretty picture of the market isn't the purpose—our purpose is to make better decisions. Without the map, we'll make decisions, just not always the best ones. At this point, you should have something like Figure 3.4.
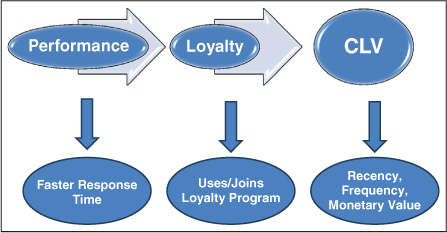
Figure 3.4 Operationalizing the Performance Concept Map
Several aspects of the model above should come to mind. First, under “performance,” you should list all of the key dimensions from the customer's perspective. I listed faster response time as one example, but you should have as many as it takes. Stack these in priority order. If faster response time is the most important characteristic to the segment you are thinking about, it goes on top.
In this instance, I put “uses/joins loyalty program” as the operational definition of loyalty. You may select something different, such as “increased frequency of purchase.”
But if you put “increased frequency,” you create a problem. Frequency would then be listed twice—under both loyalty and CLV. That's a no-no, because frequency can't lead to frequency, right?
If this model was intended for scientific use, we couldn't repeat a variable, but it's not for science, the model is for business use. Further, CLV is forward-thinking; it's frequency in the future whereas loyalty is frequency in the past. The challenge is that if you observe increased frequency, did you get loyalty or CLV? In a scientific setting, that type of question is not acceptable, but in business we don't need the same level of precision. Still, if you can find a way to measure both without repeating the variable, that's better because you'll have a more precise model and you'll see new opportunities.
Okay, so it's decision time. You decide, based on the above, to invest in a better order entry system because it improves response time, but you also decide to create an offer for joining the loyalty program. I raise these two decisions simply to illustrate that decisions are not just what you do with the first bubble in the model.
Recalling our discussion of Microsoft earlier, you also have to have measures for response time, for how often the loyalty offer is made and taken up, and for RFM. Without the data, you can't track your performance.
How do we know we're successful?
Our hypothesis is that faster response time plus loyalty program use yields greater RFM. If it costs us $5 per user to get faster response time and $3 per successful loyalty program sign-up, is it worth it? The simple decision rule would be that if CLV went up $8.01, then yes. However, just any profit is not sufficient. Before you start, you should set an amount that makes the program worthwhile, typically based on average results for other campaigns or efforts (and probably reflecting requirements for internal rates of return).
The hypothesis then becomes the decision rule and vice versa: If RFM increases 10 percent, for example, then invest; otherwise, do not. Our hypothesis is that faster response and greater loyalty take-up yields at least a 10 percent increase. Your statistician now knows what test to run and what the experiment should look like.
The experiment is now a fairly simple series of A/B tests. You are testing two treatments, A and B—faster response and current response, assuming that your resources for improving response time are variable—that is, you can assign some customers the necessary resources to improve response time, but not others. Response time is your treatment variable, or the variable that you are manipulating to see how it affects your dependent variable, which in this case is loyalty program take-up or usage.
In reality, though, we're testing a set of hypotheses. We've got the following:
- Faster response time increases loyalty program take-up (people signing up for the loyalty program).
- Faster response time increases loyalty program usage.
- Loyalty program take-up increases CLV.
- Loyalty program usage increases CLV.
We would need four samples: two each of current loyalty program members and nonmembers. Then, within each loyalty group, or those who start as members and those who start as nonmembers, we would run the experiment. Still fairly simple.
But we've not said anything about the loyalty offer design. What if we want to test two versions of the loyalty program offer? Or four versions? Or when it is offered and how it is presented?
With simple A/B tests, you have to cycle through entire sets of tests one at a time. But this book is all about accelerated learning, so skip that. Instead, get your statistician involved and use an advanced form of experimental design that allows for simultaneous testing of dozens of variables (we'll talk more about these designs in Chapter 7 when we talk about marketing campaign design).
Managing Decision Risk
All decisions involve risk. Risk has two dimensions: importance of the outcome and uncertainty of the outcome. When I go to the horse track and bet $2, my risk is low because $2 is unimportant. When you go to the track and bet $200, your risk may be greater than when I bet $200 because I have years of experience and my experience should increase certainty (experience should help me win more often—note, I said should; it is gambling, after all).
I know you know that about risk already, but I include it to frame our discussion around how decision rules and hypotheses are influenced by risk. First, the bigger the investment (the size of your bet), the more important it is to get the decision right. Further, the greater the investment, the greater the return has to be; the risk/reward ratio has to be right or we would turn to smaller investments. The thing is that you can control your statistics to reduce the probability of getting the decision wrong and losing your investment, called investment risk.
However, getting it wrong is not just about whether you get the expected return or not. There's also the possibility that there is another investment out there that is better. The risk associated with making an investment when another out there is better is opportunity risk.
If you've taken a statistics class, you may recall the terms Type I and Type II error. Type I is the error made when you decide that there's a difference but there really isn't, and Type II is when you fail to recognize a difference when one exists. What's cool is that these aren't just nerdy statistical terms—they actually represent investment and opportunity risk. If you choose to invest when there really isn't a difference, you've made a Type I error. If you choose not to invest when there is a difference but you failed to observe it, you've committed a Type II error and lost an opportunity that was a good one.
The statistical problem is that these decision risks are not opposite ends of the same continuum. Think about it this way: If I invest in Yum Brands and the stock yields a 15 percent return while the entire stock market yields 12 percent, then I did well. That means I didn't lose my investment and the opportunity was good. But had I invested in Coca-Cola, I might have gotten a 20 percent yield for the same time period. There are so many opportunities and only one investment in the experiment. Fortunately, your statistician can help balance that, but let's talk through this so you know how to approach your data scientist.
Usually, the decision rule to determine if there is a difference (for example, faster time yields greater loyalty take-up) is to use a p-value of .05, meaning that the probability of running the same test and getting different results is 5 percent or less. That decision rule assumes that investment risk is more important because the emphasis is placed on coming up with the same result—that the investment really is (or isn't) worthwhile.
Further, you can reduce that p-value if your investment risk is big, but when you do that, you aren't reducing opportunity risk, or Type II error. Just because we're certain that the return is greater than zero doesn't mean that there isn't a better return out there. You can reduce opportunity risk by limiting a different statistic, beta, but the important thing to know is that your statistician can actually alter decision rules to control the amount of statistical risk you are taking for both investment and opportunity risk. When either investment or opportunity risk is out of the ordinary, make sure your data scientist understands the risk associated with the decisions you're trying to make. You don't have to remember which form of risk is Type I and which is Type II; honestly, I have to look it up to know which is which. What's important is that your statistician understands the risk in the decision and controls for it.
Experiments Reduce Risk
What we've talked about here is using statistics to reduce risk. Remember, too, that experiments also reduce risk. An experiment gives you the ability to reduce risk by failing fast and cheap. Mess up on a small sample and no one notices.
But how small? Or how large? A question I'm often asked is, how big a sample do we need? Samples cost money, so the question is often a budgetary one. Bigger samples also take more time and effort. The statistical answer is 30 for a simple A/B test, but really, would you invest a million dollars on a decision informed by a study of 30 customers? Maybe you would if your entire customer base was 31 customers, but most people wouldn't. So the real answer to the question of how big should the sample be is, how big does it have to be for you and your boss to believe in the results?
This issue of sample size raises another factor to consider: statistical power. Statistical power is the ability of an experiment to detect a difference and is a function of two things: sample size and effect size. The effect size is the difference in your outcome created by the treatment, so the size of the increase in loyalty program take-up is your effect size. The bigger the real difference, the easier it is to spot. A bigger sample makes it easier to spot, too. The more observations I have, the more likely they center around the real average, which makes it easier to figure out which one is higher. So as the sample size increases, so does statistical power or the ease of finding a difference.
So what does using experiments to make better decisions have to do with Big Data? Briefly, and I say briefly because we'll get into more details later, Big Data affects experiments in three ways. First, we have greater data variety, giving us a more precise test of our model. Second, we have increased velocity, making our experiments run faster and accelerating learning. Third, we have increased volume, increasing our statistical power and our confidence in our conclusions.
In spite of these benefits of Big Data, some executives are reluctant to put their faith in the numbers. Let's examine some of those factors that work against effective use of Big Data and experimentation.
Using Big Data Effectively
This chapter is about making better decisions because you have a model of how you think things work and you can test that model with data because you have good operational definitions of your concepts. Many current management practices, and in some instances the ethos of today's management culture, actually make effective decision making with Big Data more difficult. Our research shows that less effective decisions are implemented because data isn't used effectively.
A Bias for Action
Virgil, the Roman poet, once asked, “Who asks whether the enemy was defeated by strategy or valor?” His question reflects the human bias for action over thought. Strategy is not as valued as valor—action is always favored over careful thought and planning. The human bias for action can stymie real progress, yet people want decisive, action-oriented leaders.
Velocity, though, is one of the characteristics of Big Data. This increased velocity gives us the ability to make informed decisions at a greater rate, if the data gets used correctly. What happens all too often is that the decision maker is faced with a problem or opportunity and makes a decision to act, then looks for data to support the decision. Action is needed, no time to waste—dollars, yes, we can waste those. The time of subordinates following a less optimal path, yes, we can waste that. But we must act, and we must act now!
In decision-making research, they call this commitment—the tendency to commit to a course of action too early. I try to break my students of this habit by asking them to list all alternatives to a problem they are trying to solve. All too often, they stop at two. Why? They already know the answer (they think), so what's the point of discussing more than that? Because of their commitment to a course of action, they fail to identify, much less consider, alternatives.
Commitment is similar to the availability bias, which is to use information that comes readily to mind to make a decision, rather than seeking out and using a more comprehensive set of facts.7 Big Data can make us feel as though we have sufficient data, and then we fall prey to the availability bias. Carefully consider the decision to be made and think about the data needed to make it.
The point is that commitment and availability bias lead to greater opportunity risk—that is, the real possibility that you are passing up a better course of action or opportunity.
One answer is to leverage the velocity of Big Data. Set up your data capture and analysis systems so that data presents alternatives, identifies opportunities, and can add richness of dimensions to your decisions. These systems are the subjects of Chapters 5 and 6.
A second answer is to brainstorm alternatives first individually before meeting with other people. Both the quantity and quality of alternatives will increase if everyone anonymously submits alternatives to you before the meeting in which you are to decide. Anonymity removes any power barriers and other groupthink biases. Eliminating those biases increases both the quality and quantity of alternatives to consider. Yes, some will be ludicrous, but that's part of the process.
Further, research shows that if you can sleep on a decision just one night, the chances are much higher that you'll make a better decision.8 Just one night! So if you have a big decision to make, sleep on it.
Numbers Myopia
One case I use to teach execs and undergrads alike involves a horse racing track, Lone Star Park. The data indicates that 30 percent of first-time attendees don't ever return. Many read the case and think, “Oh that's terrible! We lose 30 percent of our first-time attendees!” But is that bad? Or is keeping 70 percent good?
As human beings we are primed to avoid loss.9 Study after study shows how we try to avoid loss, pain, or suffering, and that we prefer avoiding pain to realizing gain. Your salespeople know this, which is why they talk about finding customer pain points; chances are your marketing people do not. Think for a moment of how we market—we only tell about the positives—but what keeps our buyers up at night are the myriad problems that cause things to fail.
Yet look back at that example from the Lone Star Park case. Same numbers, different interpretation. I call that numbers myopia—we see the numbers based on how they are presented, not what they mean.
Given the complexity of Big Data and the need to reduce it to a simple measure or two, particularly using a bar or pie chart, you can see how numbers myopia can be a problem. Throw in the bias for action and you have a recipe for disaster. To avoid the negative consequences, flip the numbers. If we lose 30 percent, we gain 70 percent. Flip the numbers and see both sides.
In addition to flipping the numbers, dig deep into the process. What's the operational definition? What's the concept it's supposed to measure? Does the measure really reflect the concept?
Trusting the Data
A similar bias, one for control, also creeps in. A true though relatively unknown story illustrating this point involves the Apollo moon mission astronauts. While computers and avionic technology were fairly simple compared to today, they were still capable of controlling the Apollo capsules. These capsules could have been, even with the technology available at the time, fully controlled by engineers on the ground. Yet the highly skilled and experienced fighter pilots who became our first country's first astronauts wanted to fly spacecraft, not ride in spacecraft. As a result, a number of additions were made to the capsules' design in order to satisfy their need for control.10
Now think about an executive who has a lifetime of making decisions—of flying the fighter jet—and you're asking that person to possibly give up some control to a machine? To numbers? This lack of trust is a function of what I call the hero ethos.
The hero ethos is a trap leaders can fall into when they take themselves a bit too seriously and believe they can, or need to, do it all—data be damned. They trust their gut because their gut hasn't let them down, and even if it has, they blame that failure on some other factor. After all, they are the CEO, or the CMO! Actual CEOs and CMOs may be less likely to fall into this trap than are CEO-wannabes, but even so, their bias for action coupled with their ego makes it difficult for someone with numbers to rely on the numbers to sell an idea.
More than a few people in upper management simply don't see the value in Big Data—one study put the number at 9 percent.11 Some of the skeptics are CEOs themselves, such as Howard Schultz of Starbucks. Said Joe LaCugna, director of analytics and business intelligence at Starbucks during a session at the Big Data Retail Forum in Chicago, “Howard doesn't care about data. He has absolutely no head for data.”12 Probably not the wisest remark to make in public (Kate Kaye, the journalist covering the story, got a few phone calls from Starbucks over the story, but truth is truth.) Add to the 9 percent of upper management who fail to trust data another 11 percent with a culture of not trusting data, and you can see that the opportunity is there to beat out at least one-fifth of your competitors simply by using data effectively.
Another limiting factor is a lack of trust in data, and I'm not talking about when you have legitimate reason to question how the data was collected. I'm talking about when you are confronted with new information that challenges preconceptions or previous experience or even conventional wisdom. In a Big Data version of the not-invented-here (NIH) syndrome, I also see decision makers rationalize away findings that don't match their notion of how things should work.
Data scientists have a different trust issue. Because they are trained as skeptics, they fall prey to the diva syndrome. Data divas disdain data they did not create.
The data diva syndrome is similar to a challenge identified by Deloitte's Michael Raynor. He points out that the “unfortunate irony is that learning something that is both new and true seems to be extraordinarily difficult only when it is extraordinarily important.”13 These syndromes (hero ethos, NIH, and data diva) are most likely to be displayed when the new information is both radically different and important. Perhaps that explains why Circuit City was unable to recognize Best Buy's threat, why Best Buy was unable to react to showrooming and online sales, and why Microsoft was unable to be an early SaaS or cloud player. But the bias created by radically different and extraordinarily important conditions is just as critical to the individual making midlevel decisions or personal decisions as it is to the CEO making strategic decisions that sink the company. Mapping out one's theory of how things work and regularly challenging it, with data and especially with new information, can help one to avoid making those mistakes, but only if one has the discipline to engage in DCS as an ongoing practice.
Summary
Conceptual maps help us identify opportunities in the market, but to take these strategies and turn them into action requires that we operationalize the concepts. An important aspect of operationalization is measurement; we should be able to measure our operational definitions. These measures should meet a set of criteria, including that they reflect the concept accurately, act as intended, and are complete.
Strategy and action then becomes a series of experiments that test the conceptual model. We manage risk in the process, typically controlling both investment and opportunity risk in how we design the experiments and set up decision rules.
To use Big Data effectively, we have to overcome some of the natural human responses to data. A bias for action, for example, can cause us to act before gathering sufficient data, while an availability bias leads us to make decisions on data that is easily gathered. These and other potential biases can limit our ability to effectively consume data as part of our decision processes.