How we present our survey results is one of the most important aspects of the entire survey effort. It doesn’t matter how well the survey was conceived, designed, or executed, if it’s poorly or inaccurately presented, none of the effort that went into the survey will be recognized. Moreover, important findings may never get the visibility or attention they should.
Paul Hague and his colleagues echo this notion in their book Marketing Research: “These reports should be the crowning glory of the huge amount of time and money that has been invested in the research and yet so often the results are disastrous.”1
In this chapter, we try to provide you with some guidelines based on our own experience and the expertise of others on how to ensure that survey results are presented well.
In this discussion, we use the term survey presentations generically to refer to all forms of reporting, including written materials; verbal presentations; and visual materials such as PowerPoint, web graphics, and so forth. As a memory tool and means of providing organization to survey presentations, we present the discussion of survey presentations following a simple three-part acronym, ACE, to help focus on the three major considerations in developing a survey presentation.
A—Audience: Who is the audience of the presentation?
C—Content: What are the key points that we need to convey?
E—Expression: How do we present the survey in a way that is clear, understandable, and complete?
Too often, the expression or appearance of the presentations becomes the main focus in their development. And too often the dominant themes in constructing presentations become centered on things such as formatting questions: Is the blue background in the PowerPoint too dark? or Do you think that the color graph will copy well in black and white? Because these concerns should not be the drivers in the development of presentations and because your material may be presented in several different formats and media types, we recommend that the first two key components—the audience and the content—become the first areas to get your attention. Once these areas are addressed, the expression of the information will be a much easier task.
The Audience
You may recall that in Chapter 4 (Volume I) we discussed the three primary stakeholder groups in the survey process: the sponsors, the researchers, and the participants. The sponsor, in addition to identifying the purpose of the survey, the population of interest, the timeline, and the approximate resources available, should specifically indicate what project deliverables are expected, such as a report, a presentation to a specific audience, or the submission of data files. There should be agreement on these deliverables with regard to the presentation. Should there be a written report? If so, is there a specification of the topics that are to be covered in the report? Is there a requirement to make a live presentation to an executive or administrative group, or perhaps in a more public forum, such as a public hearing or a shareholders’ meeting? Is there to be an online presentation, possibly being posted to the organization’s website, or a Twitter or Facebook posting? Thus, how the sponsor wants those findings presented should be explicitly stated in the deliverables the sponsor provides in the initial stages of the project. Sponsors sometimes don’t realize that suddenly requesting a different type of presentation or multiple format presentations at the conclusion of the project will take additional time and resources that may not fit within the original timelines or budget. It is important to remember that each different type of presentation not only requires a different presentation format but also brings different audience considerations into play.
Beyond the explicit conditions for the presentation detailed in the deliverables, there are also implicit specifications for the presentation centered on the sponsor’s stated or unstated expectations of what is the most important information and how that information should be presented. Sometimes these implicit expectations closely match the formal specification of deliverables, but in other situations, the sponsor’s real expectations may be very different. For example, the deliverables may call for a detailed report covering all aspects of the survey project, but in conversations with the individuals in the sponsoring organization, they may indicate they’re most interested in an executive summary and a 30-minute presentation, with an opportunity to ask questions. In this case, if the researchers put in a great deal of effort producing a massive tome on the survey but fail to deliver a concise, understandable executive summary, or if they created a presentation that was essentially just images grabbed from the report and pasted into a PowerPoint, the sponsors would be very dissatisfied with the presentation and see little value in the survey or its findings. Therefore, in addition to being very familiar with the project’s stated deliverables, it is critical for researchers to get to know their audience and what that audience expects regarding the presentation of the survey and its findings.
Knowing Your Audience
Too often research presentations, especially reports and PowerPoint-type presentations, are created with little thought about who will be reading or viewing their content. Like possible compromising photos that ultimately end up posted on the Internet, what they reveal may be expected by one audience, misinterpreted by another, and totally misunderstood by a third. Therefore, it is very important to know and understand your audience. Conversations with sponsors are an essential part of the development process not to just understand their expectations but to gauge how best to present material to them.
The Hidden Lack of Understanding by the Audience
The increasing use of surveys to gather information on different populations in the academic, political, and business realms has created a constant stream of survey results. The fact that surveys have become such a common part of the landscape in information gathering has created a familiarity with surveys to the point of sometimes promoting a false sense of understanding them. As Lynn McAlevey and Charles Sullivan aptly note, “The news media almost daily quote from them, yet they are widely misused.”2
In a study focusing on the understanding of surveys, McAlevey and Sullivan looked at students with prior managerial experience embarking on an MBA program. What they found was that common sample survey results are misunderstood even by those managers who have previous coursework in statistics. In general, those managers with some statistics background fared no better than managers who had never studied statistics. McAlevey and Sullivan’s succinct conclusion was “In general, we find no difference. Both groups misuse the information substantially.”3 McAlevey and Sullivan put the implications of this hidden lack of understanding about survey methodology into perspective thusly:
For example, great statistical care may be used to take account of the effects of complex survey design (e.g., stratification and clustering)i on estimates of sampling error. But what is the practical value of this if the primary users have gross misconceptions and misunderstandings about sampling error?4
If a lack of understanding prevails in the audience, then presentation emphasis on methodological and design features important to the researchers may be lost on the audience. Perhaps even more importantly, such a disconnect could have a negative impact. Brunt,5 for example, notes that sample surveys have counterintuitive properties for nonspecialists. Thus, a lack of understanding by the audience creates mistrust of the survey process and in the end a rejection of the findings, basically resulting in the proverbial “throwing the baby out with the bathwater.”
For these reasons, the conversations with the individuals to whom the presentation is directed should not only focus on their expectations but also assess their understanding of the survey process. This latter area can be somewhat sensitive, particularly for individuals in upper-level management who may not want to appear unknowledgeable, especially if the presentation will include subordinates. One way of approaching this is to point out that every specialty has its own set of technical concepts and jargon, and ask them which of these they think would be helpful to review in the survey presentation. Another way is to split the audience into homogenous groups, as we discuss in the following section.
Types of Audiences
In her discussion of survey presentations, Arlene Fink classifies audiences into three categories: nontechnical, technical, and mixed (both nontechnical and technical).6 The nontechnical audience could best be characterized as:
- Primarily interested in the survey findings;
- Wanting to know if the findings are important, and if so, what makes them important;
- Wanting to know how to use the results;
- Not interested in the methodological details, including the data collection processes; and
- Not understanding the details of the analysis, and not wanting to see a lot of statistics or an emphasis on data presentation.
By contrast, the technical audience is interested in the details of the study’s design and methodology. This audience is characterized as being interested in:
- Why a particular design was used;
- The way the sample was selected;
- How the data collection was carried out;
- Characteristics of the respondents, information about response rates, and details about nonresponse; and
- Details of the analysis, including a detailed data review, and even a discussion of survey error.
The third audience is the one comprised of both nontechnical and technical audiences. From the perspective of preparing or presenting information on a survey project, the mixed audience can be a major problem, but it can also be an asset. The problem is that nontechnical and technical members of a mixed audience will come in with contrasting and sometimes conflicting expectations. One option to deal with the conflicts between the technical and nontechnical is to prepare separate presentations for each. For example, reports can be separated into components (an idea we’ll explore later in the chapter) or two separate meetings can be held, one for the technical audience and another for the nontechnical audience. This notion can also be extended to other logical groupings. For example, separate presentations might be made to different groups based on positions, such as departments or divisions within the sponsor’s organization. As Paul Hague et al. point out, the different members of an audience can also vary by their positions, which create different needs and expectations.
Typical audiences for [marketing] research reports consist of product managers, marketing managers, sales managers, market research managers, business development people, technical development managers and of course the “C-suite” of top executives. A researcher needs to balance the needs of these groups within the report.
The job responsibilities of the audience will strongly influence the specific intelligence they look for from the report. Sales people want to know specifics such as what each of their customers, and especially potential customers, is thinking and doing. Communications managers are interested in different things, such as which journals people read, which websites they visit and what messages are effective. Technical staff is likely to be interested in which product features are valued.7
The value of being confronted by a mixed audience is that it forces those presenting the results to consider topic areas that would otherwise be missed if only a single audience type was involved. For example, let’s say that an online health care survey sent to a health care organization’s members had a very low response rate for individuals in the 65- to 75-year-old age range; yet the overall survey results found that members indicated they would benefit from online health care information. If a presentation only included a broad overview of the results without a more detailed view of the methodology and response rates, the decision makers might erroneously decide that going forward with an online health awareness campaign would be a great idea, when in reality, such a program would be of little value to this very important demographic in the health organization’s membership.
The Content
The principal focus of the presentation will be to answer the research questions and address the study’s objectives, which were first identified at the beginning of the study. The content should lead the audience to those results by addressing (1) why the study was undertaken (introduction and background), (2) how it was designed and structured (methodology), (3) how the information was gathered (data collection), (4) how the data were examined (the analysis), (5) what the findings (results) were, and (6) what the findings mean (summary and recommendations). If this sounds familiar, it’s because it follows the traditional structure for structuring and reporting out research—a standard format in academic research. It is commonly presented as:
- Statement of the problem
- Review of the relevant literature
- Methodology
- Data collection
- Data analysis and findings
- Conclusions
- Summary and recommendations
To illustrate, the APA report style,8 developed by the American Psychological Association and widely used throughout the social sciences, typically divides research publications into seven major sections:
- Title page—The title of the paper, the names of authors, and the affiliations of the authors.
- Abstract—A brief overview of the entire project of about 150 to 250 words.
- Introduction—The background and logic of the study, including previous research that led to this project.
- Method—Minute details of how the study proceeded, including descriptions of participants, apparatus, and materials, and what researchers and participants actually did during the study.
- Results—A detailed statement of the statistics and other results of the study.
- Discussion—What the results tell us about thought and behavior.
- Multiple experiments (if appropriate)
- Meta-analysis (if appropriate)
- References—Where to find the work cited in the paper that relates to the presentation.9
- Footnotes—Explanatory reference notes to items discussed in the text
- Appendixes and Supplemental Materials.ii
Of course, not every research report follows this formal format. Some commonly found components may be combined or embedded within another section; for example, a statement of the hypothesis may be included as part of a statement of the problem section. Further, while some survey research reports are structured in a very formal style, particularly when they are presented in academic journals or in formal conference settings, survey reports using a more informal structure are more common, especially when the reports are primarily intended for the sponsor’s use. Some of the differences include the fact that in the more informal presentations, a literature review will likely be omitted (unless specifically requested), or if presented, it will be in an abbreviated format, such as quickly reviewing recent surveys similar to the current effort. More informal survey reports and PowerPoint-type presentations also tend to have a lower level of granularity in the information in the methodology and results sections. By a lower level of granularity, we mean the level of detail is less. For example, in more informal presentations, the methodology section may contain only the key points of the design, sampling approach, and data collection. It is also common, particularly with surveys that employ sophisticated methodologies or use consistent methodological approaches across similar surveys, to break the methodology section out into an entirely separate document or to place it in a report appendix.10 Similarly, the results section will contain less detail in the body of the report, again placing detailed information, such as a comprehensive breakdown of the survey population in an appendix at the end of the report. Finally, in the more informal survey format, an abstract is often not included. However, one component not typically included in more formal presentation formats, but commonplace in today’s organizationally sponsored survey presentations, is an executive summary.
Executive Summaries
As the title might suggest, executive summaries are usually directed at executives or decision makers primarily because they might not have time to attend a full presentation or read an entire survey report. Because the executive summary may be the only exposure that some people may get to the survey content and findings, it is important that it presents the survey approach and results information as accurately as possible and that it captures all the important content of a larger report or presentation. Like the report or live audience presentation, an executive summary should be targeted to the audience. Executive summaries are typically one to three pages long and frequently use a bulleted-type format rather than lengthy narrative discussions. The executive summary usually contains the following elements:
- Brief overview of the survey: Why the survey was conducted, who or what organization (or department within a large organization) initiated the survey, when and where it was conducted, and any other key background points.
- Goals and objectives of the survey: These are lifted from the goals and objectives that were stated at the beginning of the survey. The discussion should include which goals were met (e.g., which research questions were answered and which were not). For those goals and objectives that were not met, a brief explanation should be provided as to why not.
- Survey methodology: Again, this section of the executive report will be a much-truncated version of the material presented in a full report or presentation to an audience. It should, however, contain all the essential elements of the methodology, including who the participants of the survey were, how they were selected (what type of sampling was used), what the sample size and response rate were, what survey mode (e.g., interviewing, online, mail-out questionnaire, mixed) and data collection procedure were used, and what type of survey instrument was used, including a brief description of the kinds of questions used. Any specific difficulties or unusual circumstances that might affect the results should also be mentioned here, for example, if a major blizzard occurred that affected the survey administration.
- Survey results: This section will briefly explain the major findings of the survey. The research questions should specifically be addressed here. Any significant unusual or unexpected findings should be highlighted.
- Recommendations: This is an optional section. Some sponsors want recommendations stemming from the survey to be included. Others may prefer that recommendations be omitted.
Executive summaries are typically attached to the full report or are disseminated in conjunction with the presentation or meeting with a live audience. However, this isn’t always the case. In preparing an executive summary, it is wise to consider the possibility that this may serve as a standalone summary and may be the only document about the survey that some may see. For this reason, it is good to have someone not familiar with the survey read it to make sure it covers the important points. In this regard, we have sometimes found it very useful to reference more detailed materials in the executive summary that are available outside the document, such as sections in a full report, including page numbers, so those reading the executive summary will have access to more detailed backup material, if it is desired.
Privacy, Confidentiality, and Proprietary Information
As we are constantly reminded by the news media, there is no such thing as privacy. When conducting a survey, it is important to keep in mind that the materials produced may have a much longer shelf-life than was originally intended. Results of a consumer satisfaction survey conducted years before may end up in a later product liability court case. Similarly, the release of personal data about survey respondents may violate not only ethical (and sometimes legal) standards but could ultimately cause harm to the individuals who were willing to take part in the survey. Thus, it is crucial to keep in mind that certain types of information collected during a survey may be confidential, anonymous, or proprietary.
There are federal regulations that protect individuals from harm during the course of research. These regulations are referred to as human subject protections. These protection regulations were developed, in part, due to past abuses of individuals during research, such as the now infamous Tuskegee syphilis clinical research.11 Federal regulations pertaining to the protection of human subjects can be found online,12 and a review of these regulations related to survey research can be found on the American Association for Public Opinion Researchers (AAPOR) website.13
There are three points in the survey process and its presentation where the privacy, confidentiality, and data proprietary issues become particularly relevant. The first occurs in terms of who has access to the data collected. If personal data, such as a respondent’s name, birth date, contact information (address and phone number), social security number, and so forth, are obtained, then there is a duty by the researchers to notify the respondents that the data are being collected and how the data will be used, and to make a diligent effort to keep that information from becoming public. If the survey participants are told their information will be kept in strictest confidence, then both the researchers and the sponsor have an obligation to uphold this promise. In this regard, it is also important to make sure the researchers and those employed by research firms have signed data confidentiality agreements, which detail the requirements for maintaining data confidentiality and the obligations of those who have access to the data.
Second, when survey data are provided to sponsors as a deliverable, it should be de-identified, meaning that personal or confidential information should be removed. That way, if the data somehow become public at a later time, no one will be able to connect the specific respondent’s personal information with that individual’s responses on the survey. This safeguard is particularly important with surveys that focus on sensitive topics, such as employee job satisfaction. Similarly, it is common practice to aggregate individual survey responses in reporting results, so data are only reported at the group rather than individual level. For example, in reporting survey results, only the percentage of respondents who checked a particular response category on a closed-end question is reported.
Third, there is also the issue of the proprietary nature of the data collected, the techniques used for data collection, and the methods of analysis. Both the sponsor and the researchers have vested proprietary interests at stake. The sponsors may have provided the researchers with proprietary information, such as contact information, for clients taking part in a social program, a customer database, or confidential information about marketing a new product. If the researchers are in-house, this is less of a problem than when the survey is being provided through contract. In Chapter 4 (Volume I), we indicated that the sponsor owns the survey, but the extent and terms of this ownership need to be agreed upon at the beginning of the process. If not addressed beforehand, these problems can become major challenges in the presentations of the survey. For example, a sponsor may want a full disclosure of the sampling methodology, including the algorithms used to weight the survey responses in the final report. The researchers may decline to provide this because they developed it by extracting and statistically manipulating population data obtained from other sources. Similarly, if researchers were to include proprietary information about a health care provider’s intent to expand services in a particular geographic location when making a live audience survey presentation, without first obtaining the sponsor’s permission, a serious problem could emerge. Again, good communication between the researchers and sponsors about the materials to be included in written reports, executive summaries, live audience meetings, and online postings of materials is essential to ensure that there is agreement about proprietary content, timing of the presentation, and ultimate ownership of materials.
The Expression
We use the term expression to refer to the way in which the content of the survey is presented or delivered. Just as the mode of delivery is the platform for getting the survey instrument to participants (you may want to review the discussion on mode of survey delivery in Chapter 5—Volume I), the expression of the survey findings is the platform upon which the content is delivered. Before we turn to specifics of expression, there are three important reminders that should be kept in mind when preparing a survey presentation. First, the presentation should focus on substance not style. If the content is not well defined or organized, no matter how well it is presented, the audience will not get the intended information. Second, it is important to remember that the content of the survey remains the same irrespective of whether it’s presented in a formal report, an executive summary, a PowerPoint presentation, or in other venues. While each of these different types of presentations shapes how the information is formatted, the level of detail presented, and the length of the presentation, the fundamental elements to be presented are the same. In a good checks-and-balances review of a survey report, PowerPoint, and so forth, it is good to ask yourself, “What would I change if I were completing this in a different format?” A third point to keep in mind is that a survey presentation reflects the researchers and sponsors. If it is poorly constructed, has grammatical or spelling errors, has inappropriate language, or sets an improper tone, those problems will be attributed not just to the survey but also to the organizations and individuals who commissioned, created, and carried it out.
Presenting Data
Presenting survey data is one of the most difficult parts of presentation. Nothing will cause an audience’s eyes to glaze over more quickly than PowerPoint-type slides with row after row of numbers presented on large tables. Similarly, a report with page after page of tables or figures displaying survey statistics is one of the best tonics around for sleeplessness. As Hague and his colleagues note, “Data are the problem. Often there is so much information it is difficult to work out what to include and exclude, and making sense of it is not so easy.”14 Unfortunately, sometimes researchers present massive tables filled with data simply because it’s easier than spending the time and effort to distill the information down to a summary level. Summary presentation, of course, does not mean that the detailed data should not be available (with a reference in the report body or at a PowerPoint presentation to the appropriate report appendix or separate document where it can be found) for those who want to dig deeper or verify the accuracy of the summary. However, if you are confronted with statements in reports or meetings such as, “As you can see from the percentages in the third column of the second page of Table 2 . . .,” a red flag should go up in your mind. If the information was important enough to point out in raw form, then why did those presenting the material not take the time to synthesize and explain this important information?
Text, Graphs, and Tables
Synthesizing information and providing commentary on statistics brings meaning to the data collected in surveys. “Writing commentary to accompany statistics should be approached as ‘statistical story-telling’ in that the commentary needs to be engaging to the reader as it provides an overview of the key messages that the statistics show.”15 It is this synthesis and commentary that provides both context for the data presented and a connection between different pieces of the results. What, then, is the best way to present data? Basically, information can be presented in text, table, or graphic form and will “generally include all three approaches as these assist in ensuring that the wider user base is catered for.”16 Again, selecting the approach to presenting the information should be based on the needs of the audience.
Text is used for commentary around and in summary of numerical or quantitative results. It is a good way to point out particularly significant statistical findings, which might be lost in the numbers reported in a table or depicted in a graph. It might be considered the train that carries the statistical story mentioned earlier. For example, a conclusion might point out that “More than 95 percent of the respondents said they were ‘very satisfied’ with the service they received,” or “There were statistically significant differences between men and women as to how satisfied they were with the service they received.” However, using only text to express large numbers is both time consuming and requires a great deal of effort by the audience to decipher. For example, text saying, “The initial survey was mailed to six-thousand, five-hundred individuals,” is much harder to grasp than saying, “The initial survey was mailed to 6,500 individuals.” The APA style manual, mentioned earlier in this chapter, uses the convention of spelling out numbers under 10, but using Arabic numerals for values greater than nine.17 Similarly, trying to relate a lot of numeric data in a sentence will cause the point to become muddied and vague. Consider the following text description:
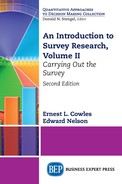
According to the survey findings, almost no respondents (.9%) were “very dissatisfied” with the service they received, but approximately 35% of the respondents were “dissatisfied,” while 32% were “satisfied,” and another 32% reported they were “very satisfied.”
It may take a couple of readings to pick up the idea that a negligible percent of respondents said they were very dissatisfied with the program and that there was little difference between the respondents on the remaining response categories. In this case, a graph might be a simpler and more straightforward way to point out the similarities between responses given in three categories, as illustrated in Figure 5.1.

Figure 5.1 Responses to survey question “Are you satisfied with the program?”
It is important here that you not get the impression that all text in survey presentations must be in the briefest form possible. Trying to be too brief in text can have an equally bad effect as trying to provide too much information. Essentially, while the old expression “Brevity is the soul of wit” may be true, we would argue that “Too much brevity is the soul of a half-wit.” The point we are trying to make with this rather bad joke is that if wording becomes too general or leaves out too much detail, it can become as meaningless and unintelligible as trying to describe a table worth of data in a sentence. Take the following sentence, which might be found in a report, as a bullet point in an executive summary or on a PowerPoint slide. “The change in customer satisfaction was tremendous!”
The sentence is meaningless because the terms used are vague and abstract. Due to a lack of detail, the audience wouldn’t know whether the change in satisfaction was up or down—a small detail that could have major consequences. Similarly, the word tremendous, while having an emotional connotation, doesn’t convey any real sense of magnitude. What do you think should be done to improve the wording?
As the example presented earlier demonstrates, graphic representations of data can be used to present or relate complex findings as an alternative to descriptions using text, or to further illustrate summary points made in the text. A simple visual chart or graph is an easy way not only to provide precise data values but also to show relationships between different pieces of data. This feature is particularly useful in PowerPoint presentations, where reading extensive material on a slide may be difficult and unproductive. While an extensive review of designing and creating is beyond the scope of our discussion here, there are a few basic ideas you should keep in mind when considering graphs and charts in your presentation. (There is a considerable amount of research available on this, and we provide a couple of good references in the Annotated Bibliography at the end of the chapter.)
One of the problems that we face in creating good graphics for presentations is that our graphic software has grown so sophisticated that it is easy to create both an attractive and a bad graphic at the same time. The first fundamental rule of creating graphs and charts is that they should be appropriate to the type of data they are displaying. For example, categorical information is best displayed in graphics that capture distinct units, such as a bar chart. (Figure 5.2 provides a simple illustration.) A common mistake is connecting categorical data in a trend graph, which is more appropriate for showing change over time (see Figure 5.3). Similarly, presenting data that represents percentages should be displayed in a format that shows portions of a total whole (usually 100 percent). Pie charts and stacked bar charts are effective graphs for this purpose (see Figures 5.4 and 5.5).

Figure 5.2 Employee satisfaction by position level (bar chart representation)

Figure 5.3 Employee satisfaction by position level (line graph representation)

Figure 5.4 Percent of college workforce

Figure 5.5 Comparison of four-year university and community colleges by position type
Graphs should be simplified as much as possible. Years ago, Edward Tufte, one of the premier researchers in the field of the visual presentation of data, coined the term “chartjunk”18 to describe elements that appear in graphs that distract the reader from understanding the content in the graph. He suggested that, if you create a figure, you should maximize the amount of relevant information and minimize anything that would distract the reader. Tufte identified a principle he referred to as maximization of the data-to-ink ratio—graphs become more useful when the amount of data grows and the amount of ink decreases.19 Tufte’s criticisms of extraneous graphic objects or tools inserted into graphs included the use of unnecessary and distracting lines and background grids. He also objected to patterns and visual features, such as three-dimensional depictions of data that was only two dimensional.20 Figure 5.6 shows a hypothetical worst-case scenario in terms of the clutter that can make a graph unreadable, while Figure 5.7 displays the same information in a much cleaner graphic.

Figure 5.6 Premier healthcare—facility ratings

Figure 5.7 Premier healthcare—facility ratings
Julian Champkin perhaps captured the essence of creating good graphics best when he said, “The mark of a good graphic is that the user reads the diagram, not the caption. Information should be in the picture, not in the words underneath.”21
Presenting tables and presenting figures share much in common. Tables are a convenient way to report lots of data in an organized and succinct manner. They are particularly helpful in presenting the details of the data. For example, numbers containing decimal points are difficult to read in text, particularly if you are presenting a series of numeric values. In Western countries, tables are commonly read top to bottom, left to right. The fact that there are columns and rows in a table makes it convenient to provide data both across and within different number sets. For example, if you want to compare survey responses across three different cities, then it is relatively easy to construct a table with three columns, one for the responses from each city. By then looking across the rows of the three columns, you could compare the responses to a particular survey question across the three cities. However, within the same table, you could also look down a particular column and see how responses to different question areas compared within a particular city. It is this matrix quality that allows easy access to specific pieces of data. In the illustration, the intersection cell of the table would contain a specific value on a certain survey item for a specific city. We typically only create tables in two dimensions for presentations, but hypothetically, if you had a good way to display a third dimension (think Rubik’s cube), you could find a particular piece of data using the intersection of three different variables, say the response (1) to a specific question, (2) by males, and (3) within a specific city. However, because we typically only present two-dimensional tables, what we usually do is create a step-down table to display this relationship. By this we mean that we would take our original table that provided the responses to a particular question by cities and then break it down into two subtables, in this case, one for males and one for females. While this works fairly well for tables containing only a small number of categories, imagine the difficulty of creating such tables if you were looking at data across some dimension such as income level or race and ethnicity. It is for this reason that we typically move the presentation of such data into a summary form using statistics. Those summary statistics can then be put into the narrative in a report, or presented with a PowerPoint, with an explanation. In our illustration, for example, our summary could then read something along the lines, “Males in Chicago had (statistically) higher satisfaction levels with regard to service than males in either Atlanta or Phoenix. However, there were no significant differences in satisfaction levels among females in the three cities.”
As it was with graphs and charts, the use of text in conjunction with tables is a very important part of the presentation of survey research. The emphasis in tables must be on clarity and simplicity. Granularity, in terms of the detail presented, is an important consideration in the inclusion of tables in presentations. Neither PowerPoint presentations nor executive summaries lend themselves to great detail, and for this reason, it is wise to leave tables to the written report, or in the report appendixes or to a separate methodology and data report.
In summary, it is the integration of the presentation narrative, graphics, and tables that tells the story of the survey results. The fundamental content is the foundation of the presentation, but if it is delivered in a way that doesn’t meet the audience or members’ needs and expectations, if it doesn’t interest them, and if it doesn’t create an understanding of the survey, then all of the work and effort of the survey will likely just gather electronic dust on some hard drive or network server.
Summary
- Presenting survey findings is one of the most critical aspects of the survey process, yet it is often given only passing attention.
- Presentations reflect the amount of work that went into the survey.
- If the presentation is poorly done, lacks clarity, or is not well organized, important information from the survey isn’t conveyed to the sponsors and other intended audiences.
- The sponsor should identify the deliverables at the onset of the survey project, which will determine what form the presentation takes and how it is to be delivered.
- Commonly, survey results are provided in the form of reports, executive summaries, PowerPoint presentations to audiences, materials posted to website, or through feeds on social media. Details of the methodology, statistical analysis, and data are frequency placed in appendices to the full report or are presented in a separate methodology report.
- The acronym ACE can be a helpful tool in focusing on the three major components to be considered when preparing a presentation.
- A—Audience: Who is the audience of the presentation?
- C—Content: What are the key points that we need to convey?
- E—Expression: How do we present the survey in a way that is clear, understandable, and complete?
- Knowing your audience is a critical part of developing an appropriate presentation. Maintaining contact with the sponsors and designated audiences helps you tailor the presentation both in content and form.
- What are the audience’s needs and expectations?
- Is the audience technical, nontechnical, or mixed?
- What level of understanding does the audience have of the survey process, methods, analysis, and so forth?
- The content serves as the foundation for the presentation. The content should address the following:
- Why the study was undertaken (introduction and background)
- How it was designed and structured (methodology)
- How the information was gathered (data collection)
- How the data were examined (the analysis)
- What the findings (results) were
- What the findings mean (summary and recommendations)
- The content can be presented in a formal fashion or may be less formally presented depending on the audience’s needs and expectations.
- Today, presentation of survey results tends to be done in a less regimented structure, especially when surveys are commissioned by organizations for internal purposes.
- More informal styles usually mean omitting certain elements characteristically seen in formal reports, such as an abstract, literature review, and detailed presentation of the methodology. However, today’s survey presentations typically contain an executive summary, which was not part of the traditional format.
- Executive summaries may be written in a narrative style but typically make extensive use of bulleted formats.
- Contents presented as PowerPoint presentations or executive summaries have a lower level of granularity, meaning the level of detail is less.
- Today, presentation of survey results tends to be done in a less regimented structure, especially when surveys are commissioned by organizations for internal purposes.
- Privacy, confidentiality, and proprietary information
- It is important to keep in mind that certain types of information collected during the course of a survey may be confidential, anonymous, or proprietary.
- There are federal regulations that protect individuals from harm during research, including both the collection and presentation of survey data. These regulations are referred to as human subject protections.
- Researchers and sponsors have an obligation to survey participants to ensure that commitments regarding the protection of their private and confidential information are kept and that participants are not exposed to risk because of the disclosure of such information.
- Sponsors are considered the owner of the survey, but sponsors and researchers should have clear agreements made at the beginning of the project as to the extent and terms of this ownership, particularly regarding data and proprietary information.
- It is important to keep in mind that certain types of information collected during the course of a survey may be confidential, anonymous, or proprietary.
- The expression component of the presentation refers to how the survey findings are disseminated.
- The focus in the presentation should be on substance not style.
- Content remains the same irrespective of the way it’s delivered.
- The survey presentation is a reflection of the sponsors and researchers.
- Presenting survey data is one of the most difficult aspects of survey presentation.
- Presenting survey data without commentary and summary is not good practice.
- Synthesizing and providing commentary on survey statistics brings meaning to the collected data; it is essentially statistics story-telling.
- Data can be presented in text, graphic, or table formats, but presentations usually include all three because it meets the needs and expectations of a broader audience.
- The strength of text or narrative presentation is in providing explanation, commentary, or summary of numerical or quantitative data, not for actually presenting the data. Text should be simple, clear, and brief, but not so brief that the wording becomes meaningless or unintelligible in terms of describing the data.
- Graphics can be used to present or relate complex findings as an alternative to lengthy descriptions in text. Graphics should be appropriate to the kind of data they’re displaying and should be simplified as much as possible.
- Tables can be used to display a lot of data in an organized and succinct manner. Tables are particularly helpful in presenting detailed numeric results but are not typically suitable for executive summaries and PowerPoint presentations.
Annotated Bibliography
General
- Arlene Fink, as part of The Survey Kit series, provides a short book, How to Report on Surveys,22 which gives an easy-to-understand overview of important elements in the survey report.
- A very helpful ancillary resource is The Facts on File Guide to Research23 by Jeff Lenburg. This book covers a wealth of research sources as well as information on different writing formats.
Audience Considerations
- Patrick Forsyth provides a good discussion of the interface between the audience and the written research report.24
Presentation Elements
- For a very good perspective on the elements of report technical writing, see Lutz Hering and Heike Hering’s How to Write Technical Reports.25
- For example, The American Psychological Association’s Publication Manual provides a thorough review of areas such as the mechanics of style and details of presenting results.26
Narrative, Charts, Graphs, and Tables
- See J. Miller’s The Chicago Guide to Writing About Numbers.27
- Pamela Alreck and Robert Settle provide information about formatting different types of tables and graphs to display survey questions responses and show how to write around the visual presentation of data.28
- Edward Tufte’s classic works on the visual presentation provide excellent insights into some of the dos and don’ts of presenting data in visual form.29
iThese were discussed in Chapter 2 of Volume I “Sampling.”
iiNote: The APA Style Manual is particularly oriented toward the publication of research in peer-reviewed journal formats. Survey research published in these journals would generally follow this format.