
9
Advances in dry cooling for concentrating solar thermal (CST) power plants
K. Hooman, Z. Guan, and H. Gurgenci The University of Queensland, Brisbane, Queensland, Australia
Abstract
Comparing with wet cooling, using dry cooling in solar thermal power plants can save fresh water of about 3.5 m3/MWh. This chapter introduces the advances in dry cooling technology for solar thermal power plants. It starts with the introduction of the current cooling technologies suitable for solar thermal power plants and compares the advantages and disadvantages of each technology. It then presents the essential equations and procedures of sizing a dry cooling system for solar thermal power plant. Finally, the advances made in dry cooling technologies for solar power plants were presented: the advances made in dry cooling include solar enhanced natural draft cooling tower; water hybrid cooling and wind break wall hybrid natural draft dry cooling tower.
Keywords
Air cooled heat exchanger; Dry cooling; Hybrid cooling; Natural draft cooling tower; Solar enhanced cooling tower; Spray cooling
9.1. Introduction
All thermal power plants (including concentrating solar thermal, CST) need a cooling system to cool the turbine exhaust. It is well known that the Carnot cycle efficiency  is maximized with the highest possible heat source temperature TH and the lowest possible heat sink temperature TL. According to this correlation, a cooling tower must be designed and built to provide the lowest possible heat sink temperature and is an integral part of a thermal power plant.
Fig. 9.1 shows a simplified CST plant with parabolic trough for electricity generation. As the figure shows, the parabolic trough consists of a linear parabolic reflector that concentrates light onto a receiver (tube) positioned along the reflector's focal line. The reflected sunlight heats up the fluid flowing through the tubes. The hot fluid is used to boil water in a conventional steam-turbine generator to produce electricity. Once the steam has passed through a turbine for electricity generation, it has to be condensed into water by the cold water from the cooling tower. The function of the cooling tower is to continuously provide cold water to condense the turbine exhaust steam. Colder water cools the exhaust steam more effectively and more net power can be generated from the plant.
In general, water and air are the two mostly used cooling media in a cooling tower. According to the primary cooling method used, cooling towers can be classified as either wet or dry cooling. Wet cooling towers reject heat through the direct contact of the water with the flowing air and the cooling is achieved primarily by evaporation. Dry cooling towers transfer heat through air-cooled heat exchangers that separate the working fluid (steam or water) from the cooling air.

Wet cooling is more efficient than the dry counterpart at the expense of water loss to the ambient. For instance, it has been reported that the steam-cycle cooling accounts for over 90% of water consumption in a typical wet-cooled CST plant [1]. The consumption of large quantity of water is to be limited by policy or cost in arid remote area, where CST plants are most likely to be located in future. Therefore, dry cooling will be the cost-effective option for CST plants.
While dry cooling has advantages for water conservation and environmental protection, it suffers from lower efficiency when ambient air temperature is high [2]. According to the experiences gained from coal-fired power plants, it is expected that the CST plants using dry cooling will suffer from the low efficiency during hot periods, which are often the periods of peak system demand and higher electricity sale price. Thus, new technologies offering an increase in electricity generation from CST power plants during high ambient temperature are required.
9.2. Current cooling technologies for concentrating solar thermal power plants
The cooling technologies available for CST plants can be classified into wet or dry cooling with respect to the heat transfer mechanism employed. In either case, either mechanical or natural draft cooling tower can be used to draw air through the tower.
9.2.1. Wet cooling towers
In a wet cooling tower, the water and air are in direct contact, which results in cooling primarily by evaporation.
As shown in Fig. 9.2, hot turbine exhaust steam is condensed in a condenser by the cold water pumped from the bottom of the cooling tower. After the heat exchange between the hot exhaust steam (from the turbine) and the cold water (from the cooling tower), the cold water gains heat and becomes hot while the exhaust steam is condensed. The hot water in the tower loop is then piped to the cooling tower and is distributed onto the fill material. Air is introduced across the fill material by either mechanical draft (fans as shown in Fig. 9.2) or natural draft (tall tower) as shown in Fig. 9.3 [3]. In the fill material, the moving air makes direct contact with the hot water and carries the heat away resulting in cooling the hot water. The cooled water is then collected in a cold water basin below the fill from which it is pumped back to the condenser. The fill material increases both the water/air contact area and the contact time for better cooling performance.
Wet cooling towers transfer the heat from the water stream to the airstream by evaporation, which raises the air temperature and its relative humidity to 100%. The saturated air is then discharged into the atmosphere. Because the performance of wet cooling is dependent on the ambient air wet bulb temperature, it has higher cooling efficiency than dry cooling which relies on the air dry bulb temperature.


The heat transfer in wet cooling tower is mainly by latent heat through water evaporation and only partially (marginally in most cases) by sensible heat transfer. As such, large quantities of water evaporate into the moving airstream to be discharged into the atmosphere on leaving the tower. The water lost to the evaporation must be continuously replaced. In addition, because evaporation concentrates impurities in the water, some of the circulating water is deliberately drawn off to prevent extensive scale formation. This is called “blowdown.” The moving air also carries away some water droplets, which are called drift. The evaporation loss, blown-down water, and drift water correspond to the total water loss in a wet cooling system. Turchi et al. reported that wet cooling takes more than 90% of water consumption in parabolic trough CST power plants [1], and the average water consumption per megawatt power generation for the wet-cooled parabolic trough CST plants is 3.5 m3/MWh. Williams and Rasul [4] reported the water evaporation rate for a coal-fired power plant of 350 MW capacity in Queensland, Australia, was around 1.8 m3/MWh power generation. This is about 630 cubic meter water per hour or 5.5 million cubic meters per year for a 350 MW coal-fired power plant. NETL [5] reported that a total makeup water of 5188 gpm was consumed for a 520 MW power plant in USA, among which, the evaporation water was 3891 gpm and the blown-down water was 1297 gpm. The water consumption is about 2.27 m3/MWh power generation.
Except for the large amount of water consumption, a wet cooling tower requires frequent water treatment to minimize the scaling and fouling; to prevent growth of bacteria, fungi, and algae; and to eliminate the growth of Legionella that causes Legionnaires' disease. Wet cooling towers also cause other environment impact such as fog producing.
9.2.2. Dry cooling towers
Dry cooling towers conduct heat transfer through air-cooled heat exchangers that separate the working fluid from the cooling air. Because there is no direct contact between the working fluid and the ambient air, there is no water loss in this system. Dry cooling towers have two basic types: direct and indirect systems.
In a direct dry cooling tower, turbine exhaust steam is condensed directly through an air-cooled condenser (ACC). As shown in Fig. 9.4, the turbine exhaust flows directly into the tubes of ACC. A large-diameter piping is used at the turbine outlet to accommodate the relatively low steam densities (compared with water) and reduce the pressure drop through the route. The exhaust steam flows inside the tubes of ACC and is condensed by transferring the heat to the flowing air outside the surface of the heat exchanger.
With indirect dry cooling tower, as shown in Fig. 9.5 [3], the turbine exhaust steam is condensed in a surface heat exchanger called condenser where the heat of the exhaust steam is transferred to the cold water pumped from the air-cooled heat exchanger located inside the cooling tower. The cooling water gains the heat in the condenser and is pumped back to the heat exchanger inside the cooling tower. Air is introduced to flow across the exterior surface of the heat exchanger to cool the hot water inside the heat exchanger tubes. The cooled water inside the heat exchanger tubes is then pumped back to the condenser. The turbine exhaust is condensed by the circulating water rather by the ambient air directly; hence, it gets the name of indirect cooling.
In a dry cooling tower, air can be introduced either by mechanical draft (fans as shown in Fig. 9.4) or by natural draft (tall tower as in Fig. 9.5) to move the air across the ACC/air-cooled heat exchangers. Increasing volumetric flow rate of air through heat exchangers improves the performance of the cooling system which ultimately depends on the air dry bulb temperature.


For a CST power plant, the choice between wet and dry cooling systems involves a number of trade-offs including the availability and cost of water, environmental aspects, and the cost of electric power. Because CST power plants, in general, are located in arid areas, water conservation is a major factor favoring for dry cooling towers.
Although dry cooling has advantages for water conservation and environmental protection, it suffers from lower efficiency when ambient air temperature is high. Thus, new technologies in increasing CST power plant production during high ambient temperatures are required.
9.3. Air-cooled heat exchanger and cooling tower sizing
Air-cooled heat exchanger is a key element of a dry cooling system. Thermal characteristics and pressure drop are the two most important parameters for evaluating the performance of a dry cooling system.
9.3.1. Thermohydraulics of air-cooled heat exchanger
In a dry cooling system, the hot fluid flows inside the heat exchanger tubes while the ambient air flows outside the tubes. Because the air-side heat transfer coefficient is much lower than that of the hot fluid inside the tubes, the surface area of the heat exchanger has to be increased by adding fins onto the bare tubes to achieve the required heat transfer rate. This type of heat exchanger is called finned tube heat exchanger as shown in Fig. 9.6.
The selection of finned tube heat exchanger parameters and the material is based on the fluid temperature, fouling and cleanability, environment (corrosion), and cost.
Models predicting thermohydraulics of air-cooled heat exchangers have been developed by various researchers for sizing (and also rating) the heat exchanger and cooling tower [2,6]. These parameters are also provided by heat exchanger manufacturers, usually in the form of factory test data.
The heat exchange rate of an air-cooled heat exchanger can be expressed in the form of [2]:
![]() (9.1)
(9.1)
where U is the overall heat transfer coefficient referred to the area A, W/(m2 °C); A is any convenient transfer area pertinent to U, m2; FT is the correction factor.
For counterflow arrangement, ΔTlm—logarithmic mean temperature difference, °C—is calculated as:
![]() (9.2)
(9.2)
where Th2 is hot fluid outlet temperature; Th1 is hot fluid inlet temperature; Tc1 is cold fluid (air) outlet temperature; Tc2 is cold fluid inlet temperature.

The product of the overall heat transfer coefficient and the transfer area (UA) should always be used. When different areas are used, the result of U will be different, but the product of U and A will always be the same.
With finned tube heat exchangers, the total air-side area Ao includes both the fin area and the exposed tube root area. When calculating this total area, fin efficiency must be taken into account. In this case, the outside area Ao is calculated as:
![]() (9.3)
(9.3)
where Ar is the exposed root area of the tube, Af is the fin area, and ηf is the fin efficiency. The fin efficiency is an indication of the effectiveness of the fin.
Based on air-side area Ao of a finned tube heat exchanger, the overall heat transfer coefficient U can be calculated using the following equation:
 (9.4)
(9.4)
where Ai is the tube-inside area; hi and ho are the convection heat transfer coefficient of the fluid inside and outside; ro, ri, and L are the outside radius, inside radius, and length of the tube, respectively; k is the thermal conductivity of the tube material; and Rfo is the resistance caused by fouling, corrosion, etc.
U can be either obtained from the heat exchanger manufacturers directly or derived by Eq. (9.4). Because convection heat transfer coefficients hi (inside fluid) and ho (outside air) are velocity dependent, various empirical models have been developed to predict these two parameters (hi and ho) when Eq. (9.4) is used. These two convection heat transfer coefficients are expressed in terms of dimensionless Nusselt number.
Different equations have been derived for laminar/transition/turbulent flow of fluid inside the tube. Hausen [7] proposed the following equation for turbulent flow in tubes which can be used for calculation of the convection heat transfer coefficient hi:
 (9.5)
(9.5)
where Nu is Nusselt number, d is the diameter of the tube, Re is the Reynolds number, Pr is Prandtl number, and L is tube length.
For the convection heat transfer coefficient of air-side ho, Briggs and Yang [8] proposed a generic equation for a six-row, staggered (set on equilateral triangle) finned tube heat exchangers:
 (9.6)
(9.6)
Eq. (9.6) is valid within the following limits:
![]()
![]()
![]()
![]()
![]()
When quoting the value of overall heat transfer coefficient U given by the manufacturers rather than using the previous equation, it is important to identify the reference area associated with the value.
When using Eq. (9.1) to calculate the heat transfer of an air-cooled heat exchanger, one needs to know all four terminal temperatures to obtain the logarithmic mean temperature [Eq. (9.2)]. In practical design of CST power plants, outlet temperatures of the hot fluid, Th2, and the outgoing temperature of the cooling air, Tc1, are not known and need to be found by an iterative procedure based on the following heat balance equations.
Heat rejected from the hot fluid inside heat exchanger:
![]() (9.7)
(9.7)
Heat transferred to the air outside heat exchanger:
![]() (9.8)
(9.8)
Heat transfer through heat exchanger can be calculated by Eq. (9.1). The heat transfer rate by heat exchanger, by hot fluid inside and by air-side must be balanced.
With the heat balance, Q = Qw = Qa
The inlet temperatures of the hot fluid (Th1) and the ambient air (Tc2) are known from the power plant design data, which leaves three unknowns: the two exit temperatures (Th2, Tc1) and the heat transfer rate (Q). These unknowns can be determined from the three Eqs. (9.1), (9.7), and (9.8) through an iterative procedure.
The effectiveness-NTU method can be used for thermohydraulic performance prediction without applying the previously mentioned iterative procedure. The effectiveness of a heat exchanger, e, is defined as the ratio of the actual rate of heat transfer to the maximum possible rate of heat transfer (e = Q/Qmax). The maximum possible rate of heat transfer can be expressed as Eqs. (9.9) and (9.10) depending on which of the heat capacity rates (product of the mass flow rate and specific heat—mwcpw and macpa) are smaller.
![]() (9.9)
(9.9)
where Th1 is inlet hot fluid temperature; Tc2 is ambient air temperature; and Cmin is the smaller heat capacity rate between the hot fluid mwcpw and the cooling air macpa.
The actual heat transfer is then given by
![]() (9.10)
(9.10)
Calculation of the effectiveness, e, can be found in various literatures [2,9]. The equations for calculation of a counterflow heat exchanger are given below:
For counterflow, indirect dry cooling system,
![]() (9.11)
(9.11)
For ACC (direct cooling),
![]() (9.12)
(9.12)
where N = NTU = UA/Cmin; C = Cmin/Cmax; Cmin is the minimum of macpa and mwcpw; and Cmax is the larger one.
When using the effectiveness-NTU method for thermal characteristics prediction, the first step is to calculate the effectiveness, e, by using Eq. (9.11) or (9.12). Once the effectiveness has been obtained, the actual heat transfer, Q, can be derived by Eq. (9.10). Once Q is known, the two outlet temperatures of the fluid and air (Th2, Tc1) can be calculated using Eqs. (9.7) and (9.8), obviously, without any iterative procedure.
Similar to the heat transfer, the air-side pressure drop of a finned tube heat exchanger is velocity dependent. The friction and contraction cause pressure drop when air flows through the heat exchange. Air-side fouling has a significant impact on air-side pressure drop. The pressure drop data can be either obtained from heat exchanger manufacturers or derived from empirical models reported in the open literature.
In 1966, Robinson and Briggs [10] developed a correlation that was frequently used for pressure drop prediction for staggered or equilateral tube setting pattern:
 (9.13)
where Eu is Euler number,  is the pressure drop, Pt is transversal tube pitch, nr is number of tube row, and Gc is mass velocity. Pd is diagonal pitch as given in the following equation:
![]()
Eq. (9.13) is valid within the following limits:
![]()
![]()
![]()
![]()
![]()
![]()
![]()
![]()
The pressure drop of a heat exchanger can be expressed in the form of loss coefficient as in Eq. (9.14):
![]() (9.14)
(9.14)
where Khe is the loss coefficient of heat exchanger.
9.3.2. Mechanical draft cooling tower
When mechanical draft is used in an indirect dry cooling tower, the turbine exhaust steam is directed to and condensed in a condenser, where the cooling water is also directed to the same condenser to take the heat away from the exhaust steam. This heat carried by the water is rejected in the cooling tower through air-cooled heat exchangers. In this case, the hot fluid flowing inside the heat exchanger is the cooling water flowing through the condenser. The airflow around the exterior surface of the heat exchanger is caused by fans.
When mechanical draft is used in a direct dry cooling tower, turbine exhaust steam is condensed directly through ACC as shown in Fig. 9.4.
Design of mechanical draft dry cooling tower (direct or indirect) requires the heat transfer and pressure drop calculations. The former is needed for sizing the heat exchangers while the latter is used for the fan selection.
The heat transfer of the ACC shown in Fig. 9.4 can be expressed as
![]() (9.15)
(9.15)

![]() (9.16)
(9.16)
where ma is the air mass flow rate; Tao is the air temperature exiting the ACC; Tai is the air inlet temperature; mc, ifg and Tc are the mass flow rate, latent heat and the temperature of condensate, respectively.
For fan selection, the pressure drop of the cooling system must match the fan performance curve. The fan must deliver airflow rate ma efficiently to meet the requirement in Eq. (9.15).
The pressure drop of the ACC system consists of pressure drops caused by heat exchanger support ΔPts, plenum resistance ΔPpl, screen ΔPsc, and heat exchanger ΔPhe, etc. The total pressure drop of the ACC system can be expressed as follows:
![]() (9.17)
(9.17)
where Ki is the loss coefficient due to the heat exchanger support (Kts), fan plenum (Kpl), screen (Ksc), heat exchanger (Khe), etc., respectively; ρi is the air density at these locations; and vi is the air velocity at these locations.
The pressure drop of the ACC cooling system (system curve) obtained from Eq. (9.17) is drawn on the related fan performance curve as shown in Fig. 9.7 to check if the airflow rate meets the design requirement.
The fans can be selected based on the air volume flow rate ma/ρ and pressure drop to achieve the maximum fan efficiency.
9.3.3. Natural draft cooling tower
The performance of a natural draft dry cooling tower (NDDCT) is influenced by the characteristics of heat exchanger, the tower geometry, and ambient conditions. An NDDCT must meet the heat balance and draft equation at the specified ambient conditions.
For an indirect dry cooling tower, the heat transfer by air and water and the overall heat transfer are expressed in the following equations:
![]() (9.18)
(9.18)
![]() (9.19)
(9.19)
where Twi and Two are the inlet and outlet temperatures of the water.
The draft equation for a natural draft cooling tower takes the following form:
 (9.20)
The flow resistance of the tower and heat exchanger are shown in Fig. 9.8 as proposed by Kröger [2] and can be expressed as
![]() (9.21)
(9.21)
Ki represents the loss coefficient at tower support Kts, losses due to separation and redirection of flow at the lower edge of the tower shell Kct, losses at heat exchanger supports Khes, contraction losses Kctc, frictional losses at heat exchanger Khe, expansion losses at heat exchanger Kcte, and losses in kinetic energy at the outlet of the tower Kto, respectively, as shown in Fig. 9.8. The details of calculating these loss coefficients can be found in Ref. [2].
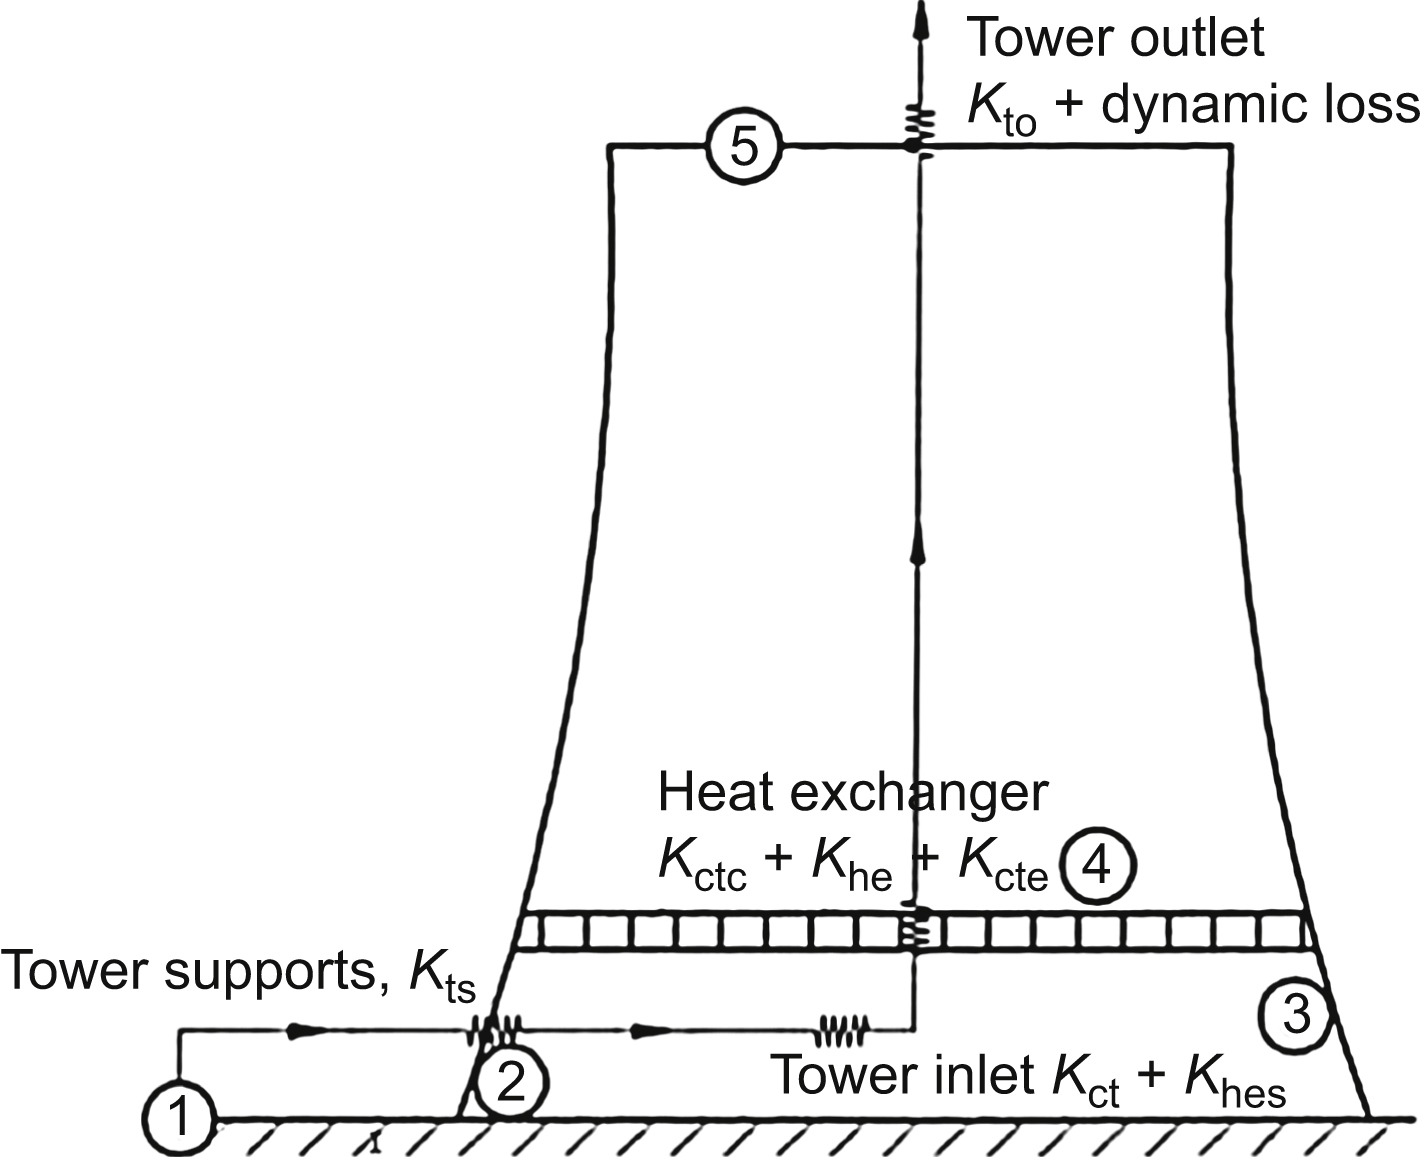
Figure 9.8 Flow resistance of the tower and heat exchanger [2].
On top of the three unknowns of Tao, Two, and Q, which need to be solved by the equations, there is an extra unknown (ma), which is also needed to be solved. Therefore, iterative processing has to be applied in NDDCT design.
9.4. Advances in dry cooling technologies for concentrating solar thermal power plants
In a dry cooling system, because the heat transfer coefficient of the air-side is much lower, an improvement on air-side heat exchange rate will increase the net power output of a power plant. According to dry cooling tower design, heat rejection by air-side of the heat exchanger is expressed in Eq. (9.22). To maximize the air-side heat rejection rate, Qa, by dry cooling system, one can either increase the air mass flow rate (ma) or decrease the air inlet temperature (Tai).
![]() (9.22)
(9.22)
The given two approaches (increasing ma or decrease Tai) have been implemented in the advanced hybrid cooling technologies developed by the Queensland Geothermal Energy Center of Excellence (QGECE), the University of Queensland. These advanced hybrid cooling technologies include solar hybrid natural draft cooling, water hybrid cooling, and windbreak wall enhancement hybrid cooling.
9.4.1. Solar hybrid natural draft dry cooling tower
NDDCTs function according to the simple principle of the stack effect. Because warm air inside the tower is less dense than the ambient air outside the tower, warm air rises due to buoyancy and a natural circulation occurs. The driving force for the natural circulation of air is proportional to the difference in air density between the inside and outside of tower and the tower height. Solar energy is used in this technology to heat up the air inside an NDDCT further to increase the density difference.
The solar hybrid NDDCT exploits the solar energy during the hottest periods at which the conventional dry cooling tower would suffer the lowest performance. The concept of the proposed system is shown in Fig. 9.9. The solar-enhanced hybrid cooling system includes a natural draft steel tower, sunroof, and heat exchangers. The sunroofs are arranged radially at the base of the tower, and the heat exchangers are placed vertically at the outside edge of the sunroof. As the Sun heats the sunroof, the air under the sunroof is heated up. Warm air naturally rises through the tower and fresh air is sucked in, thus providing a cooling airflow through the heat exchanger bundles. By this arrangement, it would enhance the performance of an NDDCT by increased ma due to the added solar energy to the airstream after the heat exchanger. The extra heat from the solar collectors increases the buoyancy of the air inside the tower and helps to drive more air through the heat exchangers. Higher air mass flow rate, ma as indicated in Eq. (9.22), has been achieved by this technology.

Zou et al. [11,12] used a 50-MWe geothermal power plant proposed for Cooper Basin, Australia, as a case study to demonstrate the improved performance of the proposed solar hybrid cooling tower. The global and direct hourly solar irradiance and average air hourly temperature records from Refs. [13,14] were used to represent a typical summer day in Cooper basin as reproduced in Fig. 9.10.
Other parameters selected in this case study include 182 six-row heat exchanger bundles, 4000 kg/s water flow rate inside the heat exchanger, 120 m tower height, 15% efficiency of the geothermal power plant, 27°C ambient temperature at the design point, and 450 m solar collector in diameter.
If the same tower height and heat exchanger area are used for both the solar hybrid natural draft cooling tower and the conventional natural draft cooling tower, solar hybrid cooling system is able to generate more power as shown in Fig. 9.11.


From Fig. 9.11, it is shown that the net power output decreases with increasing ambient temperatures no matter which cooling system is used. However, the net power reduction is less with solar hybrid cooling tower than without it (NDDCT) during the hottest part of the day; when the ambient temperature increases from 28.6°C at 8:00 a.m. to 36.7°C at 14:00 p.m., the net power suffers about 50% reduction with a conventional natural draft cooling tower. It is also noted that a relative high solar irradiance, from 12:00 noon to 14:00 p.m. and, when this solar energy is used in solar hybrid system, about 3 MW net power loss can be avoid at 14:00 p.m.
In the design of a cooling system for a particular power plant, the height of the tower has a reverse relationship with the area of heat exchangers, i.e., a higher tower requires smaller area of heat exchangers and vice versa. The trade-off between the heat exchange area and tower height can be optimized based on the minimum cost.
Once the height of the tower and the area of the heat exchangers are determined, selecting the right diameters of the sunroof and the arrangement around the sunroof becomes an important issue in the design of solar hybrid cooling tower.
Theoretically, increasing the solar sunroof size will increase the heat rejection rate as shown in Fig. 9.12. However, bigger solar roof size does not only increase the investment, but also may affect the airflow through the heat exchangers and affect the cooling performance. Large sunroof diameters provide a larger space for placing the heat exchangers, and the selected frontal area of the heat exchangers may not be large enough to cover the entire area provided by the outside perimeter of the sunroof. In this case, parts of the sunroof perimeter will need to be blocked, and the 3D numerical model has confirmed that this blockage will have a significant effect on the airflow and the cooling performance. To maximize the utilization of the sunroof, one design goal is to make the blocked area as small as possible (or the heat exchange coverage area as large as possible).
It seems that partial blockage in solar hybrid cooling system is unavoidable with increased sunroof diameter. The larger the sunroof diameter, the smaller is the heat exchanger coverage ratio, i.e., the ratio of the total heat exchanger frontal area to the flow area available at the perimeter of the sunroof.

3D simulations have been carried out [12] for various coverage ratios in a solar hybrid cooling tower. Six coverage ratios were modeled in this study: 100%, 60%, 55%, 50%, 45%, and 40%. For the heat exchanger type selected (keep the heat exchange area constant), these coverage ratios relate to sunroof diameters of 195 m (a), 325 m (b), 354.4 m (c), 390 m (d), 433.33 m (e), and 487.5 m (f), respectively, as shown in Fig. 9.13.
The heat rejection rate of the proposed solar hybrid cooling tower obtained by 3D numerical model is plotted in Fig. 9.14 when different sizes of solar roof are selected resulting in different heat exchanger coverage ratios. However, when the diameter of the solar roof increases to a limit in which the selected heat exchanger can only cover 40% of the area provided, there is a drop of the heat rejection rate. The plot of the airflow indicates that vortices are generated at the back of heat exchangers below this coverage ratio owing to the introduction of large partial blockage required to cover the rest of the perimeter. These vortices reduce the effective heat transfer area. These vortices cannot be detected by 1D model as indicated in Fig. 9.14. Therefore, the maximum size of the solar roof can be used in a solar hybrid cooling tower to guarantee a heat exchanger coverage ratio of about 50%. Beyond that ratio, any increase of the sunroof diameter will generate no further gains.


9.4.2. Water hybrid cooling
In this technology, water is introduced into the inlet airstream of the NDDCT. The introduced water evaporates and reduces the entering dry air temperature Tai. This cooler air then cools the dry system more efficiently as indicated in Eq. (9.22). The introduction of water into the entering air can be achieved by either wet media or nozzle spray.
Inlet air cooling by spray has been effectively used in gas turbine power plants to increase power output. The use of spray cooling for power plants has been studied by the Electric Power Research Institute (EPRI) [15].
The inlet air cooling can provide cost-effective alternatives for thermal power plants. Based on the previous test results obtained from both the laboratory and field (field test was on single-cell ACC), the EPRI [15] concluded that the allocation of cooling water in modest quantities (less than 10–15% of full wet cooling consumption) increased the power output by 50% or more during the hottest period. Ashwood and Bharathan [16] conducted modeling analysis using ASPEN Plus to evaluate various inlet air cooling methods for low-temperature geothermal power production. A sample of their modeling results is shown in Fig. 9.15. The figure shows that the net power generated during the hottest hours of the day with water spray can be significantly higher than that without water assistance. They also identified that the payback period with spray system could be less than 1 year for the geothermal power plant studied.

Although inlet air cooling have been successfully applied in the process industry, gas turbines, and small-scale mechanical draft cooling power plants, there is little experience for CST power plants, especially in the power plants with natural draft dry cooling systems. Frequent use of water spray in an NDDCT can cause corrosion, scaling, and fouling on the heat exchanger bundles if water droplets are carried by the airstream to the heat exchanger bundles. To avoid this, the system is required to evaporate all water in the airstream to prevent water droplet contact with heat exchanger surface. Special wet media or spray nozzles may be required to meet the requirement. High-pressure nozzles provide small water droplets but at a higher cost. Water quality affects the performance of the nozzles and its maintenance cost.
Fig. 9.16 shows the concept of the inlet air precooling hybrid NDDCT. Either wet media or nozzles are arranged under the tower to introduce the water to the inlet air.
9.4.2.1. Inlet air precooling with wet media
As shown in Fig. 9.16, the heat exchanger bundles are arranged horizontally at a height slightly above that of the tower inlet. The wet media are placed around the tower base to cover the whole inlet area. Water is distributed over the top of the media and flows down by gravity to wet the whole media surfaces uniformly. When ambient air passes through the wet media surfaces, it causes the water to evaporate and the air is then cooled. The cooler air flows through the heat exchanger and the performance of the cooling system is improved.

Figure 9.16 Proposed Inlet air precooling hybrid cooling system: wet media (left) and spray nozzles (right).
One of the main concerns of using wet media for inlet air precooling of an NDDCT is the pressure drop introduced by the wetted media. The additional pressure drop will have a strong effect on the air mass flow rate passing through the heat exchangers, which will then impair the heat rejection. Therefore, there is a trade-off between the cooling performance and the pressure drop when using wetted media for inlet air precooling. Experimental study was carried out to identify the best wet media for this application by QGECE of the University of Queensland.
Numerical model has been developed [17] to predict the performance of an NDDCT with introducing wet media to precooling the inlet air on hot and dry days. Significant benefits from the wet media hybrid cooling have been achieved.
Fig. 9.17 shows the simulation results with four different media applied in a natural draft dry cooling system. The results show that even the air mass flow rate is lower with wet media as shown in Fig. 9.17(a) (extra pressure drop introduced by the wet media); the heat rejection rate is still much higher with the wet media precooling (as shown in Fig. 9.17(b)). Some wet media perform better than other ones.
With the inlet air precooling application for NDDCTs, the high cooling efficiency of wet medium tends to improve the tower performance by reducing the tower inlet air temperature, while the extra pressure drop impairs the tower performance through its contribution to the flow resistances. Because the NDDCT is operated by the balance of both energy and draft equations, the cooling efficiency and extra pressure drop are all crucial to the tower performance. Wet media with high cooling efficiency provides more cooling at the expense of extra pressure drop. The media with low pressure drop have the advantage of small resistance but produce less cooling. There is a trade-off between selecting the cooling efficiency and pressure drop of a wet medium.

9.4.2.2. Inlet air precooling with nozzle spray
In this system, nozzles are used to spray water on the entering air only on extremely hot days. The nozzles can be distributed either horizontally under the heat exchanger bundles (as shown in Fig. 9.16) or vertically around the periphery of the tower. During high ambient temperature hours, water is sprayed into the inlet airstream to cool the incoming air by evaporation.

The major concern for the inlet air precooling with nozzle spray is the water droplet size. To avoid the problem of heat exchanger corrosion, scaling, and fouling caused by water spray, the water is required to be fully evaporated before reaching the heat exchangers to prevent water droplet contact with heat exchanger surface.
Experimental and modeling studies have been carried out to achieve the full evaporation by optimizing the nozzle selection.
A 3D computational fluid dynamics (CFD) model with dimensions 5.6 m long and 1 m × 1 m cross section has been developed by Alkhedhair et al. [18] as shown in Fig. 9.18 to simulate the nozzle spray. The 3D model dimension is the same as the dimensions of the testing facility (wind tunnel). Spray injection is placed 0.6 m above the tunnel floor and 0.55 m from the inlet and directed horizontally in a cocurrent direction with airflow.
The modeling results of droplet trajectories and equivalent air temperature profile along the wind tunnel duct at different cross sections are illustrated in Fig. 9.19, colored by their diameter and local air temperature. It can be seen from this figure that droplets are either airborne with the airstream to the outlet plane or evaporate completely before falling on the duct floor.
Unlike the inlet air precooling by wet media, no extra pressure drop is involved with the inlet air precooling by nozzle spray, and the only negative effect in this system is the reduction of the air density inside the cooling tower as indicated in Eq. (9.20).
To compare the cooling performance of inlet air precooling by nozzle spray, two new dimensionless parameters are introduced: the relative performance ηQ and the benefit efficiency βQ. ηQ is defined as the ratio of the heat rejection at the off-design to the heat rejection at the design point. βQ is defined as the ratio of the heat rejection with the inlet air precooling using the nozzle spray to the heat rejection without inlet air precooling. The simulation results on the relative performance ηQ and the benefit efficiency βQ are plotted in Fig. 9.20. The results were based on the cooling tower height of 38 m with the heat rejection capacity of 25 MW.
Fig. 9.20 shows that the relative performance ηQ (solid lines) and the benefit efficiency βQ (dashed lines) at different relative humidity achieved after inlet air precooling. The figure demonstrates that the overall performance of the NDDCT with inlet air precooling by nozzle spray has always been improved. More benefits can be achieved at higher ambient temperature.

9.4.3. Windbreak wall hybrid natural draft dry cooling tower
Traditional NDDCTs are normally built over 100 m in height. No small-sized natural draft cooling towers were built to suit small-scale power plants. With the increased desire to build small-scale CST power plants for remote areas in Australia, it is important to develop and demonstrate small, high-performance NDDCTs to improve the efficiency and power output of small CST plants.
A major design issue for small natural draft cooling towers is the negative effect of the crosswind on the cooling performance, which reduces overall plant efficiency. The performance degradation caused by crosswind is much more significant for small towers than for tall ones. QGECE has developed a windbreak wall hybrid solution to address the crosswind problem for small NDDCTs. By introducing a tri-blade-like windbreak wall underneath the heat exchanger bundles, the negative effect of the crosswind in a wide range of velocity ratios (up to 40) could be effectively arrested and even converted into a significant performance boost [19].

9.4.3.1. CFD modeling
In small NDDCTs with tower heights less than 30 m, the crosswind effect could be substantial and the CFD modeling aims to identify the effect of crosswind on a small NDDCT of height 15 m.


Without introducing the windbreak wall, the geometry of the tower in the CFD model, including tower support, is a cylinder with the size given in Fig. 9.21. The cylindrical shape was selected to represent the real steel construction of small towers. The details of the CFD modeling can be found in Ref. [19].
When the crosswind is introduced horizontally, the airflow pattern and the air temperature inside the cooling tower are affected by it. Fig. 9.22 shows the airflow streamlines inside the tower. Fig. 9.23 shows the air temperature contours at the central vertical cross section of the tower at various crosswind speeds.
At low crosswind speeds, such as 0.5 m/s, the airflow pattern inside the tower does not change much from no-crosswind condition. As the speed of crosswind increases, large volumes of vortexes are generated inside the tower which affects the airflow and therefore the uneven temperature distribution. The effect of the crosswind is to reduce the performance of the cooling tower.

To assess the effect of the crosswind on the NDDCT cooling performance quantitatively, the air mass flow rate ma and total heat transferred Q are computed. Fig. 9.24 plots the ma and Q against the crosswind speed vcw. The mass flow rate ma decreases first along with rising crosswind speed and remains nearly constant beyond 10 m/s. The variation of the heat transfer rate with crosswind is more interesting. For this small tower, the crosswind does not always exert a negative effect on the cooling tower performance in terms of total heat transfer rate. Q reaches its lowest value at a crosswind speed around 5 m/s and then increases with increasing crosswind speed. When the crosswind speed is larger than 15 m/s, the positive effect is shown.

The change of Q in this small tower is better understood by examining the two cooling components separately: the heat carried away by the air flowing through the tower vertically and exiting at the top, and the heat carried away by the air flowing through the bottom part of the tower horizontally. The total heat rejected from the heat exchangers, Q, is equal to the sum of these two components. When there is no crosswind, the second component is zero and all heat is dissipated through the air exit on the top of tower.
The change in Q as shown in Fig. 9.24 indicates that, when crosswind speed is larger than 5 m/s, the heat transfer rate through the bottom of the tower becomes influential in the overall heat transfer rate. This phenomenon does not exist in large NDDCTs because in a tall tower the heat rejected by the air inside the tower is dominant due to the large buoyancy force.
It is also noted, from Fig. 9.24, that with the existence of crosswind at speed about 5 m/s, the total heat rejection, Q, could decrease by 37% compared with no-crosswind condition, which leads to a significant drop in net power generation at this crosswind speeds. At some other high-speed levels, the total heat rejected, Q, was increased from its lowest level. It is very hard to design a small cooling tower under unpredictable crosswind without some controllable means to be implemented.
A tri-blade-like windbreak wall is introduced and placed underneath the heat exchanger bundles for the crosswind effect mitigation. Fig. 9.25 shows the CFD model with the proposed windbreak wall. The effect of the angle of attack of the crosswind was also examined. The variations of the heat transfer rates at different velocity ratios are examined [20].
Two dimensionless quantities were introduced by dividing the air mass flow rate ma and total heat rejection rate Qr obtained under crosswind to their corresponding values under no-crosswind maN and QrN, respectively. These dimensionless quantities are plotted against the velocity ratio δ for different angles of attack using solid lines, as shown in Figs. 9.26 and 9.27, respectively. For comparison purposes, the results without the windbreak walls are plotted in dashed lines in the figures.


Different attack angles show different declinations. Above the critical value, the trend is reversed, which indicates the benefits of the windbreak walls. The troughs of these curves, depending on the wind attack angle, occur in the velocity ratio range of 2.5–10. In this 15-m-high NDDCT, an air velocity ratio of 10 corresponds to a crosswind speed of ∼4 m/s. A comparison between the solid lines and the dashed lines shows the significant effectiveness of the windbreak walls at high velocity ratio (δ > 10).

It is noted that at the attack angles of 50 degrees and 60 degrees, the cooling performance is almost unaffected at low-velocity-ratio (δ < 10) regions, which implies a great advantage compared with other wind attack angles. Once the wind velocity ratio exceeds δ > 10 (vcw >4 m/s), a significant advantage is observed for the attack angles of 0 degree, 10 degrees, and 20 degrees, where the wind direction is closer to one of the walls.
The effectiveness of the windbreak wall is further investigated by the experimental study.
9.4.3.2. Experimental study
A scale model (based on applying similarity laws) of the mentioned tower was built and tested in UQ's Gatton wind tunnel [20].
The scaled tower model is shown in Fig. 9.28. A circular finned tube electric heater was used to represent the air-cooled heat exchanger.
In the experimental study, temperature, pressure, and speed sensors were employed to measure the temperature, pressure, and the air speed at different levels as shown in Fig. 9.29.
Similarity between the scaled tower model and the 15-m-high tower cannot be satisfied completely as certain dimensionless parameters are not the same for both. Therefore, a CFD model has been built for the scaled tower placed in the wind tunnel also. The purpose of building up this extra CFD model is to compare the CFD results with the experimental ones directly, which can validate the correctness of the CFD modeling methodology used in the approach.


Fig. 9.30 shows the air velocity ratio  (va is the natural draft air velocity inside the tower under crosswind conditions and vaN is the natural draft air velocity without crosswind) varies with the ratio of
  for the experimental result and also the results predicted by the two CFD models without windbreak walls.
It can be seen that the result of CFD model for the 15-m-high tower is different from the other two. This is because the similarity between the scaled model and the 15-m tower is not completely satisfied; for instance, the Reynolds numbers do not satisfy the similarity.


Fig. 9.31 shows the relationship between the dimensionless parameter  (Q is the heat rejection with crosswind and QN is the heat rejection without crosswind) and the speed ratio without the windbreak wall.
With the introduction of a tri-blade-like windbreak wall underneath the heater in the tower, Fig. 9.32 presents the results in the same way as in Fig. 9.30. Three dashed lines are the CFD results with the 15-m-high tower.

It is found that the windbreak wall increases the air velocity flowing inside the cooling tower as the crosswind speed increases.
Fig. 9.33 shows the dimensionless heat transfer rate as a function of crosswind speed ratio , obtained from the experiment and CFD results.

The figures show that the heat rejection rates are greatly increased by the introduction of the windbreak wall. The benefit of windbreak walls under the heat exchangers has been verified by the experimental results. The cooling performance of the tower even exceeds the performance of the no-crosswind case when the walls are arranged at attack angles of 0 degree and even 60 degrees. The windbreak wall hybrid small natural draft cooling tower is an effective new technology for the CST power plants.
9.4.4. Advances in tower structure
In a traditional NDDCT, the tower structure is made of reinforced concrete (RC). The erection of conventional RC tower requires advanced construction methods and skilled work force. Building such a tower is expensive and time-consuming. To overcome the typical expenses associated with RC natural draft cooling towers, and improve economics for small-scale towers, the QGECE has pioneered a modular construction from a steel frame and PVC polymer membrane. These materials dramatically reduce costs relative to concrete while still providing the same structural integrity and resilience to wind loading. The modular design also substantially reduces construction time (by an order of magnitude or more) and thereby reduces construction costs. The modular design enables rapid deployment to remote sites.
One of the structure frames built by QGECE is shown in Fig. 9.34 located at the Gatton campus of the University of Queensland. The frame is made of tubular members and each individual member is joined together by welding. The cost of the tower structure is greatly reduced.

9.5. Conclusions
CST power plants using dry cooling system have advantages of water conservation, flexible selection of site locations, and environmental protection. However, dry-cooled power plants suffer lower efficiencies when the ambient air temperature is high [2]. Up to 20% net power reduction was recorded during the hottest hours compared with the operations at average metrological conditions for coal-fired power plant. It is expected that CST plants using dry cooling will suffer the same way. High ambient temperatures usually coincide with peak system demand and higher electricity sale prices.
Because water conservation ranks top priority in future research on power plant cooling, new dry cooling technologies to address high ambient temperature are essential to increase the electricity production for CST plants. Although there are several step-changing cooling technologies, such as adsorption chillers, having potential for power plants’ water conservation application, they are either still in its early stage or have high risk financially. Future research on dry cooling should be focused on dry cooling technology innovation, improving thermal efficiency of air-cooled heat exchanger and cooling tower and reducing the costs.
The concept of solar hybrid NDDCTs has been considered a highly innovated technology by world cooling experts in an international cooling tower conference. Further study on the design optimization will be required to demonstrate the cost-effectiveness on the levelized cost of electricity (LCOE).
In spray cooling system, results showed that inlet air can be precooled by up to 80% of the difference between the wet bulb and dry bulb temperatures. This difference is 15–20°C in most future CST plant locations in Australia. Therefore, the technology has the potential to have a large impact on plant performance on hot days of the year. It is expected that multiple nozzles will be involved and optimization of the nozzles arrangement will be needed for a tower design to minimize the LCOE. The key for the optimization is the interaction study between multinozzles. This will also involve turbulence enhancement on the nozzle spray. To further save freshwater, saline water could be used, which requires further study for spray cooling.
The accurate cost study will be required based on the optimized design of the advanced dry cooling systems. The study should be based on the detailed cost study/comparison with different cooling technologies.
..................Content has been hidden....................
You can't read the all page of ebook, please click here login for view all page.