
Chapter 1. Creating Business Value with AI
In this chapter, we are going to explore why AI adoption in BI is becoming more important than ever and how AI can be utilized by BI teams. For this purpose, we will identify the typical areas in which AI can support BI tasks and processes, and we will look at the underlying machine learning capabilities. At the end of the chapter, we’ll go over a practical framework that will let you map AI/ML capabilities to BI problem domains.
How AI is changing the BI landscape
For the past 30 years, Business Intelligence has slowly but steadily become the driving force behind data-driven cultures in companies. The attention has shifted towards data science, machine learning and artificial intelligence. How did this even happen? And what does this mean for your BI organisation?
When we look back to the beginning of the first era of BI systems in the 1970s, we see technical systems that were used by IT experts to get insights from small (by today’s scale) datasets. Analysing data was new and so even the most basic insights seemed jaw-dropping.
The second era of BI started in the mid-2000s and was dominated by self-service analytics. New tools and technologies made it easier than ever for non-technical audiences to slice and dice data, generate visualisations and get insights from increasingly large data sources.
Most large corporations today are still stuck in this second phase of BI. Why is that? For one, many technological efforts in the last years have been focused on trying to technically handle the exponential growth of underlying data that BI systems are supposed to process and generate insights from. Second, the increase of data as shown in Figure 1-1 fuelled an increasing shortage of data literate people who are well-versed in handling high-dimensional datasets with the appropriate tools (which, in this case, isn’t Excel).

Figure 1-1. Data growth in recent years (Source: Statista)
Compared to the consumer market, AI applications are still underserved in the professional BI space. This is probably due to the fact that AI and BI talent sit in different teams within organizations, and if they ever meet, they have a hard time communicating effectively with each other. This is mainly due to the fact that both teams typically speak different languages and have different priorities. Meaning, BI experts usually don’t talk much about training and testing data, and data scientists rarely chat about SSIS packages and ETL routines. The need for AI adoption in BI, however, is going to inevitably increase due to the following ongoing trends:
-
The need to get quick answers from data: To remain competitive, organizations demand data-driven insights to help them grow. Data Analysts get overwhelmed with inquiries to explore this or that metric or examine this or that dataset. At the same time, the need for business users to get quick and easy answers from data increases. If they can ask Google or Alexa about the current stock price of a certain company, then why can’t they ask their professional BI system about the sales figures from yesterday?
-
Democratization of insights: Business users have become accustomed to getting insights from data with self-service BI solutions. However, the data itself is often too large and too complex to be handed off to the business for pure self-service analytics. High dimensionality and sometimes the sheer size of the data makes it difficult, if not impossible, today for non-technical users to analyse data with familiar tools on their local computers. In order to continue democratizing insights across an organization, BI systems are needed that are easy to use and surface insights automatically to the end-users.
-
Accessibility of ML services: While use of AI continues to rise within organizations, so does the expectation for better forecasting or better predictions. This applies even more so for BI; Low-Code or No-Code platforms make it easier than ever before to make machine learning technologies available to non data scientists and puts pressure on the BI team to incorporate predictive insights into their reports. The same advancements in data science are also expected to happen in the field of BI, sooner or later.
In order to get a better understanding of how Business Intelligence teams can leverage AI, let’s briefly review the analytical insights model published by Gartner1 as follows in Figure 1-2:
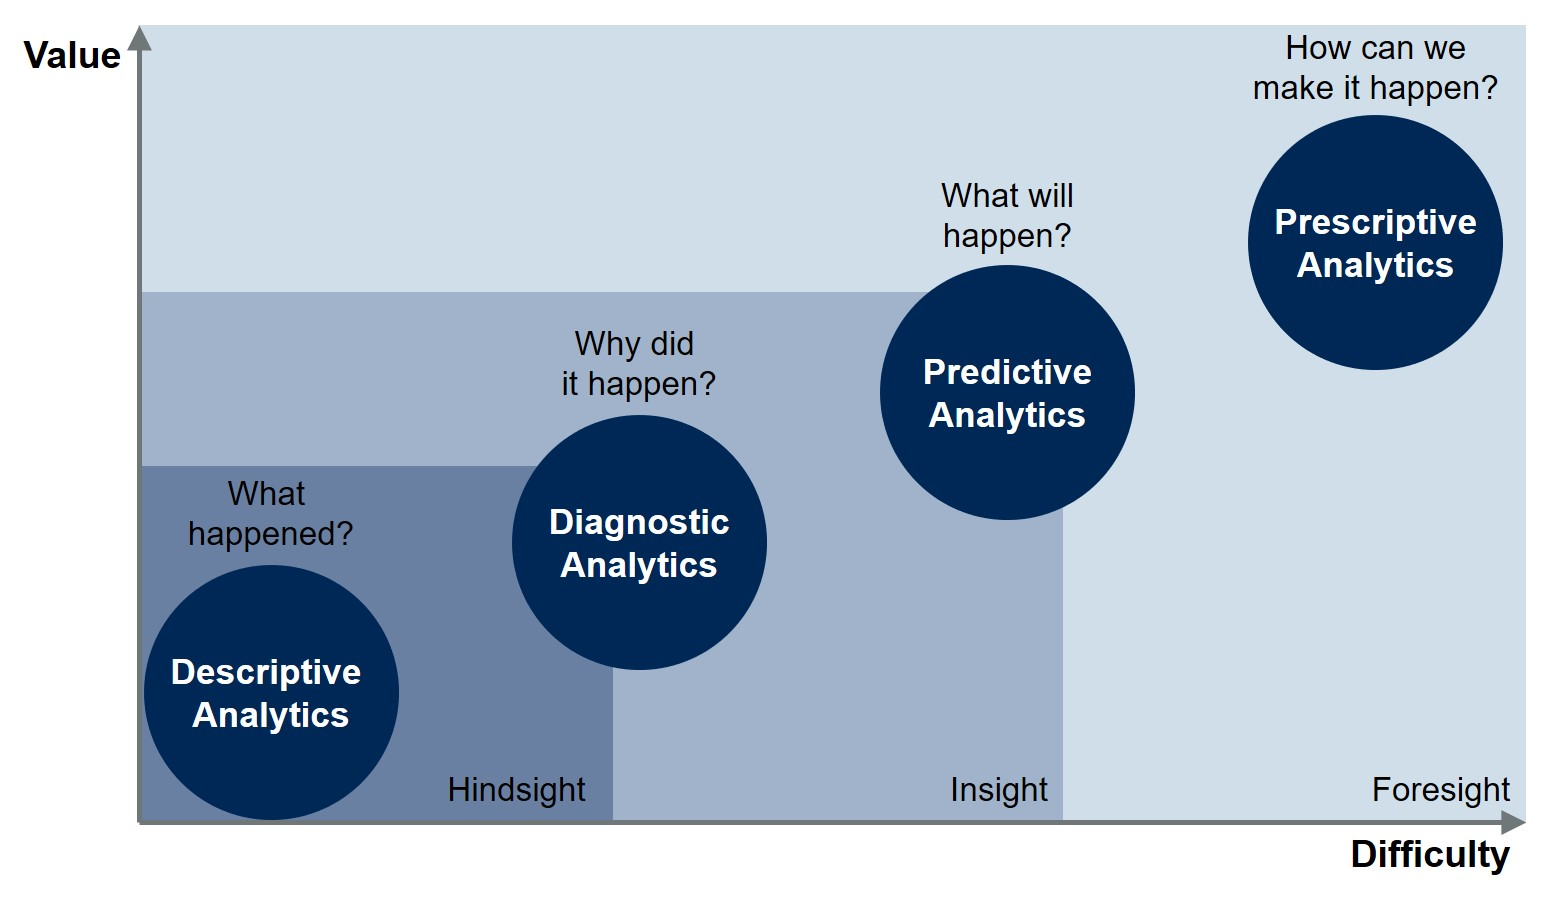
Figure 1-2. Types of insights and the analytic methodologies
The core functionality of every BI or reporting infrastructure is to deliver hindsight and insight using descriptive and diagnostic analytics on historic data. These two methods are paramount for all further analytical processes that layer on top of them.
First, an organization needs to understand what happened in the past and what was driving these events from a data perspective. This is typically called basic reporting with some insight features. The technical difficulty and complexity is comparably low, but so is the intrinsic value of this information.
Consider the following example: With a BI reporting system you could easily examine how many customers churned in the last week (descriptive). You could even understand which customer segments churned and what actions they took - or didn’t take - before they churned (diagnostic).
While this information by itself is quite useful, the value for the organisation is still limited. The insight itself won’t prevent churn in the future.
Therefore, the next logical step of our BI and reporting systems would be to ask: How many (and which) customers are going to churn in the future, e.g. next week?
We are now exploring future events and entering the field of predictive analytics. Since we are leaving the realms of historic data, the complexity rises. We can’t deliver insights any more in binary terms of true or false. Instead we are now talking about probabilities of certain events happening. Of course, this leads to an increased technical complexity and difficulty, but you can hopefully recognise the added value here.
Knowing which customers are likely to churn in the future gives us a handful of good options. Here are a couple examples: We can try to implement counter actions which hopefully retain customers or we can anticipate these changes with better planning.
Finally, once we know what is likely to happen in the future, we should care about which actions we take in order to prevent or anticipate our predictions. Welcome to the phase of prescriptive analytics.
Here is an example how this might work out: We predict customer churn for each User ID in our CRM system. A prescriptive model would consequently suggest a set of actions to take for each customer in order to reduce the churn likelihood, such as sending a certain email text or applying a certain price discount.
As we look into organisations with thousands or more customers it becomes clear that in order to optimize these tasks from a macro perspective, we need to rely on automation on a micro level. It is simply impossible to go through all these mini decisions manually. In contrast, a one-fits-all decision by the gut feeling of whoever is sitting in front of the computer is not likely to achieve the best results. And this is where AI and BI go perfectly together.
Consider an AI that recommends churn likelihood together with a suggested next best action on a per customer base. We can now blend this information with classical BI metrics such as the customer’s historical revenues or the customer’s loyalty, allowing us to make a decision about these actions that have the highest business impact and best chances for success.
The relationship between AI and BI can therefore be summed up nicely in the following formula:
Artificial Intelligence + Business Intelligence = Decision Intelligence
The most effective AI-powered BI application exists, once we blend automated and human decision making. We will explore this further in chapter 2.
Now, let’s take a concrete look at how AI can systematically help us to improve our BI.
Common AI Use Cases for BI
AI can typically add value to BI in three ways: (1) Automating insights and making the analytical process more user friendly, (2) calculate better forecasts and predictions and (3) enable BI systems to drive insights even from unstructured data sources. Figure 1-3 gives you a high level overview how these application areas map to the different analytical methods.

Figure 1-3. Mapping AI capabilities to analytical methods
Let’s explore these areas in a bit more detail.
Automation & Ease of Use
Making the BI tool itself more intelligent and easy to use will make it even more accessible for non-technical users, taking workloads off from the hands of analysts. This ease of use is typically driven by automation happening under the hood. Smart algorithms make it possible to comb through piles of data in seconds and surface interesting patterns or insights to business users or analysts. As Figure 1-4 shows, these routines work specifically well for the descriptive and diagnostic analytical stage, where interesting correlations or unusual observations in data are being discovered. But automation and ease of use also touch upon the stage of predictive analytics, for example by making it even easier for users to train and deploy custom ML models.

Figure 1-4. AI-powered BI: Automation & ease of use (application layer)
There is one important thing to note here: The AI capabilities at this stage are typically built into the application layer, which is your BI software. So it’s typically nothing you can simply “add” to a BI platform with a few lines of Python code (in contrast to AI-powered predictions and unlocking unstructured data, which we will discuss later in chapters 6, 7 and 8.) If you are using modern BI platforms such as Microsoft PowerBI or Tableau, then you’ll find these AI-enabled features inside these tools, sometimes they are hidden or happening so seamlessly that you don’t even notice that AI is at work here.
Here are some indicators where AI is typically working under the hood to make your life as an analyst much easier:
-
You can interact with data using Natural Language
By using AI-powered Natural Language Processes technologies, machines are much better at interpreting and processing textual input from users. For example, let’s say you want to know the sales results for last month or how the sales were in the US last year versus this year. You might type in the following queries:
How were my sales in Texas in the last 5 years? or
Sales $ in Texas last year vs Sales $ in Texas this year.
No complicated code or query language needed. This layer of Q & A–like input makes BI much more accessible to non-technical users and also more convenient for analysts who really can’t anticipate every question a business user might ask with a pre-made report. Most users will be quite familiar with this approach because it is similar to using a search engine such as Google.
Whether Q & A tools are either built-in to your BI tool or not, not all of these implementations work equally well. In fact, there’s a huge complexity that needs to be solved behind the scenes to make these features work reliably in production work environments. Analysts have to track what kinds of questions business users ask and validate if the generated output is actually correct. Synonyms and domain-specific lingo need to be defined to make sure systems can interpret user prompts correctly. And as with all IT systems, these things need constant maintenance. The hope is that the systems will improve and the manual effort needed in the background will decrease over time. -
Summarizing analytical results
Even if a chart seems self-explanatory, it is good practice to summarize key insights in one or two lines, reducing the risk of misinterpretation. But who really enjoys writing seemingly all-obvious descriptions below plots in reports or presentations? Most people don’t, and that’s where AI can help.
AI-powered Natural Language Processing can not only help you to interpret natural language input, but it can also generate summary text for you based on some data. These auto-generated texts will include descriptive characteristics about the data as well as noteworthy changes or streaks.
Here’s an example of an auto-generated plot caption from Microsoft PowerBI:
Sales $ for Texas increased for the last 5 years on record and it experienced the longest period of growth in Sales between 2010 and 2014.
As you can see, these small AI-generated text snippets can make your life as an analyst much easier and save you a bulk of time when it comes to communicating insights to other stakeholders. -
Automated pattern finding in data
We have seen how Natural Language capabilities can help you to get descriptive insights from your data efficiently. The next logical step is to find out why certain observations happened in the past, such as: Why exactly did sales in Texas increase so much?
With diagnostic analytics, you would normally need to comb through your dataset in order to explore meaningful changes in underlying data distributions. In this example, you might want to find out if a certain product or a certain event was driving the overall change. This process can quickly become tedious and cumbersome. AI can help you to decrease the Time to Insights (TTS). Algorithms are great at recognizing underlying patterns in data and bringing them to the surface. For example, with AI-powered tools such as decomposition trees or key influencer analysis you can quickly find out which characteristic in your data led to the overall observed effect – on the fly.
In Chapters 4 and 5, we are going to look at three concrete examples of how you can use AI-powered capabilities in Power BI to make your life as a data analyst or business user easier.
Improved Forecasting & Predictions
While descriptive and diagnostic analytics have been at the heart of every BI system, the immanent desire has always been to not only understand the past but also to foresee the future. As you can see in Figure 1-5, AI-enhanced capabilities can support end users to apply powerful predictive and prescriptive analytical methods for better forecasting and predictions based on historical data. This will add complexity since we leave the realms of binary data from the past and introduce probabilistic guesses about the future, which naturally contain many uncertainties. At the same time, the prospected value rises: If we were about to predict the future, we could make much better decisions in the present.

Figure 1-5. AI-powered BI: Better Forecasting & Predictions (Analytical Layer)
Now, if you heard about statistical methods like regression or Auto-Regressive Integrated Moving Average (ARIMA) before and wonder what is the big deal with AI, then take a note of the two following aspects:
-
AI can produce better forecasts with more data and less human supervision
AI leverages old-school techniques such as linear regression at its core but at the same time applies these to multi-dimensional spaces in combination with stochastic algorithms such as gradient descent to find an optimal solution in very complex spaces in a very short amount of time without the need for big human supervision. Specialised algorithms for time series predictions are designed to recognize patterns in larger amounts of time series data. AI tries to optimize the forecast based on feature selection and minimizing loss functions. This can lead to better or more accurate predictions using a short time horizon, or trying to predict more accurately over a longer period of time. More complex, non-linear models can lead to more granular and eventually better predictive results. -
AI can calculate predictions at scale for optimized decision making
Forecasting the total number of customers over the next quarter is nice. But what’s even better is to calculate a churn likelihood for every customer in your database based on recent data. With this information we are not only able to tell which customers will probably churn next month, but we can also optimize our decision making, such as: Of all customers that will churn next month, which one should be targeted with a marketing campaign? Combining machine learning with BI creates a potentially huge value proposition for an organisation. And with the advance of novel techniques such as AutoML and AI-as-a-Service, which we will explore further in Chapter 3, organizations can reduce the bottlenecks of having not enough data scientists or ML practitioners to leverage these AI potentials.
AI-capabilities for enhanced forecasting or better predictions can be found both as an integral part of an existing BI software (application layer), or they can be applied independently directly on a database level (analytical layer). This makes them always available, no matter which BI tool you are using. We will explore how to apply these techniques in Chapters 6 and 7.
Leveraging Unstructured Data
BI systems typically work with tabular data from (preferably) relational databases such as enterprise data warehouses. And yet, with rising digitalization across all channels we see a dramatic increase in the use of unstructured data in the form of text, images, or audio files. Historically, these forms are difficult to analyse at scale for BI users. AI is here to change that.
AI can increase the breadth and depth of available and machine-readable data by using technologies such as computer vision or natural language processing to access new, previously untapped data sources. Unstructured data such as raw text files, pdf documents, images, audio files, etc. can be turned into structured formats which match a given schema, for example in the form of a table or CSV file and can then be consumed and analysed through a BI system. As this is something that happens at the data ingestion level, this process will ultimately affect all stages of the BI platform (see Figure 1-6).
By incorporating these files into our analysis we can get even more information which can potentially lead to better predictions or a better understanding of key drivers. Chapter 8 will walk you through some examples of how this works in practice.
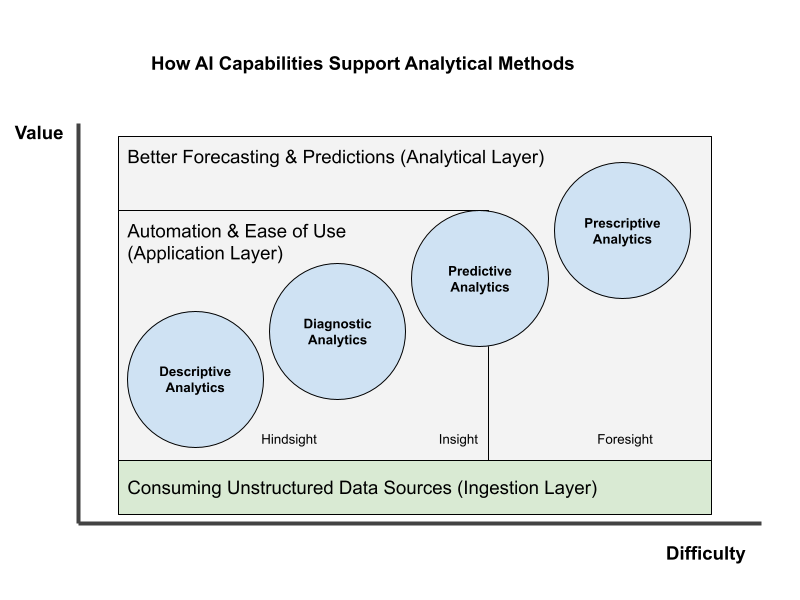
Figure 1-6. AI-powered BI: Unlocking unstructured data in the ingestion layer
Getting an Intuition for AI & Machine Learning
We’ve talked a lot about how AI can be used with BI. But in order to actually build AI-powered products or services, we need to dig deeper and understand what AI is and what it is capable (and not capable) of achieving.
So what is artificial intelligence, really? If you ask 10 people, you will probably get 11 answers. For the course of this book it is important to have a common understanding of what this term actually means.
Let’s first acknowledge that the term “Artificial Intelligence” is not new. In fact, the term dates back to military research labs in the 1950s. Since then, researchers have tried many different approaches to accomplish the goal of having computers or machines replicate human intelligence.

Figure 1-7. Development of Artificial Intelligence
As Figure 1-7 shows, two broad fields of AI have emerged since its inception: General AI and Narrow AI. General AI, or strong AI, refers to a technology that aims to solve any given problem that the system has never seen or exposed to before, similar to how the human brain works. General AI remains a hot research topic, it is still pretty far away: researchers are still uncertain it will ever be reached. Narrow AI, on the other hand, refers to a rather specific solution that is capable of solving a single, well-defined problem it has been designed for and trained on. Narrow AI has powered all the AI breakthroughs we have seen in the recent past both in research and practical or business-related fields.
At the core of Narrow AI there has been one approach that has stood out in terms of business impact and development advancements: machine learning (ML). In fact, whenever I talk about AI in this book, we look at solutions that have been made possible through machine learning.
That is why I will use AI and machine learning interchangeably in this book and consider AI as a rather broad term with a quite literal meaning: AI is a tool to build (seemingly) intelligent entities that are capable of solving specific tasks, mainly through machine learning.
Now that the relationship between AI and ML hopefully became a bit clearer, let’s discuss what machine learning actually is about.
Machine learning is a programming paradigm that aims to find patterns in data for the sake of a specific purpose. It typically has two phases: Learning (training) and inference (also called testing or prediction). The core idea behind ML is that we use historic data to find patterns in them to solve a specific task, such as, putting observations into different categories, scoring probabilities, or finding similarities between different items. An example of a typical use case for machine learning is to analyse historic customer transaction data to calculate individual probabilities of customer churn likelihood. With inference, our goal is to calculate a prediction for a new data point given everything that we learned from the historic data.
To foster your understanding of machine learning, let’s unpack the core components of our ML definition.
-
Machine learning is a programming paradigm:
Traditional software is built by coding up rules to write a specific program. If you develop a customer support system, you come up with all the logic that should happen once a customer files a support ticket, e.g. notify support agents via email. You document all the rules, put them into your program and ship the software.
Machine learning, however, inverts this paradigm. Instead of hard-coding rules into a system, you present enough examples of inputs and desired outputs (labels) and let the ML algorithm come up with the rule set for you. While this setup is ineffective for building a customer support system, it works great for certain scenarios where the rules are not known or very hard to describe. For example, if you want to prioritize customer support tickets based on a variety of features such as the ticket text, the customer type, ticket creation date, etc. a machine learning algorithm could come up with a prioritization model for you just by looking at how past tickets have been prioritized. Instead of handcrafting a complicated if-then-else logic, the machine learning algorithm will figure it out given a certain amount of computation time and computational resources. -
Pattern finding in data: In order to find useful patterns in data, three important concepts play together: Model, algorithm, and training. A machine learning model is the set of rules or the mathematical function that will calculate an output value given a specific data input. Think of it as a big stack of weighted if-then-else statements. The machine learning algorithm describes the computational process a machine has to follow in order to get to this model. And the term training means iterating many times over an existing dataset to find the best possible model for this particular dataset, which yields both a low prediction error and a good generalization on new, unseen data inputs, so that the model can be used for a specific purpose.
-
A specific purpose: Machine learning tasks are typically categorized by the problem they are trying to solve. Major areas are supervised and unsupervised learning. Although this isn’t a book on machine learning fundamentals, we are going to cover it in a bit more detail in Chapter 2.
If we consider all of the components, the task of a machine learning practitioner in a real-world situation then is to gather as much data about the situation of interest as is feasible, choose and fine-tune an algorithm to create a model of the situation, and then train the model so that it’s accurate enough to be useful.
One of the biggest misconceptions about AI and machine learning that business leaders often have is the fact that AI and machine learning are super hard to implement. While designing and maintaining very specific, high-performing machine learning systems is a very sophisticated task, we also have to acknowledge that AI has become commoditized and commercialized so that even non-ML experts can build well-performing ML solutions using existing code libraries in their code or using no-code / low-code solutions. In Chapter 3 you will learn more about these techniques so you can implement ML solutions by yourself without the help of data scientists or machine learning engineers.
To conclude this section, recall that AI as a term can be scary and intimidating for people who don’t really know what it means. The truth is, we are far off from Terminators and general AI. If you want to get broader acceptance and adoption of AI solutions inside your organization, you will need to communicate what AI is with a friendly and non-technical language. Thinking about AI as automation or being able to implement better decisions based on past learnings should make you comfortable enough to spot potentially good use cases and share that spirit with fellow co-workers.
Mapping AI Use Case Ideas to Business Impact
Now that you have learned more about AI and how it can be applied to BI, you might already have some ideas in mind for applying AI to your own use cases. To figure out which of those use cases have the most potential and are worth fleshing out, we will take a look at a story mapping framework you can use for exactly this purpose. The framework is inspired by agile project management techniques and should help you structure your thinking process.
The core idea of this AI story mapping framework is to contrast the present implementation of a process with how an AI-enabled implementation of the process would look like. This technique will give you a high level, end-to-end overview of what would be different, which things you would need to change, and, above all, help you to structure your thinking process.
The creation of a storyboard is straightforward. Take a blank piece of paper and divide it into a table with four columns and two rows. The four upper boxes will map your current process and the lower boxes will describe the future, anticipated implementation. Name the columns from left to right: Setup, actions, outcomes, results. Figure 1-8 shows how your piece of paper should look:

Figure 1-8. Storyboard template
To create your storyboard, you will need to populate the columns from left to right. You start with the first row, outlining how the current implementation of a given process works along the following dimensions:
“Setup” describes how the process starts, and lists your assumptions, resources or starting criteria.
“Actions” holds all tasks and action items that are executed by or on the resource outlined in the setup.
“Outcomes” describes the actual artifacts of the process. What exactly is being generated, created or modified?
“Results” holds the impacts the outcomes have on the business and/or subsequent next steps for the outcomes. For example, displaying a report in a dashboard is an outcome, but by itself does not have any impact. The impact is what is happening based on the information shown in the dashboard and who is doing this.
In the next step you will do the same for the anticipated future implementation. In the end you will have a head-to-head comparison of the old and the new approach, giving you more clarity about how things are going to change and which impact these changes might have.
To give a little bit more context how this exercise works, Figure 1-9 shows a sample storyboard for our customer churn use case.

Figure 1-9. Storyboard example
Let’s walk through our storyboard example. We start on the top left corner, laying out the current setup for the existing process.
Currently, customer churn is detected by sales people who get feedback from existing customers when talking to them in their regular meetings or by customer support employees who receive feedback from customers that some things are not working out as they hoped or they face other issues.
In the next step, customer support or sales try to solve the problem directly with the customer, for example, providing onboarding help.
The main outcome of this process is that customer support (hopefully) resolves existing pain points and problems for the customer. Pain points might be reported to a management level or complaint management system.
As a result the customer will hopefully stay with the current service after the issue has been resolved.
Let’s contrast this with how an AI-enabled implementation would look like, starting with the bottom left corner and proceeding right.
In our setup we would collect historic data about how customers were using different products and services and flag customers who churned and did not churn. We would also bring in people from sales and customer service to share their domain expertise with the analyst in the loop.
Our next action would be to analyze the historic data to determine if key drivers of customer churn can be identified in the dataset. If so, we would develop a predictive model which would calculate an individual churn risk for each customer in our database as well as provide insights for why the churn might be likely to happen.
As an outcome, these churn risk scores and churn reasons would be surfaced to the business, e.g., through a report in the CRM or BI system where this information can be blended with other metrics, e.g. customer revenue.
With this information, customer support could now reach out proactively to customers with a high churn risk and see if they can solve the problem or remove roadblocks before the customer actually flags a support ticket or churns without opening a ticket at all. As a result, the overall churn rate should reduce over time because the organization can better address reasons for customer churn at scale.
With both story maps - the existing and the new process - you should feel more confident to describe how a possible AI solution might look like, what benefits it could bring and if it is even reasonable to go for the new approach to either replace or blend it with the existing process.
As a conclusion, the idea of a storyboard is to provide a simple one-pager for each use case which intuitively contrasts the difference and benefits of the existing and the new solution. It will help you to structure your thinking process and is a solid starting point when it comes to prioritizing AI use cases.
Exercise: Use the storyboard template and map two or three AI use case ideas. Which of these ideas seem to be the most promising to you?
Summary
In this chapter we learned how AI is changing the BI landscape driven by the needs of business users to get quicker answers from data, the growing demand for democratized insights and an overall higher availability of commoditized machine learning tools. We explored how exactly AI can support BI through automation and better usability, improved forecasting and access to new data sources, thus empowering people to make better decisions. By now you should have a basic understanding how AI and ML work and what these technologies are capable of today. You also learned a framework which you can use to structure your thinking process and craft out ideas for ML use cases. In the next chapter we will take a deeper look on how AI systems are designed and which factors you need to consider before implementing these technologies in your enterprise BI services.
1 https://blogs.gartner.com/jason-mcnellis/2019/11/05/youre-likely-investing-lot-marketing-analytics-getting-right-insights/