
Effective Reservoir Identification and Prediction
As the focus of volcanic gas reservoir characterization, effective volcanic reservoirs can be identified qualitatively using a wide range of static and dynamic data and the established identification markers for different reservoirs. Effective volcanic reservoirs can be identified quantitatively by establishing cutoff criteria as well as classification and evaluation criteria. Based on well identification and seismic data calibration with log data, effective reservoirs can be classified and predicted through seismic inversion constrained by the internal structure of volcanic rocks. Furthermore, the spatial distribution patterns of effective reservoirs thus revealed will form the basis for optimizing well location and horizontal well trajectory design.
9.1 Research challenges and technical solutions
9.1.1 Challenges in the identification and prediction of effective reservoirs
Effective volcanic rock reservoirs are difficult to identify and predict because of their great variability, complex origins, and complicated logging and seismic responses. The main difficulties are as follows:
1. Volcanic rocks have complex lithology and related various reservoir spaces. In terms of logging responses, the differences between various effective reservoirs are not clearly defined. It is difficult to interpret reservoir porosity and permeability and to characterize reservoir accumulation and permeation capacity. Volcanic reservoirs have complex mechanisms of electrical conductivity and contain various types of low-resistivity gas layers and high-resistivity water layers, which increase the uncertainty of fluid type identification. This makes it difficult to identify effective volcanic reservoirs.
2. Volcanic rocks have complex internal architecture and, therefore, it is hard to carry out reservoir parameter inversions based on rock architectural control. Furthermore, volcanic reservoirs have strong heterogeneity, poorly defined distribution patterns, drastic thickness changes, and low seismic resolution, which makes it difficult to predict thin effective reservoir, and even more so to classify and predict them within effective reservoirs. The effective volcanic reservoir prediction technique focuses mainly on acquiring acoustic impedance and density data volumes through body-controlling seismic inversion, applying seismic classification criteria for reservoirs to extract classified effective thickness, and predicting the spatial distribution of effective volcanic reservoirs.
9.1.2 Technical solutions
To meet the challenges posed by the identification and prediction of effective reservoirs, the technical process is developed by comprehensive multidisciplinary investigations including geology, well logging, and seismic and gas reservoir engineering (Figure 9.1), and a set of integrated techniques is established for effective volcanic reservoir identification and prediction.

1 Effective volcanic reservoir identification
Different types of reservoirs, including volcanic vesicular reservoirs, intergranular pore reservoirs, dissolution-pore reservoirs, and fractured reservoirs, are identified qualitatively by establishing identification markers for lithology and lithofacies, reservoir space, and well logging, and then integrating data from cores, thin sections, petrophysics, acoustic and resistivity imaging logs, and nuclear magnetic and conventional logs.
Based on the preceding study and core experiment, as well as deliverability tests and log interpretation, we apply the methods of water film thickness analysis, deliverability test constraint, empirical statistic analysis, and crossplot analysis to set up cutoff thresholds (or the lower limit) and classification criteria for effective volcanic gas reservoirs. Furthermore, we integrate geological data, wireline log data, reservoir parameter interpretation results, and production performance data to quantitatively identify types I, II, and III effective volcanic reservoirs.
2 Classified prediction of effective volcanic reservoirs
After calibrating seismic data with well interpretation parameters, the seismic classification criteria of volcanic reservoirs are established by analyzing near-wellbore seismic trace characteristics and the seismic response characteristics of effective reservoirs in volcanic rocks. Furthermore, the volcanic framework model is constructed. The data volumes for 3D acoustic impedance, density, acoustics, and porosity are obtained by body-controlled seismic inversion. On the basis these studies, we extract total reservoir thickness, overall categorized (classified) reservoir thickness, and reservoir thickness above the water-gas contact in volcanic rocks according to the seismic classification criteria, so as to predict the distribution of effective volcanic reservoirs.
9.2 Identification of effective volcanic reservoirs
Geological identification markers and well-logging identification markers for different types of reservoirs and nonreservoirs are established on the basis of volcanic reservoir classification and analyses of their geological and well-logging characteristics. The effective volcanic reservoirs are identified qualitatively using core, thin-section, and log data. Furthermore, the cutoff criteria and classification criteria are established, and the effective volcanic reservoirs are identified quantitatively on the basis of an integrated analysis of static and dynamic data and parameter interpretation.
9.2.1 Qualitative identification of effective reservoirs
In terms of reservoir space characteristics, volcanic reservoirs are classified into four types: vesicular, intergranular pore, dissolution pore, and fractured. Nonreservoir bodies are classified into two types: tight volcanic rocks and sedimentary volcanic rocks. After setting up the identification markers for all types of reservoirs and nonreservoirs, the effective volcanic reservoirs can be qualitatively identified using multiple data sources.
1 Identification markers
On the basis of the types and the degrees of development of volcanic pores and factures, and combining logging response characteristics, a suite of markers is set up for lithology, lithofacies, reservoir space, and well-logging response regarding each type of reservoir and nonreservoir rock body, which provides a basis for the qualitative identification of effective volcanic reservoirs (Table 9.1).
Table 9.1
Identification Marks for Volcanic Reservoirs and Nonreservoirs
| Type of Volcanic Reservoir | Geological Characteristics | Logging Response Characteristics | |||||||||
| Typical Lithology | Typical Lithofacies | Main Reservoir Space | Acoustic and Resistivity Imaging Logging | Nuclear Magnetic Logging | Conventional Logging | ||||||
| Spectrum Shape | T2 Spectrum | Movable Fluid Peak Amplitude | Curve Value | Shape | Smoothness | ||||||
| Reservoir type | Vesicular reservoir | Volcanic lava, breccia lava, tuffaceous lava | Subfacies of top effusive facies, upper effusive facies and lower effusive facies | Vesicle | Yellow blocky texture, regular round and oval black spots distributed uniformly, with smooth margins | Bimodal or polymodal, scattered distribution | Wide distribution range, bigger average value | Bigger in top subfacies of effusive facies and medium in upper and lower subfacies | Medium to high Rt and DEN, medium to low AC and CN | Box-shaped, bell-shaped, funnel-shaped assemblage | Smooth- slightly denticulate |
| Inter-granular pore reservoir | (Welded) volcanic breccia, crystal (welded) tuff | Fallout subfacies, hot base surge subfacies and hot clastic flow subfacies of explosive facies | Inter-granular pore | Yellow-red blocky or porphyritic texture, irregular black round dots or polygonal spots with sharp margins | Unimodal or bimodal, continuous distribution | Wider distribution range, medium average value | Bigger in breccia of fallout subfacies, medium in hot clastic flow subfacies, smaller in hot base surge subfacies | Medium to low Rt and DEN, medium to high AC and CN | Box shape, bell shape, funnel shape | Dentoid- serrated | |
| Dissolved-pore reservoir | All types of volcanic lithology and lithofacies | Dissolved vesicle, Inter-granular dissolved pore and matrix dissolved pore | Red-dark red blocky or porphyritic texture, with irregular black strip locally | Asymmetrically bimodal | Medium distribution range and average value | Medium-big | Medium to low Rt, low DEN, high AC, medium to high CN | Box-shaped, bell-shaped, funnel shaped assemblage | Smooth- dentoid | ||
| Fractured reservoir | All types of volcanic rock | Middle subfacies of effusive facies, cryptoexplosive breccia subfacies of volcanic conduit facies | All types of fracture | Yellow-light yellow blocky texture, in irregular black lines with nonuniform distribution and sine line feature mostly | Unimodal or bimodal | Big distribution range | Relatively Small | High deep Rt, medium to low microresistivity, high DEN, low AC and CN | Box shape | Slightly dentate- dentoid | |
| Nonreservoir type | Tight volcanic rock | All kinds of volcanic rock | Middle subfacies of effusive facies, hot base surge subfacies of explosive facies, and inner subfacies of subvolcanic facies | A few vesicle pores and intergranular pore, low development of fracture | White-light yellow blocky texture, with fewer nonuniformly distributed black spots and lines | Without apparent modal feature | Big distribution range | Small | High Rt, high DEN, low AC and CN | Box shape | Smooth to slightly denticulate |
| Sedimentary volcanic rock | Sedimentary volcanic rock | Volcanic sedimentary facies | A few vesicle pores and intergranular pores | Black or alternating black-white porphyritic texture, with sediment beddings locally | Unimodal or asymmetrically bimodal | Small distribution range and low average value | Small | Low Rt, low(part high) DEN, high AC, high CN | Bell shape, funnel shape, finger shape, change in wave shape | Serrated | |

1) Vesicular reservoirs
Geological characteristics
Vesicular reservoirs are formed by effusive volcanic eruption. The reservoir lithology consists mainly of volcanic lava, brecciated lava, and tuffaceous lava. Their reservoir lithofacies mainly comprise the top subfacies, upper subfacies, and lower subfacies of the effusive facies. The reservoir space primarily consists of vesicles. Their pores are round or oval with smooth pore walls. The long axes of vesicles are usually parallel to the magma flow direction, directionally aligned, and form a rhyolitic structure.
Logging response characteristics
1. Acoustic and resistivity imaging logs. In general, the volcanic magma has low electrical conductivity and shows yellow (light) blocky structure in acoustic and resistivity imaging logs. On the background of this image, vesicular reservoirs show smooth round or oval black spots usually connected as alternating black-white lines or strips (i.e., vesicular rhyolitic structure) along the magma flow direction, similar to beddings.
2. T2 spectrum of nuclear magnetic logs. The T2 value is higher for big vesicles than for small ones. Vesicular reservoirs usually show bimodal or polymodal patterns in the T2 spectrum of nuclear magnetic logs, with a wide distribution range and high average value. Their mobile fluid peak amplitudes are related to the degree of vesicle development, which is high in the top subfacies of the effusive facies and moderate in the upper and lower subfacies.
3. Conventional logs. Vesicular reservoirs have poor pore connectivity and conductivity, showing the characteristics of medium to high resistivity (Rt) and density (DEN), medium to low accoustic traval time (AC) and compersated nuetron (CN). Most of the log curves have a smooth and slightly denticulate box shape and occasionally have a bell-funnel-shaped association.
2) Intergranular pore reservoirs
Geological characteristics
Intergranular pore reservoirs are of volcaniclastic origin, formed by an explosive volcanic eruption. Their reservoir lithology consists mainly of volcanic breccia, welded breccia, crystalline tuff, and welded tuff. The reservoir lithofacies comprise mainly the fallout subfacies, hot base surge subfacies, and hot clastic flow subfacies of the explosive facies. Their main reservoir spaces are primary intergranular pores, such as irregular polygons with sharp margins.
Logging response characteristics
1. Acoustic and resistivity imaging logs. Volcaniclastic rocks have a high electric conductivity and show yellow-red blocky or porphyritic textures in acoustic and resistivity imaging logs. Intergranular pores appear as irregular black round dots or polygonal spots with sharp margins in acoustic and resistivity imaging logs.
2. T2 spectrum of nuclear magnetic logs. Intergranular pore reservoirs usually show continuously distributed unimodal or bimodal patterns, with a wide range of T2 value and medium average value. Their mobile fluid peak amplitudes are related to the degree of intergranular pore development, which is high in the breccia of fallout subfacies, moderate in the hot clastic flow subfacies, and small in the hot base surge subfacies.
3. Conventional logs. Intergranular pore reservoirs have good pore connectivity and electrical conductivity, characterized by medium to low Rt and DEN and medium to high AC and CN in conventional log curves. Most of the log curves have dentoid-serrated box, bell, and funnel shapes.
3) Dissolution-pore reservoirs
Geological characteristics
Dissolution-pore reservoirs are of secondary origin, formed mainly by dissolution during later diagenesis in primary pore reservoirs. Their reservoir lithology and lithofacies span all types of volcanic lithology and lithofacies. The main reservoir spaces are dissolution vesicles, intergranular dissolution pores, and matrix dissolution pores, with irregular pore shapes.
Logging response characteristics
1. Acoustic and resistivity imaging logs. The electrical conductivity of volcanic rocks improves after the dissolution of soluble components, manifesting a red to dark red and blocky or porphyritic texture, with black irregular strips appearing in acoustic and resistivity imaging logs.
2. T2 spectrum of nuclear magnetic logs. Dissolution-pore reservoirs usually show an asymmetrical bimodal pattern, with a moderate range of distribution of T2 values and a medium average value. Their mobile fluid peak amplitudes are medium to high.
3. Conventional logs. Dissolution-pore reservoirs have good pore connectivity and electrical conductivity, showing the characteristics of medium to low Rt, low DEN, high AC, and medium to high CN; most of the curves are characterized by smooth-dentoid box, bell, and funnel shapes.
4) Fractured reservoirs
Geological characteristics
Fractured reservoirs develop in all types of volcanic rocks. The reservoir lithofacies comprises mainly the middle subfacies of the effusive facies and the cryptoexplosive breccia subfacies of the volcanic conduit facies. The reservoir spaces consist of all types of fractures, with undeveloped matrix pores.
Logging response characteristics
1. Acoustic and resistivity imaging logs. Fractured reservoirs have poor electrical conductivity, showing a yellow to light yellow blocky texture. Under this background, fractured reservoirs appear as various irregular black lines, mostly characterized by a sine curvature, with nonuniform distribution.
2. T2 spectrum of nuclear magnetic logs. Fractured reservoirs usually show unimodal or bimodal patterns, with a large distribution range of T2 values. Their mobile fluid peak amplitudes are relatively small.
3. Conventional logs. In conventional log curves, fractured reservoirs show the characteristics of high laterolog deep resistivity (LLD), low microresistivity, high DEN, low AC, and low CN, with curves having a slightly dentate-dentoid box shape.
5) Tight volcanic nonreservoirs
Geological characteristics
Tight volcanic dry layers can develop in all types of volcanic rock, with few pores or fractures. Their lithofacies mainly include the middle subfacies of the effusive facies, the hot base surge subfacies of the explosive facies, and the inner subfacies of the subvolcanic facies.
Logging response characteristics
1. Acoustic and resistivity imaging logs. Tight volcanic rocks have poor electrical conductivity, showing a white to light yellow blocky texture with a minor number of unevenly distributed black spots and lines.
2. T2 spectrum of nuclear magnetic logs. Tight dry layers show ambiguous peak patterns, with a wide distribution range of T2 values. Their mobile fluid peak amplitudes are small.
3. Conventional logs. A tight dry layer is characterized by high Rt, high DEN, low AC, and low CN, with curves having a smooth to slightly denticulate box shape.
6) Sedimentary volcanic nonreservoirs
Geological characteristics
The lithology of sedimentary volcanic nonreservoirs comprises mainly the volcanic sedimentary facies. Their reservoir spaces are limited to a minor number of intergranular pores, with poor fluid mobility.
Logging response characteristics
1. Acoustic and resistivity imaging logs. Sedimentary volcanic nonreservoirs have additional electrical conductivity from irreducible water, showing a black or alternating black-and-white porphyritic texture in imaging logs, with local development of sediment beddings.
2. T2 spectrum of nuclear magnetic logs. Sedimentary volcanic nonreservoirs usually have a unimodal or asymmetrically bimodal pattern. T2 distributes in a small range, with a small average value. Their mobile fluid peak amplitudes are small.
3. Conventional logs. Sedimentary volcanic nonreservoirs usually show the characteristics of low Rt, low DEN (high DEN in XX gas filed), high AC, and high CN, with curves being serrated bell, funnel, and finger shaped.
2 Qualitative identification of volcanic reservoirs
Qualitative assessment of reservoir effectiveness and reservoir classification can be conducted based on the established identification markers, together with identified lithology and lithofacies, by integrating with acoustic and resistivity imaging logs, nuclear magnetic and conventional logs, and by means of imaging analysis, the correlation of free peak amplitude of the T2 spectrum and the analysis of conventional log response characteristics. The identification process is as follows.
1) Combining characteristics of lithology and lithofacies to qualitatively identify volcanic nonreservoirs
According to the identification markers (see Table 9.1), two types of nonreservoir volcanic rocks usually show two extremes in well logs: the dry mud layer images are dark colored (dark red to black), with a large irreducible fluid spectrum amplitude in the nuclear magnetic log, characterized by low Rt, low DEN (partly high DEN), high AC, and high CN in conventional logs; on the contrary, dry tight layer images are light colored (bright yellow to white), with a small irreducible fluid spectrum amplitude in nuclear magnetic logs, marked by high Rt, high DEN, low AC, and low CN in conventional logs. The common feature of these two types of dry layers is their small mobile fluid peak amplitudes. Thus, volcanic nonreservoirs can be effectively identified by integrating the characteristics of lithology and lithofacies and using various log data.
Sedimentary volcanic nonreservoirs
Intervals 3860 to 3876 m in Well XX901 are located on the top of a volcanic massif, lithologically dominated by pyromeride and mixed with mudstone (Figure 9.2). Full-bore micro scanner imager (FMI) imaging logs show an alternating black-and-white porphyritic texture. The T2 amplitude in the irreducible fluid spectrum of nuclear magnetic logs is large and lacks a mobile fluid peak. The conventional logs have a serrated finger or bell shape; the rock density is in the range of 2.58 to 2.7 g/cm3, with a high average value of 2.62 g/cm3; AC is in the range of 58 to 75 μs/ft with an average of 66 μs/ft, which is also high. The CN values are similarly high, with a range of 10% to 19% and an average of 14%; LLD is in the range of 15 to 40 Ω·m with an average of 25 Ω·m, which is a low value; and the P-S (compressive-shear wave) velocity ratio is in the range of 1.7 to 2 with an average of 1.8, which is a high value. These results show that most volcanic pore fluid in this interval is irreducible with low gas content, which is typical of a dry mud layer.

Tight volcanic nonreservoirs
The lithology in the 3800 to 3840 m interval of Well XX8 is dacite, representing the medium subfacies of the effusive facies (Figure 9.3). FMI imaging logs show a bright yellow blocky texture. The T2 spectrum pattern of nuclear magnetic logs is not obvious, without an irreducible fluid peak and mobile fluid peak. The conventional logs have a smooth box shape, and rock density values are high, ranging from 2.52 to 2.59 g/cm3 with an average of 2.56 g/cm3; AC ranges from 49 to 53 μs/ft with an average of 51 μs/ft (low value); CN values are − 1.3% to 0.7% with an average of 0.02% (low value); LLD ranges from 6428 to 104989 Ω·m with an average of 69312 Ω·m (high value). These results demonstrate poor petrophysical properties for the volcanic rock in this interval, which is a tight volcanic nonreservoir.

2) Distinguishing fractured reservoirs in tight volcanic rocks based on fracture identification
The major difference between fractured volcanic reservoirs and tight nonreservoirs lies in whether various fractures are developed. Thus, fractured reservoirs can be recognized within tight volcanic rocks through fracture identification.
The lithology in the 3644 to 3664 m interval of Well DD17 is basalt, representing the medium subfacies of the effusive facies (Figure 9.4). Fractures are observed in cores, resulting in core breakdown. FMI imaging logs show a red-yellow blocky texture with netlike black sine lines of various configurations, which indicates the development of fractures. The T2 spectrum of nuclear magnetic logs has a bimodal pattern with a wide T2 distribution range, relatively small irreducible fluid peak, and mobile fluid peak. The conventional logs have a weakly denticulate box shape, with rock density of 2.69 to 2.87 g/cm3 and an average of 2.79 g/cm3 (high value); AC ranges from 56 to 65 μs/ft with an average of 58 μs/ft (medium to low value); CN ranges from 15% to 23% with an average of 17% (medium to high value; high DEN and high CN are characteristics of basic volcanic rock); LLD ranges from 40 to 66 Ω·m with an average of 48 Ω·m (relatively high value for Well Block DD17). The average effective matrix porosity interpreted from well logs is 0.4%, below the reservoir cutoff; fracture porosity is 0.5%, which is of medium to high value. These results show that the volcanic matrix in this interval has poor properties and developed fractures, which are the main reservoir spaces and fluid flow channels, and as such it can be characterized as a typical fractured reservoir.

3) Assessing reservoir effectiveness by type and identifying effective volcanic reservoirs comprehensively
Reservoir effectiveness is assessed by type, based on the characteristic markers (see Table 9.1), and integration with core, thin-section, and log data.
Vesicular reservoirs
Volcanic vesicular reservoirs are marked by developed vesicles of different sizes. The lithology in the 3894 to 3958 m interval of Well XX23 is rhyolite, representing the top subfacies and upper subfacies of the effusive facies. Vesicles are developed in cores, with sizes ranging from 0.2 × 0.2 cm to 2 × 3 cm (the 11th track in Figure 9.5), which are the main reservoir spaces.

FMI imaging logs in this interval show a yellow blocky texture, with black spots of variable sizes and smooth and clear margins, and a vesicular structure (the 10th track in Figure 9.5). In the T2 spectrum of nuclear magnetic logs, there are two to four spectral peaks, with a wide T2 distribution range for each spectrum peak and a large average value; its mobile fluid peak shows a medium to high amplitude, which indicates the development of vesicles (the 9th track in Figure 9.5). The conventional logs have a weakly denticulate box shape. Rock density is 2.27 to 2.58 g/cm3 with an average of 2.41 g/cm3 (medium to low value); AC ranges from 52.8 to 67.8 μs/ft with an average of 58.6 μs/ft (medium to high value); CN ranges from 1.82% to 5.62% with an average of 3.47% (medium to low value); the P-S velocity ratio ranges from 1.54 to 1.74 with an average of 1.64 (medium to low value); and LLD ranges from 270 to 3722 Ω·m with an average of 1165 Ω·m (medium to high value; refer to the 6th to 8th tracks in Figure 9.5). These results show that this interval belongs to typical vesicular reservoirs, with medium physical properties and relatively good reservoir effectiveness.
After gas testing in intervals of 3909 to 3814 m and 3939 to 3943 m in this well, gas and water flew naturally after fracturing, with gas production of 27.86 × 10⁴ m3/d, liquid production of 14.4 m3/d, and a fracturing fluid flow-back rate of 46.4%. Gas-testing results indicate that these intervals are commercial gas zones, further proving that the 3854 to 3958 m interval in Well XX23 is a typical effective vesicular reservoir.
Intergranular pore reservoirs
Intergranular pore reservoirs are marked by the development of intergranular pores during volcanic eruption and accumulation. The 3714 to 3735 m interval of Well CC1-1 consists of rhyolitic breccia, representing the fallout subfacies of the explosive facies. There is an apparent volcanic breccia texture in cores, with mainly irregular interbreccia pores in cast thin section (the 11th track in Figure 9.6).

The FMI imaging logs for this interval show a light yellow porphyritic texture, among which the angular bright patches are volcanic breccia with poor conductivity; the irregular black patches are volcanic breccia with interbreccia pores developed, showing a high conductivity; and black spots are intergranular pores in coarse-grained tuff (the 10th track in Figure 9.6). In the T2 spectrum of nuclear magnetic logs, this interval shows a bimodal pattern, with a large T2 distribution range for each of the peaks and a medium average value; its mobile fluid peak amplitude is medium to high, indicating the development of intergranular pores (the 9th track in Figure 9.6). The conventional logs are in dentoid funnel and bell shapes, with rock density of 2.28 to 2.53 g/cm3 and an average of 2.39 g/cm3 (low value); AC ranges from 56.7 to 72.7 μs/ft with an average of 65.2 μs/ft (medium to high value); CN ranges from 3.6% to 14.9% with an average of 8.8% (medium to high value); and LLD ranges from 20 to 162 Ω·m with an average of 65 Ω·m (medium to low value; refer to the 6th to 8th tracks in Figure 9.6). The integrated analysis shows that this interval is typical of intergranular pore reservoirs, with good petrophysical properties and reservoir effectiveness.
Dissolution-pore reservoirs
Volcanic dissolution-pore reservoirs are formed by weathering and leaching as well as dissolution by acid water and meteoric water during late diagenesis, resulting in good petrophysical properties and connectivity. The lithology in the 3704 to 3740 m interval of Well XX8 is rhyolite breccias lava, representing the volcanic neck subfacies of the volcanic conduit facies. In cores, there are irregular volcanic breccias cemented by magma without clear margins, and various dissolution pores are developed. In cast thin section, pores show an irregular embayed shape with a high degree of development and connectivity (the 10th track in Figure 9.7).

FMI imaging logs in this interval show a dark red porphyritic texture; the light yellow to red patches are welded breccia of low electrical conductivity, and the irregular black strips are dissolution zones (the 9th track in Figure 9.7). In the T2 spectrum of nuclear magnetic logs, this interval shows an asymmetrically bimodal pattern, with a continuous T2 distribution for each peak, and a medium distribution range and average value; their mobile fluid peak amplitudes are high (the 8th track in Figure 9.7). The conventional logs have a smooth box shape, with rock density of 2.25 to 2.46 g/cm3 and an average of 2.33 g/cm3 (low value); AC ranges from 65 to 82 μs/ft with an average of 72 μs/ft (high value); CN ranges from 8.8% to 18.2% with an average of 14.7% (medium to high value); and LLD ranges from 24 to 63 Ω·m with an average of 39 Ω·m (low value; refer to the 6th and 7th tracks in Figure 9.7). Integrated analysis shows that this interval is typical of dissolution-pore reservoirs, with good petrophysical and good gas-bearing properties.
Gas testing was conducted for the 3723 to 3735 m interval of Well XX8 by adopting Multi-Flow Evaluator (MFEII) + Tubing Conveyed Perforating (TCP), with a 10-mm choke; it produced a natural gas flow of 22.62 × 10⁴ m3/d (containing 23% CO2), thus confirming a commercial gas zone.
9.2.2 Quantitative identification of effective reservoirs
On the basis of gas well deliverability, the cutoff criteria and classification and evaluation criteria of effective volcanic reservoirs are established by means of crossplot analysis and empirical statistic analysis. These criteria also facilitate the quantitative identification of various effective volcanic reservoirs using the results of fracture identification, reservoir parameter interpretation, and delineation of gas layers and aquifers.
1 Establishing cutoff criteria for effective reservoirs
The reservoir effectiveness depends mainly on lithological, petrophysical, and gas-bearing properties. The cutoff thresholds of petrophysical, electrical, and gas-bearing properties of effective volcanic reservoirs can be reasonably determined based on formation test results by integrating static data with dynamic data (such as geology, well logging, gas testing, and pilot production data) and using several analytical techniques.
1) Defining the cutoff thresholds of pore-throat radius and petrophysical properties according to water film thickness
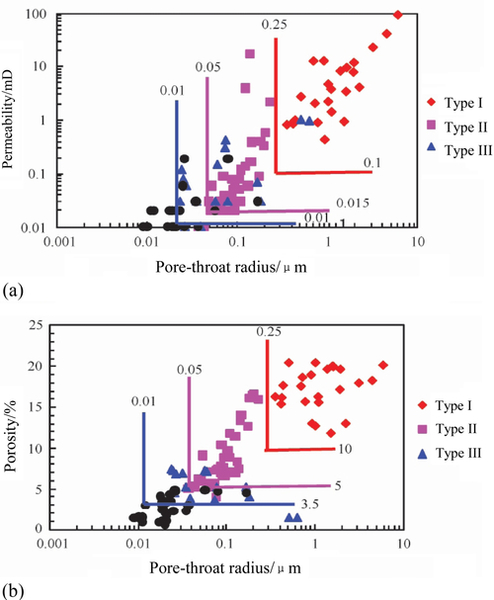
The irreducible water film thickness experiment and the empirical equation are combined to define the irreducible water film thickness (about 0.01 m) of volcanic reservoirs. The cutoff of the pore-throat radius is defined by adding half of the diameter of a gas molecule (about 0.0005 m) to irreducible water film thickness, which is about 0.0105 m (taking 0.01 m). Based on this cutoff, the crossplot of core permeability versus pore-throat radius and crossplot of core permeability versus effective porosity are plotted with mercury injection test data, and the cutoffs of matrix permeability and effective porosity are determined according to the cutoff of the pore-throat radius.
The example in Figure 9.8 uses water film thickness to define the cutoffs of volcanic pore-throat radius and petrophysical properties in the XX gas field. The figure implies that (1) the volcanic rock permeability has a positive correlation with the pore-throat radius, with a correlation coefficient of 0.91 (Figure 9.8a); at the 0.01-μm cutoff of the pore-throat radius, the cutoff of the matrix permeability is 0.01 mD; and (2) the volcanic matrix permeability has a positive correlation with effective matrix porosity, with a correlation coefficient of 0.84 (Figure 9.8b); at the 0.01-mD cutoff of matrix porosity, the cutoff of effective matrix porosity is 3.5%.

2) Defining cutoffs of reservoir petrophysical properties and electric properties using the deliverability test method
On the basis of effective volcanic reservoirs and nonreservoirs defined by deliverability tests, the cutoff values of petrophysical and electrical properties of effective volcanic reservoirs can be determined from the correlation charts of gas well deliverability versus physical properties (porosity and permeability) and electrical properties (acoustic travel time and rock density).
Figure 9.9 shows how the deliverability test method is used to define cutoffs of the petrophysical and electrical properties of effective volcanic reservoirs in the CC gas field. The main lithology of the CC gas field consists of acidic volcanic rocks. The crossplots of permeability versus porosity and acoustic travel time versus rock density in this gas-testing interval are established based on the gas layer, water layer, and dry layer determined by gas-testing data. The correlations indicate that (1) the volcanic gas layer deliverability has a positive correlation with petrophysical properties. Being at borderline gas producibility, the cutoffs of effective reservoir petrophysical properties are defined by a permeability of 0.03 mD and a porosity of 3.5%; and (2) the volcanic gas layer deliverability is positively correlated with AC but inversely correlated with DEN. Based on this, the cutoffs of electrical properties in this gas field are defined by a DEN value of 2.57 g/cm3 and an AC value of 55 μs/ft.

3) Defining cutoff thresholds of reservoir petrophysical properties using empirical statistic analysis
Experimental porosity and permeability data from core analysis provide an important basis for plotting the histograms, cumulative frequency curve of porosity and permeability, cumulative frequency curve of accumulation potential (equal to the product of porosity and thickness), and cumulative frequency curve of deliverability (equal to the product of permeability and thickness). Based on the results of previous local studies, the percentages of effective reservoir thickness, accumulation potential, and deliverability that may have been lost during the development conditions are defined to confirm the cutoff thresholds of effective reservoir petrophysical properties [2].
Figure 9.10 uses the method of empirical statistic analysis to define the cutoffs of the petrophysical properties of volcanic lava in the DD gas field. Figure 9.10a shows the histogram of porosity distribution, cumulative frequency curve of porosity, and cumulative frequency curve of accumulation potential. Figure 9.10b shows the crossplot of porosity versus permeability at different levels of mercury intrusion saturation. According to the experience of the DD gas field, limited by 10% of accumulation potential loss and 40% of mercury intrusion saturation, the cutoffs of petrophysical properties of effective reservoirs in volcanic lava are set at a porosity value of 6.5% and a permeability value of 0.02 mD.

4) Defining cutoff values of gas-bearing property with multiple approaches
Deliverability test method
The cutoff values for the resistivity and saturation of effective volcanic reservoirs are determined on the basis of effective volcanic reservoirs and noneffective reservoirs defined by employing the deliverability test, applying the crossplot analysis technique, analyzing the logging response feature, and interpreting the saturation logs.
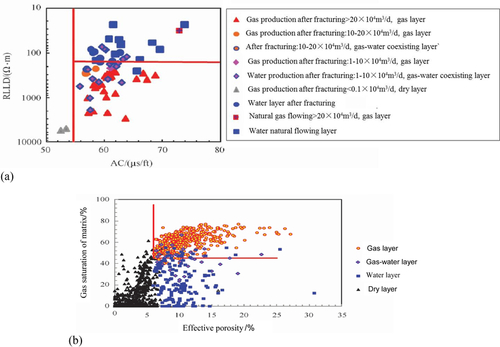
Figure 9.11 shows how the deliverability test is used to define the cutoff values of resistivity and gas saturation of the gas layer in the CC gas field. Figure 9.11a shows the crossplot of recorded laterolog deep (RLLD) versus AC in the gas-testing interval of this gas field. Figure 9.11b shows the crossplot of gas saturation versus effective porosity in the gas-testing interval of this gas field. These analyses suggest that the resistivity cutoff of the volcanic gas layer in the CC gas field is 50 Ω·m and the gas saturation cutoff is 45%.
Mercury intrusion method
On the basis of the porosity cutoff value and using mercury intrusion analysis data, the gas saturation cutoff of a gas layer can be defined by analyzing the relationship between mercury intrusion saturation and porosity [1].
In Figure 9.12, the mercury intrusion analysis is used to define the gas saturation cutoff of volcanic lava in the DD gas field. The crossplot of maximum mercury intrusion saturation versus porosity suggests that the initial gas saturation of volcanic reservoirs has a positive correlation with effective porosity. The gas saturation cutoff of volcanic lava in this gas field is defined at 40%, based on the changing trend and porosity cutoff of 6.5%.

2 Establishing classification criteria of effective reservoirs
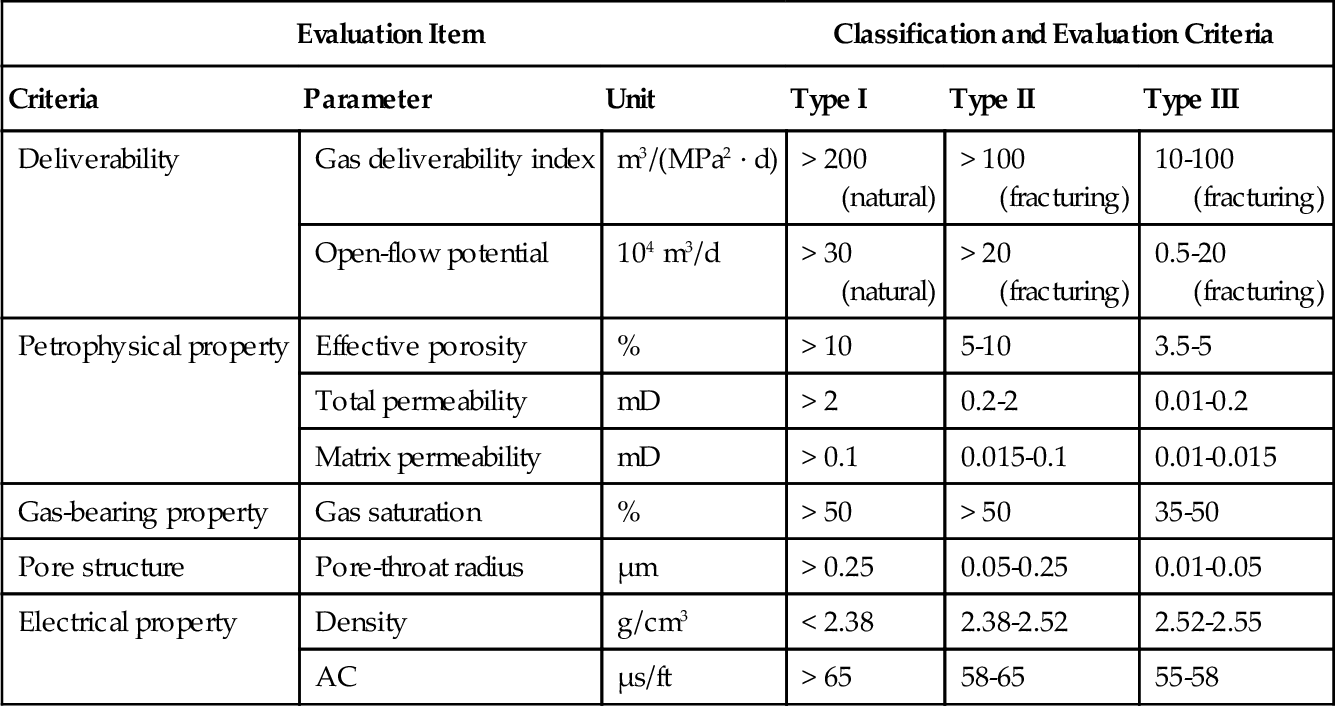
Effective volcanic reservoirs are controlled by many factors and have diverse petrophysical properties. Commercial standards for classifying and evaluating effective volcanic gas reservoirs were not set up until now. In view of the complexity of volcanic gas reservoirs and the classification criteria for other oil and gas reservoirs [3–6], the classification and evaluation criteria for effective volcanic gas reservoirs (Table 9.2) are proposed here for the first time on the basis of gas well deliverability confirmed by formation tests and the data of core experiments, well logging, and reservoir parameter interpretation. Three types of effective volcanic reservoirs are recognized.
Table 9.2
Classification and Evaluation Criteria for Volcanic Reservoirs in the XX Gas Field
| Evaluation Item | Classification and Evaluation Criteria | ||||
| Criteria | Parameter | Unit | Type I | Type II | Type III |
| Deliverability | Gas deliverability index | m3/(MPa2 · d) | > 200 (natural) | > 100 (fracturing) | 10-100 (fracturing) |
| Open-flow potential | 104 m3/d | > 30 (natural) | > 20 (fracturing) | 0.5-20 (fracturing) | |
| Petrophysical property | Effective porosity | % | > 10 | 5-10 | 3.5-5 |
| Total permeability | mD | > 2 | 0.2-2 | 0.01-0.2 | |
| Matrix permeability | mD | > 0.1 | 0.015-0.1 | 0.01-0.015 | |
| Gas-bearing property | Gas saturation | % | > 50 | > 50 | 35-50 |
| Pore structure | Pore-throat radius | μm | > 0.25 | 0.05-0.25 | 0.01-0.05 |
| Electrical property | Density | g/cm3 | < 2.38 | 2.38-2.52 | 2.52-2.55 |
| AC | μs/ft | > 65 | 58-65 | 55-58 | |
1) Deliverability and petrophysical property criteria
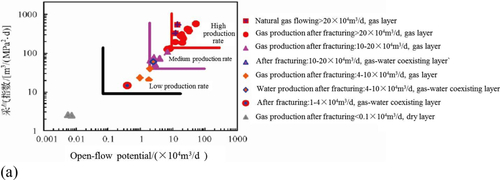
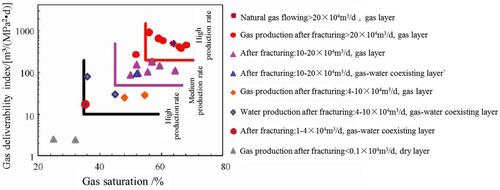
The deliverability of volcanic gas reservoirs has a positive correlation with reservoir petrophysical properties and well-controlled reserves. According to the levels of deliverability fracture development, gas layer deliverability is qualitatively classified into three types: naturally high deliverability, high deliverability after fracturing, and medium to low deliverability after fracturing. This division scheme corresponds to three types of reservoirs. On this basis, the deliverability and petrophysical property criteria for reservoir classification are set up by analyzing the relationship between gas layer deliverability and petrophysics. This is discussed here using the XX gas field as an example (Figure 9.13).

Deliverability criteria
The gas deliverability index has a positive correlation with the gas layer open-flow potential of the gas-testing interval (Figure 9.13a). In accordance with the gas-testing results, the classification criteria of the gas-testing deliverability level are set up as follows (see Table 9.2):
High-deliverability gas layer: open-flow potential > 30 × 104 m3/d, gas deliverability index > 200 m3/(MPa2·d)
Medium-deliverability gas layer: open-flow potential 8 to 30 × 104 m3/d, gas deliverability index 50 to 200 m3/(MPa2·d)
Low-deliverability gas layer: open-flow potential 0.5 to 8 × 10⁴ m3/d, gas deliverability index 10 to 50 m3/(MPa2·d)
Gas deliverability index and permeability criteria
The gas deliverability index has a positive correlation with reservoir permeability (Figure 9.13b). The criteria for the gas deliverability index and permeability are established for three types of gas reservoirs—according to the gas-testing characteristics of naturally high deliverability, high deliverability after fracturing, and medium to low deliverability after fracturing—by analyzing the relationship between the gas deliverability index and permeability (see Table 9.2):
Type I reservoirs: gas deliverability index > 200 m3/(MPa2·d), permeability > 2 mD
Type II reservoirs: gas deliverability index > 100 m3/(MPa2·d), permeability > 0.2 to 2 mD
Type III reservoirs: gas deliverability index 10 to 100 m3/(MPa2·d), permeability 0.01 to 0.2 mD
Effective porosity criteria
Reservoir permeability is positively related to effective porosity (Figure 9.13c). The effective porosity values are established for three types of reservoirs according to the gas-testing deliverability characteristics and reservoir permeability classification as determined by an analysis of the relationships between reservoir permeability and effective porosity (see Table 9.2):
Type I reservoirs: effective porosity > 10%
Type II reservoirs: effective porosity 5% to 10%
Type III reservoirs: effective porosity 3.5% to 5%
Matrix permeability criteria
Volcanic matrix permeability has a positive correlation with effective matrix porosity (Figure 9.13d). According to effective porosity criteria, the matrix permeability criteria for three types of reservoirs are set up based on the relationships between matrix permeability and effective porosity (see Table 9.2):
Type I reservoirs: matrix permeability > 0.1mD
Type II reservoirs: matrix permeability 0.015 to 0.1mD
Type III reservoirs: matrix permeability 0.01 to 0.015 mD
2) Electrical property criteria
Logging response characteristics of volcanic reservoirs are affected by their petrophysical properties, and there are good correlations among them: DEN decreases and AC increases with better petrophysical properties. On the basis of effective porosity criteria, therefore, the electrical property criteria for effective volcanic reservoirs are established through analysis of the relationships between core porosity and logging (Figure 9.14 and Table 9.2):
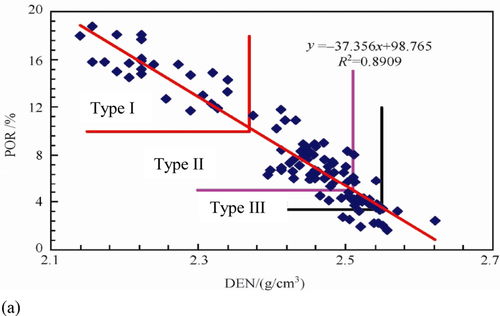

Type I reservoirs: DEN < 2.38 g/cm3, AC > 65 μs/ft
Type II reservoirs: DEN 2.38 to 2.52 g/cm3, AC 58 to 65 μs/ft
Type III reservoirs: DEN 2.52 to 2.55 g/cm3, AC 55 to 58 μs/ft
3) Pore structure criteria
The pore structure parameter criteria for identifying effective reservoirs are set up based on the classification scheme of matrix permeability and effective porosity, using mercury injection data as well as the relationships among porosity, permeability, and pore-throat radius. The classification scheme of pore-throat radius for effective reservoirs of the XX gas field are as follows (Figure 9.15 and Table 9.2):
Type I reservoirs: pore-throat radius > 0.25 μm
Type II reservoirs: pore-throat radius 0.05 to 0.25 μm
Type III reservoirs: pore-throat radius 0.01 to 0.05 μm
4) Gas-bearing property criteria
According to the gas-testing deliverability, the correlation between gas deliverability index and gas saturation is set up (Figure 9.16). Based on the gas deliverability indices, the saturation classification schemes for the gas layers in the XX gas field are defined as follows (see Table 9.2):
High-deliverability gas layer: gas saturation > 55%
Medium-deliverability gas layer: gas saturation 45% to 55%
Low-deliverability gas layer: gas saturation 35% to 45%
5) Criteria regarding lithology, lithofacies, and pore structures
According to these criteria, effective volcanic reservoirs are classified systematically through logging response analysis and reservoir parameter interpretation. This allows the establishment of a set of criteria in terms of lithology, lithofacies, and pore structures for the three types of effective reservoirs by combining statistical analysis with the geological characteristics of volcanic gas reservoirs (Table 9.3).
Table 9.3
Systematic Classification for Volcanic Reservoirs
| Reservoir Type | Petrophysical Property | Lithology and Lithofacies Characteristics | Pore Structure Feature | Deliverability | ||
| Volcanic Lithofacies | Rock Types | Accumulation-Permeation Combination | Pore Structure | |||
| Type I | Good | Splash subfacies of explosive facies; top subfacies of effusive facies; volcanic neck subfacies of volcanic conduit facies | Breccia lava, vesicular rhyolite, autoclastic brecciated lava | Dissolved pore + vesicle + fracture; intergranular dissolved pore + micropore + fracture | Type I | Mainly natural high production |
| Type II | Medium | Hot clastic flow subfacies of explosive facies; upper subfacies of effusive facies; outerzone subfacies of subvolcanic facies | Welded tuff, crystalline tuff, vesicular rhyolite, orthophyre | Dissolved pore + vesicle + fracture; intergranular dissolved pore + micropore + fracture; vesicle + fracture; micropore + fracture | Mainly type II, a few type I and type III | Mainly high production after fracturing |
| Type III | Poor | Hot clastic flow subfacies and hot base surge subfacies of explosive facies; middle and lower subfacies of effusive facies; mesozone subfacies of subvolcanic facies | Welded tuff, crystalline tuff, welded breccia, vesicular rhyolite, orthophyre | Vesicle + fracture; micropore + fracture | Mainly type II and type III, a few type IV | Medium to low production after fracturing |

3 Quantitative identification of effective volcanic reservoirs
Various types of effective volcanic reservoirs can be identified quantitatively in accordance with the reservoir cutoff criteria and classification scheme discussed earlier, using core, experimental, and log data as well as reservoir parameter interpretation results.
1) Type I effective reservoirs
Type I effective reservoirs are developed in favorable facies belts, such as the splash subfacies of the explosive facies, the top subfacies of the effusive facies, and the volcanic neck subfacies of the volcanic conduit facies, lithologically dominated by brecciated lava and vesicular rhyolite. They have a reasonably good pore-fracture combination, with common type I pore structure, good petrophysical properties, good electrical property, and high natural deliverability (see Table 9.3). Their details include (see Table 9.2) (1) effective porosity > 10%, permeability > 2 mD, and matrix permeability > 0.1 mD; (2) gas saturation > 55%; (3) DEN < 2.38 g/cm3 and AC > 65 μs/ft; (4) pore-throat radius > 0.25 μm; and (5) open-flow potential > 30 × 104 m3/d with a gas deliverability index of > 200 m3/(MPa2·d).
Layer 182 II (3717 to 3735 m) in Well CC103 is an example of a type I effective reservoir (Figure 9.17). The interval consists of rhyolite and autoclastic brecciated lava. The main characteristics include (1) broken cores, with a pore structure of type I in the mercury injection curve and a pore-throat radius of 0.82 μm, which is larger than the cutoff of type I; (2) effective porosity 10% to 25.9% with an average of 16.3%; permeability 1.6 to 251 mD with an average of 46.7 mD; matrix permeability 0.13 to 2.71 mD with an average of 0.63 mD, all higher than cutoff of type I; (3) gas saturation 65% to 80% with an average of 73%, higher than the gas saturation cutoff of type I; (4) DEN 2.20 to 2.49 g/cm3 with an average of 2.32 g/cm3, lower than the cutoff of type I; AC 57 to 88 μs/ft, with an average of 67 μs/ft, higher than cutoff of type I; and (5) the mobile fluid peak amplitude in the T2 spectrum of nuclear magnetic logs is higher, showing a red-black porphyritic texture in FMI imaging logs and developed fractures. This interval is interpreted as a type I effective reservoir.

The test of this interval together with interval 3632 to 3648 m produced the following results: the gas production in MFE natural flowing is 51.3 × 10⁴ m3/d; the production pressure differential is about 15.6 MPa, indicating a natural high-production gas layer for this interval; and the open-flow potential is 74.5 × 10⁴ m3/d, with a gas deliverability index of 652.7 m3/(MPa2·d), as typical of a type I gas layer.
2) Type II effective reservoirs
Type II effective reservoirs are developed in the upper subfacies of the effusive facies, the hot clastic flow subfacies of the explosive facies, and the outerzone subfacies of the subvolcanic facies, lithologically dominated by welded tuff, rhyolite, and orthophyre. They have the characteristics of good pore-fracture combination, with mainly type II pore structure, moderate petrophysical properties, moderate electrical properties, and high natural deliverability after fracturing (see Table 9.3). Their details include (see Table 9.2) (1) effective porosity 5% to 10%, permeability 0.2 to 2 mD, and matrix permeability 0.015 to 0.1 mD; (2) gas saturation 45% to 55%; (3) DEN 2.38 to 2.52 g/cm3, AC 58 to 65 μs/ft; (4) pore-throat radius 0.05 to 0.25 μm; and (5) after fracturing, open-flow potential > 20 × 104 m3/d and gas deliverability index > 100 m3/(MPa2·d).
Layer 257 I (3887 to 3914 m) in Well XX901 is an example of type II effective reservoir (Figure 9.18), lithologically consisting of rhyolite. The characteristics (including petrophysical properties, electric properties, and gas bearing property) are all between the cutoff values for type II and type I: (1) vesicular rhyolitic structure and factures are developed in cores, without mercury injection data; (2) effective porosity is 4.7% to 8.2%, average 6.6%; permeability 0.2 to 3.3 mD, average 1.1 mD; and matrix permeability 0.01 to 0.05 mD, average 0.03 mD; (3) gas saturation is 41% to 72%, average 61%; (4) DEN is 2.36 to 2.51 g/cm3, average 2.46 g/cm3; AC is 56 to 63 μs/ft, average 59 μs/ft; and (5) the mobile fluid peak amplitude in the T2 spectrum of the nuclear magnetic log is medium, showing yellow-red porphyritic texture in the FMI imaging log and developing rhyolitic structure and fractures. This interval is interpreted generally as a type II effective reservoir.

Gas-testing results show that the gas-testing deliverability after fracturing is 38.2 4 × 10⁴ m3/d; the production pressure differential is about 8.61 MPa, which is a high gas deliverability layer after fracturing; the open-flow potential is 88.2 × 10⁴ m3/d, with a gas deliverability index of 593.6 m3/(MPa2·d), indicating a typical type II gas layer.
3) Type III effective reservoirs
Type III effective reservoirs are developed in the upper subfacies and the lower subfacies of effusive facies, the hot clastic flow subfacies and hot base surge subfacies of the explosive facies, and the mesozone subfacies of the subvolcanic facies, lithologically dominated by welded tuff, crystal tuff, welded breccia, volcanic lava, and orthophyre. They are characterized by a poor pore-fracture combination, mainly type II and type III pore structures, and a minor type IV pore structure; poor physical properties and moderate electric properties; and moderate to low deliverability after fracturing (see Table 9.3). The details include (see Table 9.2) (1) effective porosity 3.5% to 5%, permeability 0.01 to 0.2 mD, and matrix permeability 0.01 to 0.015 mD; (2) gas saturation 35% to 50%; (3) DEN 2.52 to 2.55 g/cm3, AC 55 to 58 μs/ft; (4) pore-throat radius 0.01 to 0.05 μm; and (5) open-flow potential after fracturing 0.5 to 20 × 104 m3/d and a gas deliverability index of 10 to 100 m3/(MPa2·d).
Layer 161 I (3686 to 3798 m) in Well XX9-2 is an example of a type III effective reservoir (Figure 9.19), lithologically represented by rhyolite. The characteristics (including petrophysical properties, electrical properties, and gas bearing property) are (1) effective porosity 3.1% to 7%, average 4.8%; permeability 0.02 to 1.66 mD, average 0.38 mD; and matrix permeability 0.01 to 0.03 mD, average 0.02 mD; (2) gas saturation 38% to 81%, average 63%; and (3) DEN 2.45 to 2.57 g/cm3, average 2.52 g/cm3; AC 52.8 to 62 μs/ft, average 55.6 μs/ft; and resistivity 719 to 10946 Ω·m, average 4163 Ω·m. This interval is generally interpreted as a type III effective reservoir.

Gas-testing production on natural deliverability in this interval is 0.011 × 10⁴ m3/d; production after fracturing is 12.8 × 10⁴ m3/d; the open-flow potential is 13.85 × 10⁴ m3/d; and the gas deliverability index is 92.44 × 10⁴ m3/(MPa2·d). These data are typical of a type III gas layer.
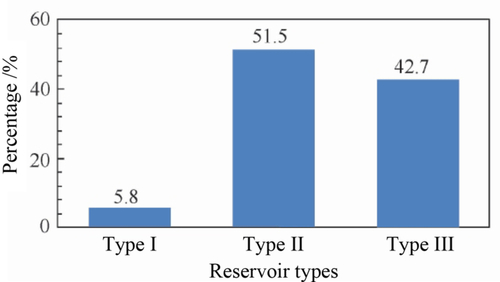
4 Developmental features of effective volcanic reservoirs
The developmental features of different types of effective volcanic reservoirs are basically clarified by quantitative identification. Figure 9.20 shows the classification and evaluation results of Well Block XX9. This figure implies that the main effective volcanic reservoirs in this well block are type II (about 51.5%); type III comes in second (at about 42.7%); and type I develops locally (about 5.8%). This indicates generally poor petrophysical properties for these effective volcanic reservoirs.
9.3 Prediction of effective volcanic reservoirs
Based on well identification and seismic-well calibration, seismic classification criteria of effective volcanic reservoirs are set up by analyzing seismic response characteristics. The spatial distribution patterns of various effective reservoir types can be predicted by “body-controlling” reservoir inversion, which forms the basis for optimizing well locations, designing horizontal well trajectories, and improving the success rate of reservoir wells.
9.3.1 Seismic response characteristics of effective volcanic reservoirs
Different types of volcanic reservoirs have different seismic response characteristics. The criteria for effective reservoirs are established by calibrating seismic data against well data, analyzing response characteristics of near-wellbore seismic traces, and distilling sensitive seismic attributes, which lays a foundation for the classification and predication of effective volcanic reservoirs.
1 Seismic response characteristics of effective volcanic reservoirs
After calibrating seismic data against well identification results and analyzing reflection characteristics of near-wellbore seismic traces, the seismic facies are classified for the qualitative prediction of effective volcanic reservoirs. As is shown in the case studies of Well Blocks XX8 and XX9, four types of typical volcanic seismic response characteristics are recognized based on the differences in accumulation and permeation capacity of reservoirs (Figure 9.21).
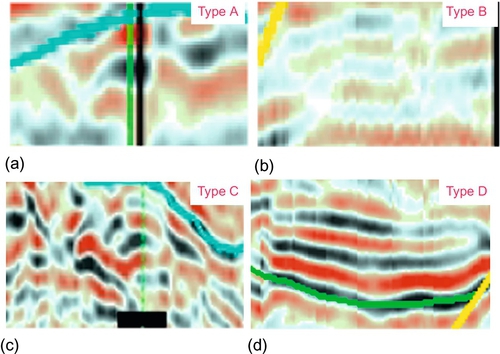
1) Seismic response characteristics: Type A
In this reservoir type, the internal reflection is characterized by medium to low frequency, medium to weak amplitude, poor continuity, and a chaotic reflection shape, developed mainly in explosive facies. The typical intervals have an average porosity of 5.22% and an average permeability of 2.9 mD; the fractures are well developed, with an average fracture width of 19 μm, an average fracture density of 2.54 fractures/m, and an average fracture surface porosity of 0.07%. These represent the best petrophysical properties.
2) Seismic response characteristics: Type B
The seismic reflection of type B is characterized by medium to low frequency, medium to weak amplitude, good continuity, and a laminar reflection shape, developed mainly in mixed facies (volcanic lava, etc.). The typical intervals have an average porosity of 3.9% and an average permeability of 0.43 mD; both structural fractures and microfractures are well developed, with an average fracture width of 11.13 μm, an average fracture density of 2.66 fractures/m, and an average fracture surface porosity of 0.05%. These are good petrophysical properties.
3) Seismic response characteristics: Type C
A type C seismic reflection is characterized by medium to high frequency, medium to strong amplitude, poor continuity, and a chaotic reflection shape, developed mainly in mixed facies of alternating volcanic lava and volcaniclastic rocks. In the typical intervals, the average porosity is 3.79%, and average permeability is 0.2 mD; both structural fractures and microfractures are well developed, with an average fracture width of 15.32 μm, an average fracture density of 3.18 fractures/m, and an average fracture surface porosity of 0.04%. These are poor petrophysical properties.
4) Seismic response characteristics: Type D
A type D seismic reflection is characterized by medium to high frequency, strong amplitude, relatively good continuity, and a laminar reflection shape, developed mainly in effusive facies. The typical intervals have an average porosity of 3.61% and an average permeability of 0.2 mD; fractures are developed mainly as microfractures, with an average fracture width of 8.10 μm, an average fracture density of 3.09 fractures/m, and an average fracture surface porosity of 0.042%. These are the least favorable petrophysical properties.
2 Seismic parameter sensitivity analysis of effective reservoirs
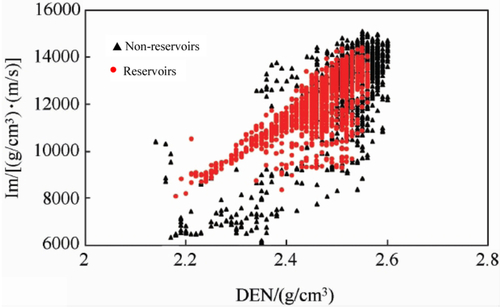
Effective porosity is closely related to rock density in volcanic reservoirs (Figure 9.22). Acoustic impedance is the product of rock density and acoustic velocity and is also closely related to rock porosity and rock density. Therefore, rock density, acoustic velocity, and acoustic impedance are the sensitivity parameters of effective volcanic reservoirs.

These relationships are shown using the CC gas field as an example. The crossplot of acoustic impedance versus well log density is established based on the results of well interpretation and the analysis of response characteristics of near-wellbore seismic traces after seismic data calibration with well log data (Figure 9.23). Figure 9.23 demonstrates that the main characteristics of effective volcanic reservoirs include low density (2.28 to 2.57 g/cm3) and low acoustic impedance [9500 to 14500 (g/cm3)·(m/s)].
3 Seismic classification criteria for effective volcanic reservoirs
The seismic classification criteria for effective volcanic reservoirs are set up based on the classification scheme of effective volcanic reservoir zones, using acoustic impedance, porosity, density, and acoustic data that are extracted from near-wellbore seismic traces, through bivariant crossplot analysis (Figures 9.24 and 9.25). This is shown using the CC gas field as an example:


Type I effective reservoirs: porosity > 10%, density < 2.47 g/cm3, AC > 62 μs/ft, and acoustic impedance 9500 to 12200 (g/cm3)·(m/s)
Type II effective reservoirs: porosity 6% to 10%, density 2.47 to 2.53 g/cm3, AC 58 to 62 μs/ft, and acoustic impedance 12200 to 13600 (g/cm3)·(m/s)
Type III effective reservoirs: porosity 3.5% to 6%, density 2.53 to 2.57 g/cm3, AC 55 to 58 μs/ft, and acoustic impedance 13600 to 14500 (g/cm3)·(m/s)
9.3.2 Classification and prediction techniques for effective volcanic reservoirs
Volcanic rock has multilevel internal structures (architectures), thus conventional reservoir inversion techniques cannot be applied to the complex geological characteristics and associated changes in volcanic gas reservoirs. Guided by the distribution models of effective volcanic reservoirs and constrained by volcanic architectures, therefore, the acoustic impedance volumes, density volumes, acoustic volumes, and porosity volumes that reflect reservoir petrophysical properties can be obtained by “body-controlling” seismic inversion. This will help extract the classified effective thickness for predicting each type of effective volcanic reservoir [7–10] by applying the seismic classification criteria for effective reservoirs.
1 Establishing the volcanic framework model to constrain seismic inversion
Volcanic reservoirs typically have a great thickness, rapid facies change, and strong heterogeneity; consequently the distribution and configuration of effective reservoirs in each architectural unit are highly variable (Figure 9.26). As a result, volcanic framework modeling based on internal structure dissection and sequence division is important for constraining seismic inversion.

On the basis of the architectural characteristics of volcanic rocks, the complete framework model includes two parts (Figure 9.27): (1) the framework model controlled by the top and bottom structural planes of volcanic reservoirs, which is used mainly for setting top and bottom constraints for seismic inversion; and (2) the framework model controlled by the internal architecture (i.e., the stratigraphic framework model for each level of internal architecture in the 3D space delineated by the gas reservoir top and bottom planes), which primarily is used to provide boundary constraints for each level of architecture for seismic inversion and provide a basis for geological control.

2 Acoustic impedance inversion
Constrained by the framework model and based on logging normalization, high-resolution reservoir calibration, wavelet extraction, and so on [11], the initial model that can reflect the volcanic architecture is constructed using seismic data and high-resolution log data. Acoustic impedance volumes can be obtained with the model-constrained sparse spike inversion method.
1) Establishing an initial acoustic impedance model
Constrained by well data, the log data are interpolated at each level of the framework model by means of linear interpolation, fractal interpolation, and waveform coherence interpolation, and the initial acoustic impedance inversion model is thus established with reference to the volcanic reservoir framework model (Figure 9.28). Compared with the initial acoustic impedance inversion model based on the conventional sedimentary reservoir concept (Figure 9.29), the initial model constrained by the framework model can reflect the internal architecture of volcanic gas reservoirs more accurately, thus forming a solid basis for acoustic impedance inversion.


2) Acoustic impedance inversion
Considering the geological features of volcanic gas reservoirs, high-quality acoustic impedance data volumes can be obtained using the model-constrained sparse spike inversion method, constrained by well data and the volcanic framework model, through iterative correction of residual error using stochastic algorithms.
The acoustic impedance data volumes from seismic inversion can better reflect the petrophysical properties of volcanic reservoirs (Figure 9.30) and are important for predicting effective reservoirs. As the example from the CC gas field shows, in the planar map of acoustic impedance (Figure 9.31), high-yield wells (CC103, CC1, CC1-1, etc.) with good petrophysical properties are located mainly in relatively low impedance zones; low-yield wells (CC102, CC104, CC1-2, etc.) with poor petrophysical properties are located mainly in relatively high impedance zones.


3 Reservoir parameter inversion
Based on acoustic impedance inversion and constrained by the volcanic framework model, reservoir parameters are inverted with the approach of “secondary inversion” (Figure 9.32): (1) constructing a pseudo-acoustic curve (using statistics and conversion methods to convert reservoir parameters to the same value range of acoustic logs); (2) on the basis of pseudo-acoustic curves, using the acoustic impedance inversion method to acquire pseudo-acoustic impedance data volumes; and (3) using waveform coherence or statistic algorithms to establish the relationship between reservoir parameters and pseudo-acoustic impedance data and performing a “secondary inversion” to obtain reservoir parameter volumes (including density volumes, acoustic volumes, and porosity volumes).

Data volumes from reservoir parameter inversion can more directly reflect petrophysical property changes in volcanic reservoirs and form the basis for better prediction of effective gas reservoirs. In the planar map of porosity and density in the CC gas field (Figures 9.33 and 9.34), high-production wells with good petrophysical properties are located mainly in high-porosity zones or relative low-density zones. Low-production wells with poor petrophysical properties are located mainly in low-porosity zones or relative high-density zones. The prediction results have proven to be consistent with actual production performance.


4 Extracting categories of net pay thickness
Using inverted acoustic impedance volume and reservoir parameter volumes, the categories of net pay thickness can be extracted according to seismic classification criteria of effective reservoirs: (1) extracting the reservoir gross thickness according to the seismic cutoff criteria of effective reservoirs, (2) extracting the categories of reservoir thickness according to seismic classification criteria of effective reservoirs, and (3) extracting the total net pay thickness and the categories of net pay thickness above gas-water contact according to seismic classification criteria of net pay reservoirs and constrained by gas-water contact.
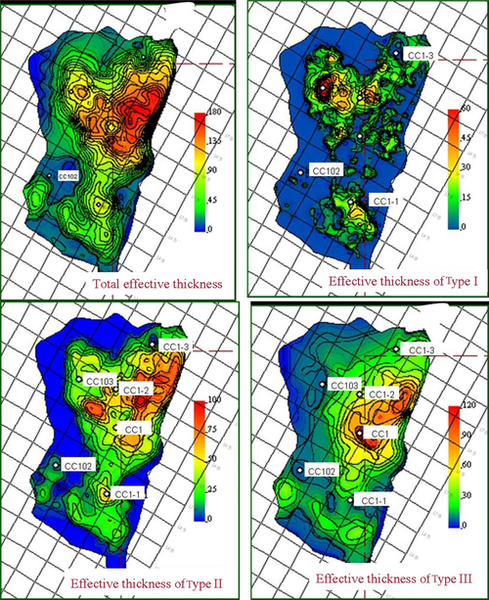
By extracting the categories of reservoir thickness, the planar distribution of each type of volcanic gas reservoir is clarified. In the CC gas field, the total net pay thickness and the categorized net pay thickness above gas-water contact are extracted using inverted volumes of porosity, density, and acoustic impedance, constrained by gas-water contact (Figure 9.35). The results show that (1) in the CC gas field, the maximum total net pay thickness is 146 m with an average of 60 m, and the thickest areas are in the western and northern parts of Well Block CC1; (2) the maximum net pay thickness of type I is 56 m with an average of 15 m, mainly in areas near Wells CC103 and CC1-1; (3) the maximum net pay thickness of type II is 80 m with an average of 35 m, and the thickest area is in the northwestern part of Well Block CC1; and (4) the maximum net pay thickness of type III is 118 m with an average of 40 m, and the thickest area is near Well CC1. The new drilling data confirmed the prediction results, which provide a direct basis for well location optimization.
9.4 Applications
The effective volcanic reservoir identification and prediction techniques discussed in this chapter are unique for volcanic gas reservoir characterization. They constitute the main approaches for clarifying the distribution characteristics of effective volcanic reservoirs. The commercial application of this technique can help optimize well location and improve the success rate of horizontal wells encountering reservoirs.
9.4.1 Optimizing well location and improving the success rate of development well placement
The planar distribution of categorized (classified) net pay zone thickness is the main guidance for development well placement in volcanic gas reservoirs. Through the prediction technique of effective volcanic reservoirs based on body-controlling seismic inversion, the categorized reservoir thickness and net pay thickness above gas-water contact can be extracted to define the planar distribution of each type of volcanic gas reservoir. Optimization of well location can effectively improve the success ratio of development well placement.
In the CC gas field, 12 development wells were designed, including 6 vertical wells and 6 horizontal wells. After all the wells were put into production, the vertical wells reached a production of 8.7 t 34 × 104 m3/d, and the horizontal wells reached a production of 24 to 51 × 104 m3/d, all achieving the expected goal, with a success rate of 100%. After applying this technique in several gas fields (such as the Daqing, Jilin, and Xinjiang oil fields), the success rate of development well placement in complex volcanic gas reservoirs was over 95%, accounting for an improvement of at least 19% compared with the results derived before the application of this technique.
9.4.2 Optimizing well trajectory design and improving the reservoir encounter ratio of horizontal wells
The spatial distribution of effective volcanic reservoirs is the main basis for optimizing well trajectory design. Through identification and categorized prediction of effective volcanic reservoirs, the spatial distribution of each type of effective reservoir can be defined for optimizing the horizontal well trajectory and improving the reservoir encounter ratio of horizontal wells.
Porosity data volumes can be obtained by “body-controlling” reservoir inversion, as is the case in the design and optimization of the Well CCP1 trajectory (Figure 9.36). The actual drilled length of the horizontal interval in this well is 477 m, and the reservoir encounter ratio is up to 94.3%, including 22.2% for type I reservoirs, 40% for type II reservoirs, and 37.8% for type III reservoirs. After initializing production, the natural deliverability of this well reached up to 41.8 × 10⁴ m3/d, with stable pressure and production. The well is in good condition at present, with a cumulative gas production of 6890 × 104 m3. After the application of effective volcanic reservoir identification and prediction techniques, the effective reservoir encounter ratio by horizontal wells in volcanic gas reservoirs improved by about 32%. By now, horizontal well drilling has become one of the major technologies for improving single-well production in most of the volcanic gas reservoirs.
