Statistics and Statistical Software
Preview: The study of statistics is vitally important, yet many people have only a vague understanding of it. Statistical analyses play a role in everything from politics and social science to studies of biological diversity, and individuals with a deep understanding of the science are always in high demand. Many people think they understand statistics, but the actual results of a statistical analysis can be counterintuitive. That is why it is so important to move beyond intuition and into the realm of science. It is important to realize that statistics is not an end in itself. Rather, it is a means for the identification and analysis of problems, and it is a useful tool to arrive at better decisions. The statistical method is used to make decisions with ramifications in the real world, and that makes the science a vital part of modern business. Simply put, statistics attempts to make sense of data. Descriptive statistics involves the collection and description of data. Once the data has been collected and described, the researcher is able to understand the context in which the results are presented. Inferential statistics collects data from a subset of the population and uses that information to draw conclusions about the population as a whole. The populations used in a statistical analysis can be anything from a group of water quality measurements in a river system to the heights of soldiers in the U.S. Army. The science behind the analysis is the same no matter where the data are drawn from. No matter what kind of data is being analyzed, the statistical analysis process uses the same steps: problem definition, data collection, data analysis, and reporting the final analysis. This process is designed to be rigorous and scientific, providing an impartial look at the data and an impartial analysis of the results.
Learning Objectives: At the conclusion of this chapter, you should be able to:
- Set up Microsoft Excel to run statistical analyses
- Understand the importance of random sampling
- Demonstrate how to use Microsoft Excel to identify a random sample
- Understand basic vocabulary in the statistics field
- Explain the importance in using statistics for business decision making
- Identify the sources and types of data used in business.
Introduction
Statistics is one of those strange entities that people describe as useful or even important without knowing precisely what it is; people seem to intuitively know about statistics (or think they know). For example, one of the first questions we ask when teaching a statistics course is (naturally): “What do you think statistics is?” Answers typically range from “statistics consists of compiling lots of numbers [...]” to “statistics deals with collecting and analyzing data”; indeed, most students have something to say. Even prolific writers such as Mark Twain have an opinion about statistics; he is reported to have said: “there are three kinds of lies: lies, damned lies, and statistics” (the exact origin of this phrase is unclear). Contrast that, for example, with what would happen if you ask people what “calculus” is and whether they think it might be useful for them: You most likely earn a majority of blank stares (and not even Mark Twain came up with any quips about calculus).
Thus, statistics as a mathematical topic has an advantage: You do not necessarily have to convince people it is useful; you merely have to ensure they know exactly what it is and how to use it (and how it can be abused). In addition, statistics has a lot to do with data analysis and everybody relies on data in one way or another:
- Corporate presidents decide company policy based on quarterly sales figures.
- Politicians decide on campaign strategy based on polls.
- Teachers decide on grades based on a bell curve.
- You and I decide whether to smoke or not based on the analysis of health records of other people.
As a student studying statistics for decision-making purposes, you should realize that statistics is not the end game. It is a tool, not the ultimate goal of our efforts. We use statistics as a method to identify, analyze, and solve a problem to arrive at a useful decision. That is, the decision is the end game; the statistical methods are just what we are using to help us solve the problem. Thus, in this text we will always opt for mathematical simplicity over detail and we will emphasize how to use statistical analysis to arrive at meaningful decisions as opposed to studying statistics for its own sake. Let us now start for real with a broad definition of statistics.
Definition: Statistics is the study of making sense of data.
In this text we will focus on two basic concepts to make sense of data: descriptive statistics (Chapters 1 to 3) and inferential statistics (Chapters 5 to 9).
Definition: Descriptive statistics involves collecting data, summarizing it, and generally “telling the story” behind the data. This helps describe the data and lets the reader understand the context in which any results should be interpreted. Inferential statistics, on the other hand, uses data collected from a subset of the overall study to draw conclusions about the whole.
In real-world problems you frequently have to combine descriptive and inferential statistics.
Example: A tax auditor is responsible for 25,000 accounts. The auditor wants to know how many of these accounts are in error (resulting in a loss of revenue) and how this compares to a (fictional) nationwide error rate of 2.5 percent.
The steps involved in trying to find a suitable answer to this question might be:
- Identify the objective: How does the error rate for a particular tax auditor compare to the nationwide average?
- Collect the data: The auditor investigates all 25,000 accounts and finds errors with 1,050 of them (say).
- Analyze the data: In this case, we simply compute that 1,050/25,000 = 4.2 percent of accounts are in error.
- Report the analysis: Based on our data analysis we conclude that 4.2 percent of the accounts are in error. Since the national error rate is 2.5 percent, more accounts than usual are in error.
So far we have conducted descriptive statistics: we computed the exact error rate for one auditor and compared it to the national error rate. Note that the data analysis here, such as it is, was done with the help of a simple calculator. More commonly, special software is used to help with the data analysis, and in fact with all stages of a statistical analysis. In this text we will use Microsoft Excel (any one of the most recent versions should work) to help us perform statistical analysis.
The previous example has the big drawback that it would be very time-consuming to analyze all 25,000 accounts. It would be easier to select only a handful of them, analyze those, and then use the results from that subset to make inferences about all accounts. This might not be as precise as checking every account but it might be so much faster and cheaper that the gain in efficiency outweighs the loss of accuracy. Since we are using the analysis of a sample to draw conclusions about all 25,000 accounts, we now engage in inferential statistics.
When we collect data, we have the option of obtaining data from primary or from secondary sources. Primary sources are sources of data in which the person collecting the data is also using it. Secondary sources are data sets that the person running a study did not collect, but instead were collected from another individual or institution.
Definition: The term population stands for the set of all measurements of interest while the term sample denotes any subset of measurements selected from the population.
A population could be (1) the set of all photographs of Mars, (2) the set of heights of people in the U.S. Army, (3) the set of all measurements for the quality of water taken from the Hudson River, or (4) the set of all problems that can be solved using statistics. On the other hand, samples for these populations could consist of (a) the pictures from a specific region of Mars, (b) the heights of people in a particular division of the U.S. Army, (c) the set of water measurements for the Hudson River taken on July 24, 2013, or (d) the statistical problems we are solving in this class. See Table 1.1.
Table 1.1 Examples of populations and samples
|
Population |
Sample |
|
Set of all photographs of Mars |
Pictures from a specific region of Mars |
|
Set of heights of all soldiers in the U.S. Army |
Heights of soldiers from the 5th Infantry Division |
|
All water quality measurements from the Hudson River |
Water quality measurements taken on July 24, 2015 |
|
Set of all problems that can be solved using statistics |
Problems that we will solve in this class |
We finally need a flexible term to denote what is being measured:
Definition: A variable is a characteristic or property of a population where the observations can vary.
Using this terminology, we could refine our four stages of statistical analysis and approach a “generic statistical problem” using these four steps:
- Problem definition: What is the population of interest and what are the variables to be investigated?
- Data collection: Describe and select a sample from the population.
- Data analysis: Make statistical inferences from the analysis of the sample and apply them to the population.
- Analysis reporting: Report the inference together with a measure of reliability for the inference.
With this terminology in place we can revisit our previous example of checking accounts.
Example: A tax auditor is responsible for 25,000 accounts. How many of these accounts are in error (resulting in a loss of revenue), and how does this compare to a (fictional) nationwide error rate of 2.5 percent?
The steps involved in trying to find a suitable answer to this question might now be as follows:
- Defining the problem: The entire population consists of all 25,000 accounts, and the variable to be investigated is whether an account is in error or not. Thus, we have defined one variable, which has a total of 25,000 values.
- Data collection and summary: The auditor decides to select 200 accounts at random, somehow, tests each of them, and finds that 8 of them are in error.
- Data analysis: Some statistical theory is applied to allow drawing a conclusion from the sample of 200 accounts and applying it to all 25,000 accounts. In this case, the likely theory involves computing 8/200 = 4 percent.
- Analysis reporting: Based on our data analysis we infer that approximately 4 percent of the accounts will be in error. Additional theory (which we will cover in Chapter 5) shows that our guess has an error of ±0.9 percent. Thus, it seems that our accounts contain more errors than the national average of 2.5 percent.
The analysis of the data is usually done by using a calculator, or—more frequently these days—with the help of a software package. In this textbook we will use Microsoft Excel (any recent version of Excel should work) to help us perform statistical analysis.
Samples and “Random Samples”
We have defined the terms population and sample and we were interested in selecting a random sample in our last example. The natural question is: What is a random sample, and how do we select one?
Definition: A random sample of size n is a sample that is selected by a process such that any other sample of that size n has the same chance of being selected.
This definition might seem abstract and perhaps not so useful. We could paraphrase it by saying that a random sample is a sample where the selection has taken place without any bias of any sort. If there was no bias of any kind in making a selection of n objects, then any other set of n objects would have had the same chance of being selected. Thus, no bias implies a random sample.
There are cases where it is not only more efficient to work with a random sample, but it might even give more accurate answers than trying to work with the population.
Example: Find the average income for people living in New York City (NYC).
This seems straightforward. The most accurate approach apparently would be to ask everyone living in NYC their income, add up all the figures, and divide the sum by the total number of people asked (which will give the precise average). However, that is not only impractical, it would not even work:
- When people are asked their income not everyone will answer (for a variety of reasons).
- People might not answer truthfully (again for a variety of reasons).
- It will be difficult to physically track down everyone living in NYC.
- By the time the last people are asked, others have moved in or out of NYC already.
Therefore, instead of finding the exact—and arguably elusive—average, we should try to estimate it. Note that according to the U.S. Constitution, Article 1, Section 2, a census needs to be conducted every 10 years so that the people can have a proper proportion of representation in the U.S. House of Representatives. Instead of attempting to count everyone, as seems required, many statisticians argue that using a carefully selected random sample would in fact give more accurate results. But using such inference might be in violation of the constitution depending on the exact meaning of “census.” Discussing constitutional law, however, is way beyond the scope of this text, so, our first problem will simply be to randomly select a small sample, say of size n = 1,000, of people living in NYC and find the average income of that sample (which is perfectly within our capabilities). Then we draw conclusions from that sample about the whole population.
Thus, our question now is: How do I select a random sample of size 1,000 from the population of inhabitants of NYC? We might try to use the following procedure:
- Open the latest NYC phone book.
- Select one page “at random” (perhaps by throwing the book in the air).
- Select 1,000 people starting from that page that the book opens up on.
Call those people and ask them for their income. Compute the average of that group and say that this average is representative for the average income of all people in NYC, approximately.
But this is not at all a procedure to obtain a “random sample”: all people selected will most likely be from one borough, or all may have a name starting with “Mac” (and are therefore likely to be of Irish ancestry, which introduces bias). Thus, this is not a random sample. In fact, it turns out that to select a random sample you need to carefully and deliberately select people from all sociological backgrounds, all races, all cultures, and so on. In other words, contrary to what you might think a random sample must be selected very deliberately in this case.
Random Sample Selection Procedure
While we will generally avoid the problem of random sample selection, we do want to mention at least some way to do this.
Example: Select a random sample of size n = 5 from a population of 2,000 measurements.
We proceed as follows:
- Label all measurements from 1 to 2,000, in any order.
- Start a computer program that can generate random numbers.
- Use that computer program to generate five unique random numbers between 1 and 2,000.
- Select the five measurements from the total population located at those random positions.
This procedure will give a random sample (assuming the computer’s random number generator is working correctly). Another approach that works particularly well using Excel is as follows (see Figure 1.1):
- List all measurements from 1 to 2,000, in any order.
- Create random numbers between 0.0 and 1.0 and store them with each measurement.
- Sort all numbers according to their associated random number between 0 and 1.
- Pick the first five elements from the list of measurements.
For additional details, please see the “Excel Demonstration” section. This works because we are able to list all measurements, which is not always possible. For example, if you want to find the average pollution of a certain river, you clearly cannot label all possible measurements (you cannot even take all possible measurements). In the case of NYC, the phone book is indeed a convenient list of people, but it certainly does not contain everyone: some people might opt for unlisted numbers (probably rich, or younger), others might not have a phone at all (presumably poor), and so on.

Figure 1.1 Selecting a random sample in Excel
From now on, we will take a very simple approach: We will ignore the problem of selecting a random sample and assume that a random sample has been selected somehow.
Variables and Distributions
When we are looking at a particular population and selecting samples to make inferences, we need to record our observations or the characteristics of the data we are studying. Recall that a variable is the term used to record a particular characteristic of the population we are studying.
For example, if our population consists of pictures taken from Mars, we might use the following variables to capture various characteristics of our population:
- Quality of a picture
- Title of a picture
- Latitude and longitude of the center of a picture
- Date the picture was taken
It is useful to put variables into different categories, as different statistical procedures apply to different types of variables. Variables can be categorized into two broad categories, numerical and categorical:
Definition: Categorical variables are variables that have a limited number of distinct values or categories. They are sometimes called discrete variables. Numeric variables refer to characteristics that have a numeric value. They are usually continuous variables, that is, all values in an interval are possible.
Categorical variables again split up into two groups, ordinal and nominal variables.
Definition: Ordinal variables represent categories with some intrinsic order (e.g., low, medium, high; or strongly agree, agree, disagree, strongly disagree). Ordinal variables could consist of numeric values that represent distinct categories (e.g., 1 = low, 2 = medium, 3 = high). Note that this does not turn them into numeric variables; the numbers are merely codes. To best remember this type of variable, think of “ordinal” containing the word “order.”
Nominal variables represent categories with no intrinsic order (e.g., job category, company division, and race). Nominal variables could also consist of numeric values that represent distinct categories (e.g., 1 = male, 2 = female).
It is usually not difficult to decide whether a variable is categorical or numerical.
Example: An experiment is conducted to test whether a particular drug will successfully lower the blood pressure of people. The data collected consists of the sex of each patient, the blood pressure measured, and the date the measurement took place. The blood pressure is measured three times, once before the patient was treated, then one hour after administrating the drug, and again two days after administrating the drug. What variables comprise this experiment?
The characteristics measured in the experiment seem to be the patient’s sex, blood pressure, and treatment date, so it looks like we need three variables to capture the outcomes: sex (nominal), blood pressure (numeric), and date (ordinal). But the fact that the blood pressure is measured three times does not quite fit this scheme. In fact, for each patient participating in the study we actually measure five characteristics: sex, treatment date, blood pressure prior to treatment, blood pressure right after treatment, and blood pressure two days after treatment. Thus, we really have five variables, not three. In fact, we also have one additional variable, namely, the ID (or name) of the patient. Thus, the data collected for four (fictitious) patients is recorded in six variables as shown in Table 1.2.
Note that many statistical software packages follow this convention to setup variables in columns, one column per variable, and to record the values for each case in rows.
Table 1.2 Recording variables and values in tabular form
|
Patient ID |
Sex |
Date |
Pressure |
Pressure |
Pressure |
|
1 |
Male |
January 1, 2014 |
180 |
135 |
150 |
|
2 |
Female |
January 1, 2014 |
170 |
140 |
145 |
|
3 |
Male |
January 3, 2014 |
200 |
130 |
140 |
|
4 |
Male |
January 7, 2014 |
190 |
160 |
190 |
Example: Consider the following survey, given to a random sample of students taking a university course:
Q1: What is your status?
[ ] Freshmen [ ] Sophomore [ ] Junior [ ] Senior [ ] Graduate Student
Q2: What is your major? ![]()
Q3: What is your age? ![]()
Q4: How often do you use the following support services?
|
|
Daily |
Few |
Few |
Few |
Never |
|
Dining services |
|
|
|
|
|
|
Health services |
|
|
|
|
|
|
Recreation center |
|
|
|
|
|
|
PC support services |
|
|
|
|
|
|
Campus ministry |
|
|
|
|
|
Q5. The following student support services are effective:
|
|
1 (Strongly agree) |
2 |
3 |
4 |
5 (Strongly disagree) |
−1 (No opinion) |
|
Dining services |
|
|
|
|
|
|
|
Health services |
|
|
|
|
|
|
|
Recreation center |
|
|
|
|
|
|
|
PC support services |
|
|
|
|
|
|
|
Campus ministry |
|
|
|
|
|
|
Note: 1 = Strongly agree, 2 = Agree, 3 = Neutral, 4 = Disagree, 5 = Strongly disagree, −1 = Not applicable.
The survey consists of a total of 13 variables as follows: Q1 (status) is an ordinal variable, Q2 (major) is nominal, and Q3 (age) is numeric. Q4 consists of five variables (one for each row of the table), all being ordinal, and Q5 again consists of five ordinal variables. Note in particular that the five variables in question 5 are not numeric. The numbers are simply codes for particular categories. However, ordinal variables share some characteristics of numerical ones, as we will see in Chapter 3. Following our previous example, we should introduce one additional nominal variable to capture the ID of each subject. This allows us to have a unique identification for each data record.
When the results of a survey or an experiment are recorded, the outcomes usually vary, and the variation of each variable usually occurs with different frequencies. For example, a survey given to a random sample of U.S. citizens might record the sex of the subject. The frequencies of the values for this variable will likely be approximately 52 percent female and 48 percent male. Recognizing patterns in the frequencies of outcomes is in fact one of the goals of statistics.
Definition: The distribution of a variable refers to the set of all possible values of a variable and the associated frequencies or probabilities with which these values occur.
Sometimes variables are distributed so that all outcomes are equally, or nearly equally likely. Other variables show results that “cluster” around one (or more) particular value.
Definition: A heterogeneous distribution is a distribution of values of a variable where all outcomes are nearly equally likely. A homogeneous distribution is a distribution of values of a variable that cluster around one or more values, while other values are occurring with very low frequencies or probabilities.
Example: Suppose you are conducting a survey that tries to determine whether women are typically shorter than men. Thus, your survey, administered to 100 randomly selected people, asks for the respondent’s sex and height. Do you anticipate homogeneous or heterogeneous distributions from these variables?
Since approximately half of all people are male and half are female and the survey was given to 1,000 randomly selected participants, there should be approximately the same number of men and women queried. Thus, the variable sex should have a heterogeneous distribution—all possible values are just about equally likely. The second variable, height, however, will likely cluster around one or two most frequent values. Or conversely, few people are really short (4 ft. or less) or really tall (7 ft. or more), so this variable should be homogenously distributed.
Example: Suppose a company issues sales reports for two years, 2014 and 2015, as shown in Figure 1.2. We can consider this report as having two variables (v_2014 and v_2015, say), each one having four values (for North, South, East, and West, separately). Are the distributions of values hetero- or homogeneous?
The values for the 2014 variable (v_2014 if you like) are pretty close to each other. In the chart you can see that all 2014 bars are approximately of equal height. If we looked at the original figures, we would find an (about) equal amount of sales for North, South, East, and West, and no region would stick out, particularly. Thus, each region is equally likely in terms of number of sales—the distribution is heterogeneous (if we checked where an individual, randomly selected, came from, each region would be approximately equally likely).
The values for the 2015 variable (v_2015 in our terminology) differ widely. In Figure 1.2 the 2015 bars are of different heights, with “East” being by far the highest. If we would look at the original figures, we would find that most sales were made in the East. Thus, a sale from the East is much more likely than from any other region—the distribution is homogeneous (if we checked where an individual, randomly selected, came from, she would most likely come from the east). This seems somehow counter intuitive:
- If all bars of a distribution are approximately equally high, the variable is heterogeneous.
- If some bars of a distribution dominate the others, the variable is homogeneous.

Figure 1.2 A sample company sales report
Introduction to Microsoft Excel
This text utilizes Microsoft Excel 2013. If you are using Microsoft Excel 2007 or 2010, there will be very minor differences and you should be able to follow along with the examples in this textbook. Understanding the basic workings of Microsoft Excel will be necessary in this course; however, advanced knowledge of the software is not necessary. The guided examples are designed so that anyone with basic knowledge of the software can follow along. If you need additional assistance with the basic functions and working of Excel, such as entering values and formulas, selecting ranges, basic functions, saving and retrieving files, and so on, we recommend spending some time using the resources available on Microsoft’s website at https://support.office.com. Search for “Basic Tasks in Excel 2013.”
Installing the Analysis ToolPak in Microsoft Excel
Excel contains a variety of “add-ons” that allow you to perform additional calculations beyond the basic features built into Excel from the start. Some of these add-ons might require you to insert the Microsoft Office CD ROM; others can be installed without that disk. In general, the more add-ons you install into Excel, the longer the program takes to start up. Therefore, you only want to install those options that you are really going to use, or uninstall add-ons when you do not need them any longer.
For this text you must install the “Analysis ToolPak,” which contains a variety of procedures for conducting statistical analysis. Installing an add-on is simple, but differs slightly depending on your version of Excel. Here is the procedure for the 2013 version of Excel for Windows. (Note that Excel for Mac does not include this ToolPak. If you are using a Mac, try and install the free software from www.analystsoft.com/en/products/statplusmacle/instead.)
- Start Excel as usual with a blank sheet.
- Click on the “File” button in the top left corner.
- Click on “Options” near the bottom of the menu.
- Highlight the “Add-Ins” option on the list on the left.
- Under the “Manage” section, make sure Excel Add-ins is selected and click the “GO” button as shown in Figure 1.3.
- Another dialog box will appear; check the “Analysis ToolPak” and click “OK.” (Caution: Be sure not to install the Analysis ToolPak—VBA version.)
The functions from the Analysis ToolPak will now be available in the “Data” ribbon as the right-most entry, named “Data” (and not in the “Add-ins” ribbon as you might expect). The specific functions in that add-in are the same for most versions of Excel for Windows. If you select the “Data Analysis …” option under “Data” you will see the procedures as shown in Figure 1.4 for performing statistical analysis on data in your spreadsheet.

Figure 1.3 Dialog to install the Analysis ToolPak for Excel for Windows

Figure 1.4 Procedures of the Analysis ToolPak
We will explore several of these options in the rest of this course, but you are welcome to click on “Help” now to learn more about the Analysis ToolPak.
Excel Demonstration
In this textbook we will follow two fictitious companies, Company S and Company P. Both of these companies will be faced with common workplace problems as we proceed through the text, and you will be provided with demonstrations on how to arrive at answers for these problems using statistics and Microsoft Excel. Here is a background of the two companies.
Company S is a mid-sized accounting firm with approximately 600 employees. As a service-based organization, Company S provides services such as general accounting, bookkeeping, tax preparation, software consultation, controller services, business accounting, and payroll services. Company S comprises a management team, support staff, and certified public accountants (CPAs). Management is responsible for developing strategies to generate new clients, while the support staff and CPAs fulfill the service requests of their clients.
Company P is a large manufacturer of paper products with approximately 1,000 employees and supplies various paper products to retailers around the United States. These products include industrial supplies, food service supplies, sanitary supplies, and packaging supplies. As a product-based organization, Company P, in addition to management and support staff, has a sales force that is broken into sales teams, with each team given a regional territory. Each sales team is responsible for establishing and managing relationships with retailers and the sale of products to retailers within their territory.
Using Excel to Select a Random Sample
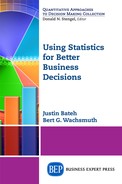
Problem: Company P would like to interview a random sample of 5 of the top 20 clients in the company. Use Excel to select a random sample of size 5 from the population of 20 clients.
The task is to assign a random number to each client and then sort by this number in order to pull a random sample of five clients. First, enter the 20 client names into a new Excel worksheet into column A. Then, next to each client name, enter the Excel function =RAND(). Note that in order to enter an Excel function, you must start with a leading equal sign. If it worked you should see a random number between 0 and 1 in that cell but when you click on it you will see the =RAND() function in the Excel edit bar. You could now type this function into the remaining 19 cells but to speed up the process, “copy and paste” the entry from the first cell value into the following 19 cells in column B. See Figure 1.5.

Figure 1.5 Selecting a random sample from a list of client names