
7 Calculating Your Marketing Communications Budget
Some consultants or authors recommend that in certain industries, you dedicate a particular percent of sales for your marketing communications budget. I believe this is bad advice; you should not be spending the same amount as your competitors. In those markets that you are pushing, you should be spending more and in those markets where you are harvesting, you should be spending less. For example, your budget should be tied to your plans relative to market share objective, number of new products or services, market growth, plant or facility utilization, amount of sales transaction, importance to customer, premium or discounted pricing, relative quality, depth of line, and a standard versus custom brand.
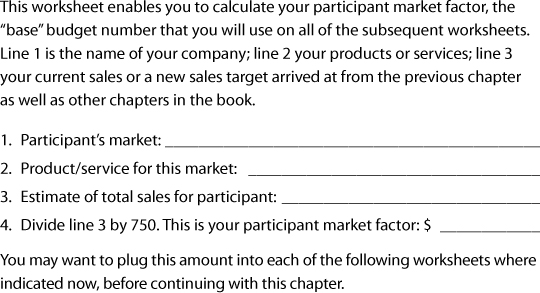
Following are some formulas that you can use to factor in these components to calculate your budget. First, in Worksheet 7–1, you calculate your participant market factor, which is based on your total sales. Then you adjust this factor, based on the market objectives mentioned above, in Worksheets 7–2 through 7–11 to calculate your budget, as shown on Worksheet 7–12.
For example, Worksheet 7–2 factors in your market share objective. If your objective is less than 10 percent, you reduce your marketing communications budget (developed in the very first worksheet) to only 40 percent. If it is between 10 and 16.9 percent, you reduce it to only 70 percent. If it is between 17 and 24.9 percent, you reduce it to only 80 percent. However, if it you are going for a market share between 25 and 39.9 percent, you increase it by 1.20 percent and if over 40 percent, you double it.
You make these adjustments based on your various objectives on Worksheets 7–3 to 7–11 and insert the resulting budget figures on Worksheet 7–12. You add them up and then divide by the number of charts you used—and that is your marketing communications budget.
Worksheet 7–1 Participant’s market factor
Worksheet 7–2 Factoring in your market share objective

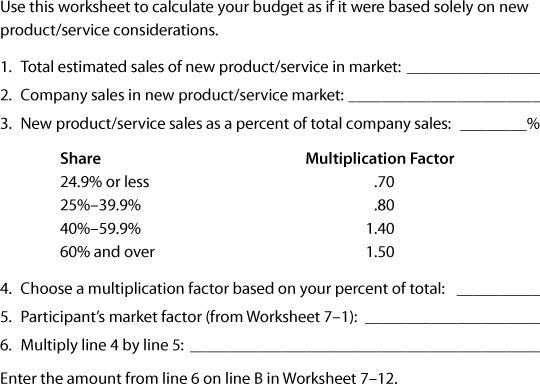
Worksheet 7–3 Introducing a new product/service

Worksheet 7–5 Plant utilization

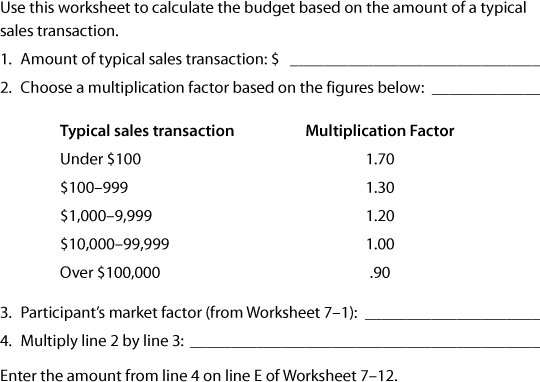
Worksheet 7–6 Amount of typical sales transaction
Worksheet 7–7 Importance to customer

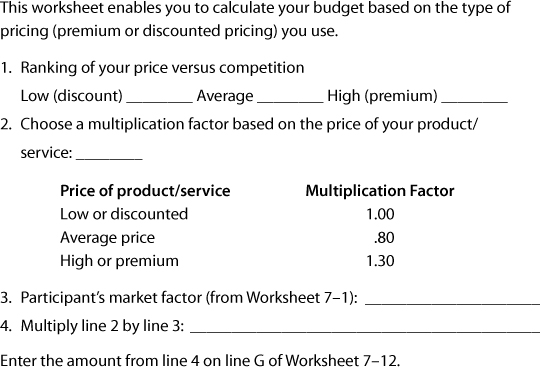
Worksheet 7–8 Premium or discounted pricing
Worksheet 7–9 Relative quality


Worksheet 7–11 Standard versus custom product/service

Worksheet 7–12 below should be all filled in now that you have reached the end of the chapter (unless you decided that a particular variable was not relevant to your particular product or service and so left that row blank). You should be easily able to add all the budgets and find the average.
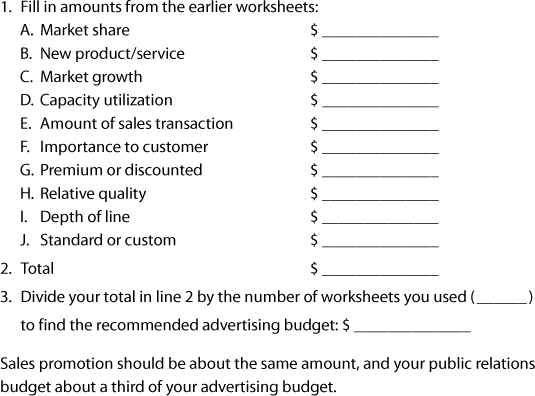
The amount on line 3 of Worksheet 7–12 is the recommended advertising budget, although you should compare this amount with the reach and frequency worksheet in Chapter 9, The Advertising Plan.
Source for the worksheets, with some adjustments, is PIMS and Cahners Publishing.