Explore DEVONthink’s Interface
Now that you know the basic concepts and terms that DEVONthink uses, it’s time to learn your way around. Because of the many ways DEVONthink can display your data and some of the unique tools it offers, you’ll be on a firmer footing if you take a few moments to read this chapter and learn how the interface is organized, where to find the things that you’ll use most often, and what some of the program’s icons and other controls do.
Support Assistant
The first time you launch DEVONthink, a window called the Support Assistant opens (Figure 2) to welcome you and offer a tour of the app as well as links to tips, tutorials, support, and other help.
The Support Assistant window appears every time you launch DEVONthink. To keep it from doing so, deselect the Show This Window When DEVONthink 3 Opens checkbox. (You can then display it manually, whenever you want, by choosing Help > Support Assistant.)
Although it may not be obvious at first glance, you can access lots of useful features from this window:
Newsletter subscription: To subscribe to a free periodic newsletter with DEVONthink tips, enter your email address under “Newsletter.” Then click the blue checkmark
 icon to subscribe.
Tip and extra of the day: The right side of the Welcome screen presents a random selection from the tips and extras, all of which are found elsewhere in the Support Assistant.
Technical support: Click the Get Support link at the bottom of the window for shortcuts to the DEVONthink FAQ, user forum, and contact page, plus tools to retrieve a lost license (or buy a license if you’re still using the free trial), update your name or email address, and read the DEVONtechnologies blog.
Extras: Click the Install Extras link at the bottom of the window to display a screen with extra AppleScripts and templates (beyond those installed automatically or via the Add-Ons window, discussed next); you can install any of these by clicking the Install button beneath it. (To remove an installed item, click Remove.) You can also check the “Install & update extras automatically” box at the bottom, which installs all the extras immediately and keeps them up to date automatically.
Setup: Click the Setup link at the bottom of the window for a quick three-step overview of how to get started with DEVONthink—make a database, install add-ons, and customize. (Feel free to skip these; I cover all these things later in the book.)
Tips and tutorials: Click the Tips & Tutorials link at the bottom of the window to show a selection of text-based tips (at the top) and step-by-step illustrated tutorials (at the bottom).
Add-Ons
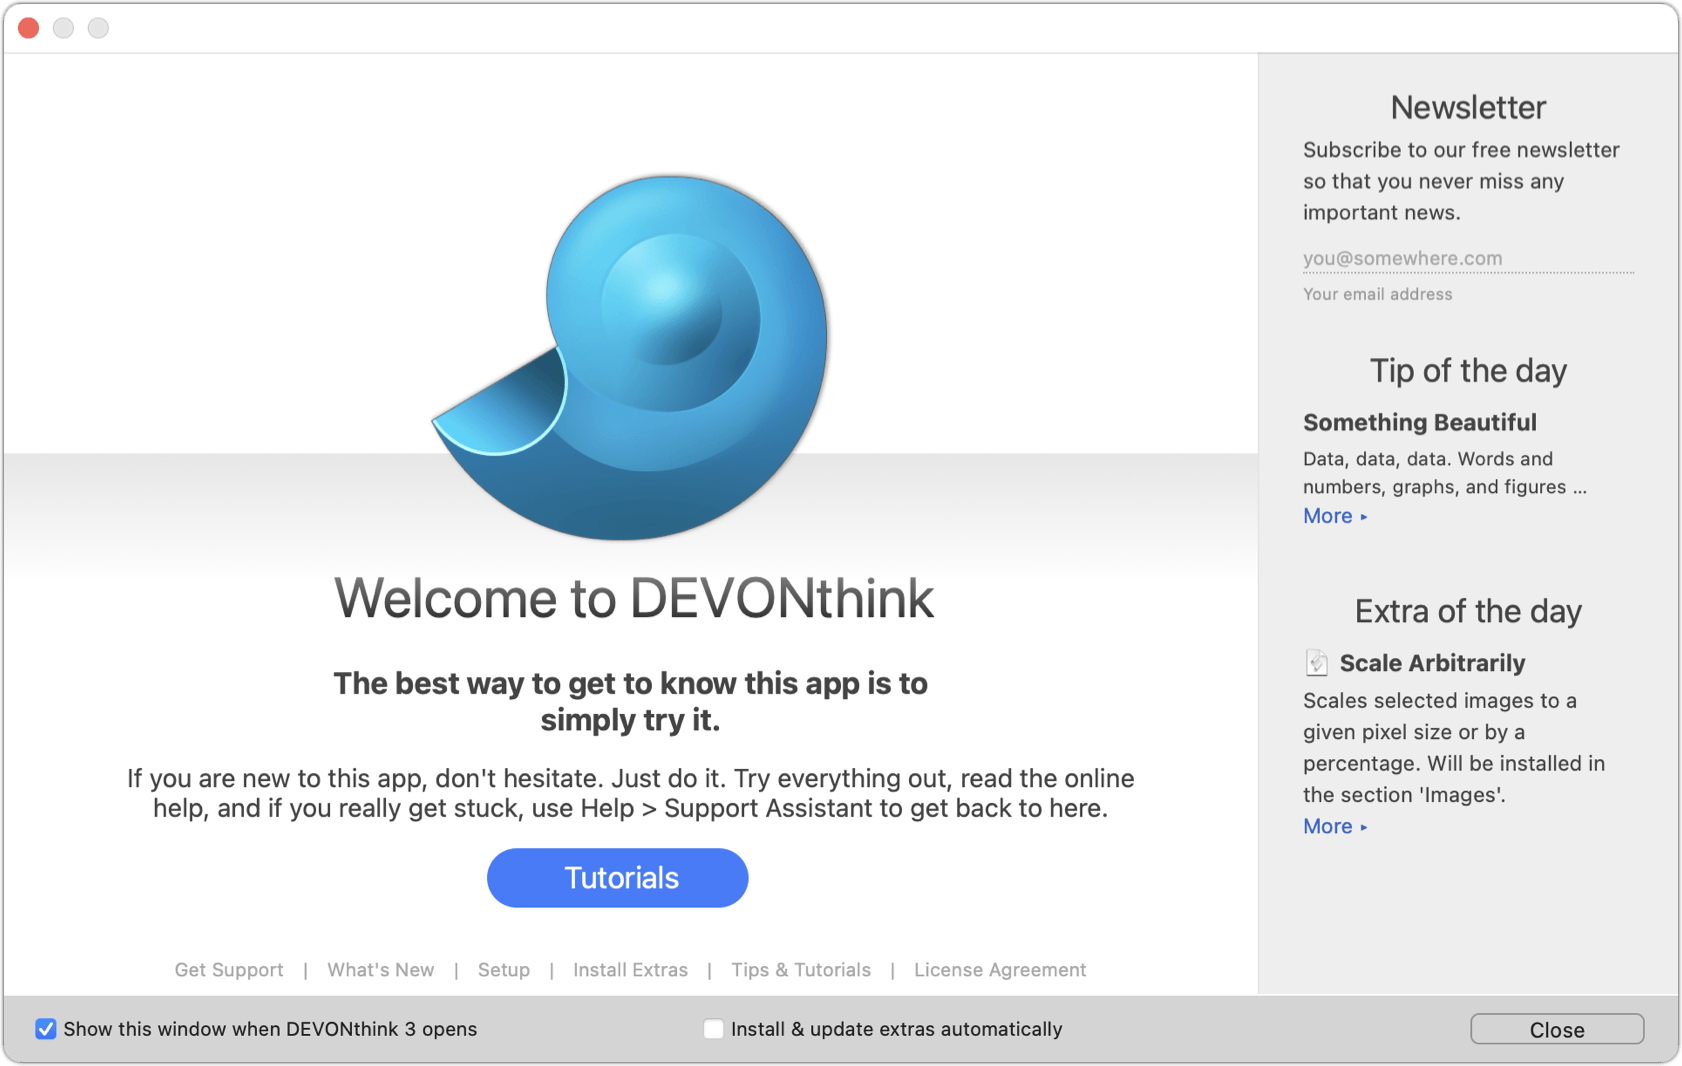
If you haven’t already installed the add-ons from within the Support Assistant, choose DEVONthink 3 > Install Add-Ons to display the Install Add-Ons window (Figure 3).
For now, I recommend leaving the default items selected, clicking Install, and following the prompts, because the additional tools will be useful to you. If you choose to skip this now, or omit any of the add-on options, you can always return to this window later. I describe each of these add-ons and how to use them later in this book.
Main Window
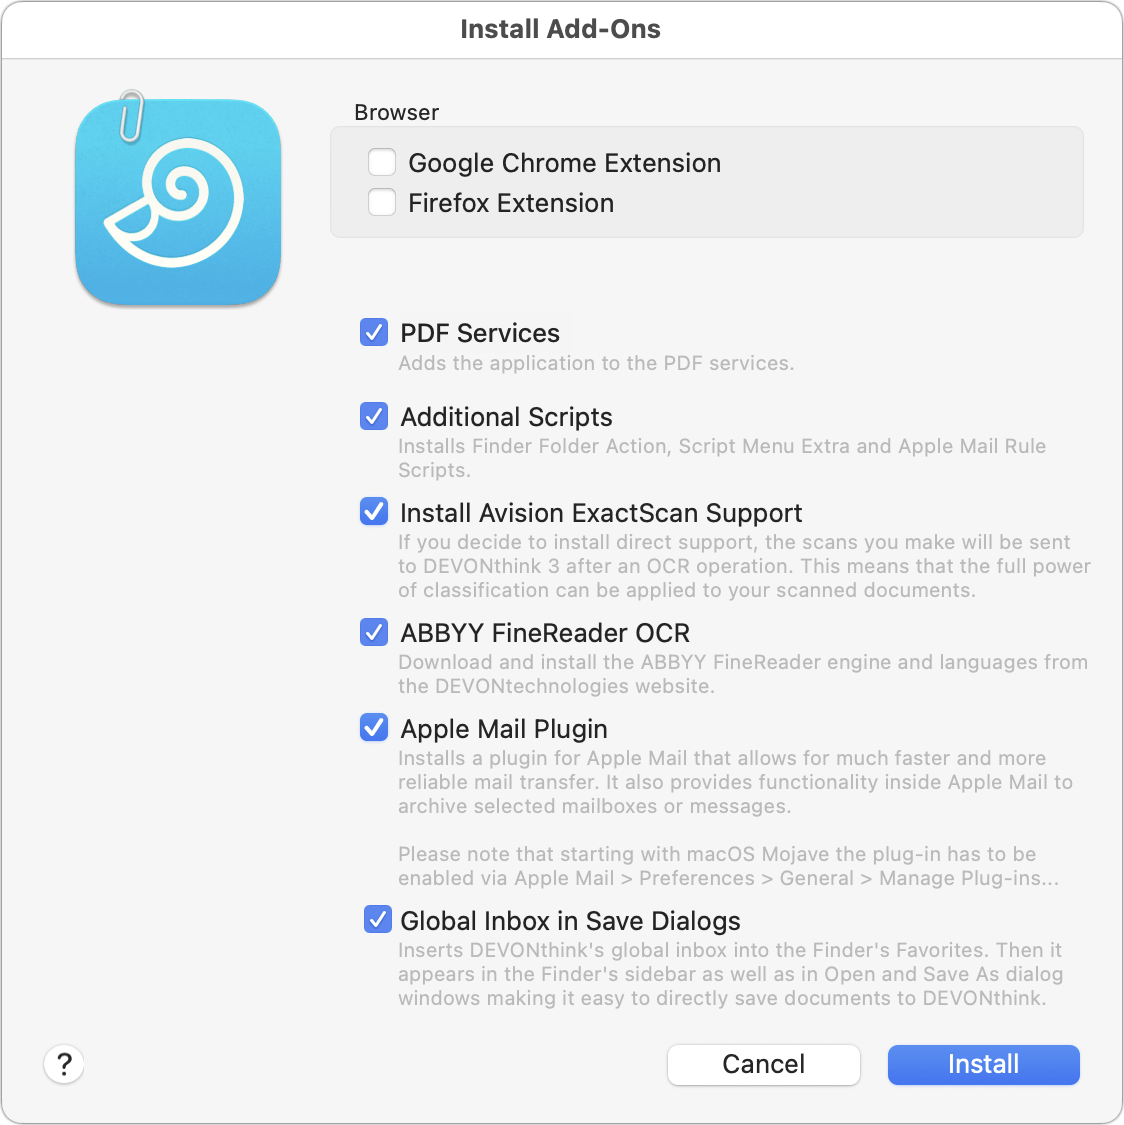
When you begin using DEVONthink, the main window looks something like Figure 4. This is where nearly all the action happens. DEVONthink 3 integrates almost everything into a single window, with sidebars, toolbars, and context-sensitive inspectors—much like Apple’s iWork apps.
Because every aspect of the window is customizable, yours may look different from the one shown here. But let’s take a quick spin through the major parts of the default window. Figure 5 below shows the main window as it appears with most optional areas visible—but with no documents yet in DEVONthink. I explain each labeled area ahead.
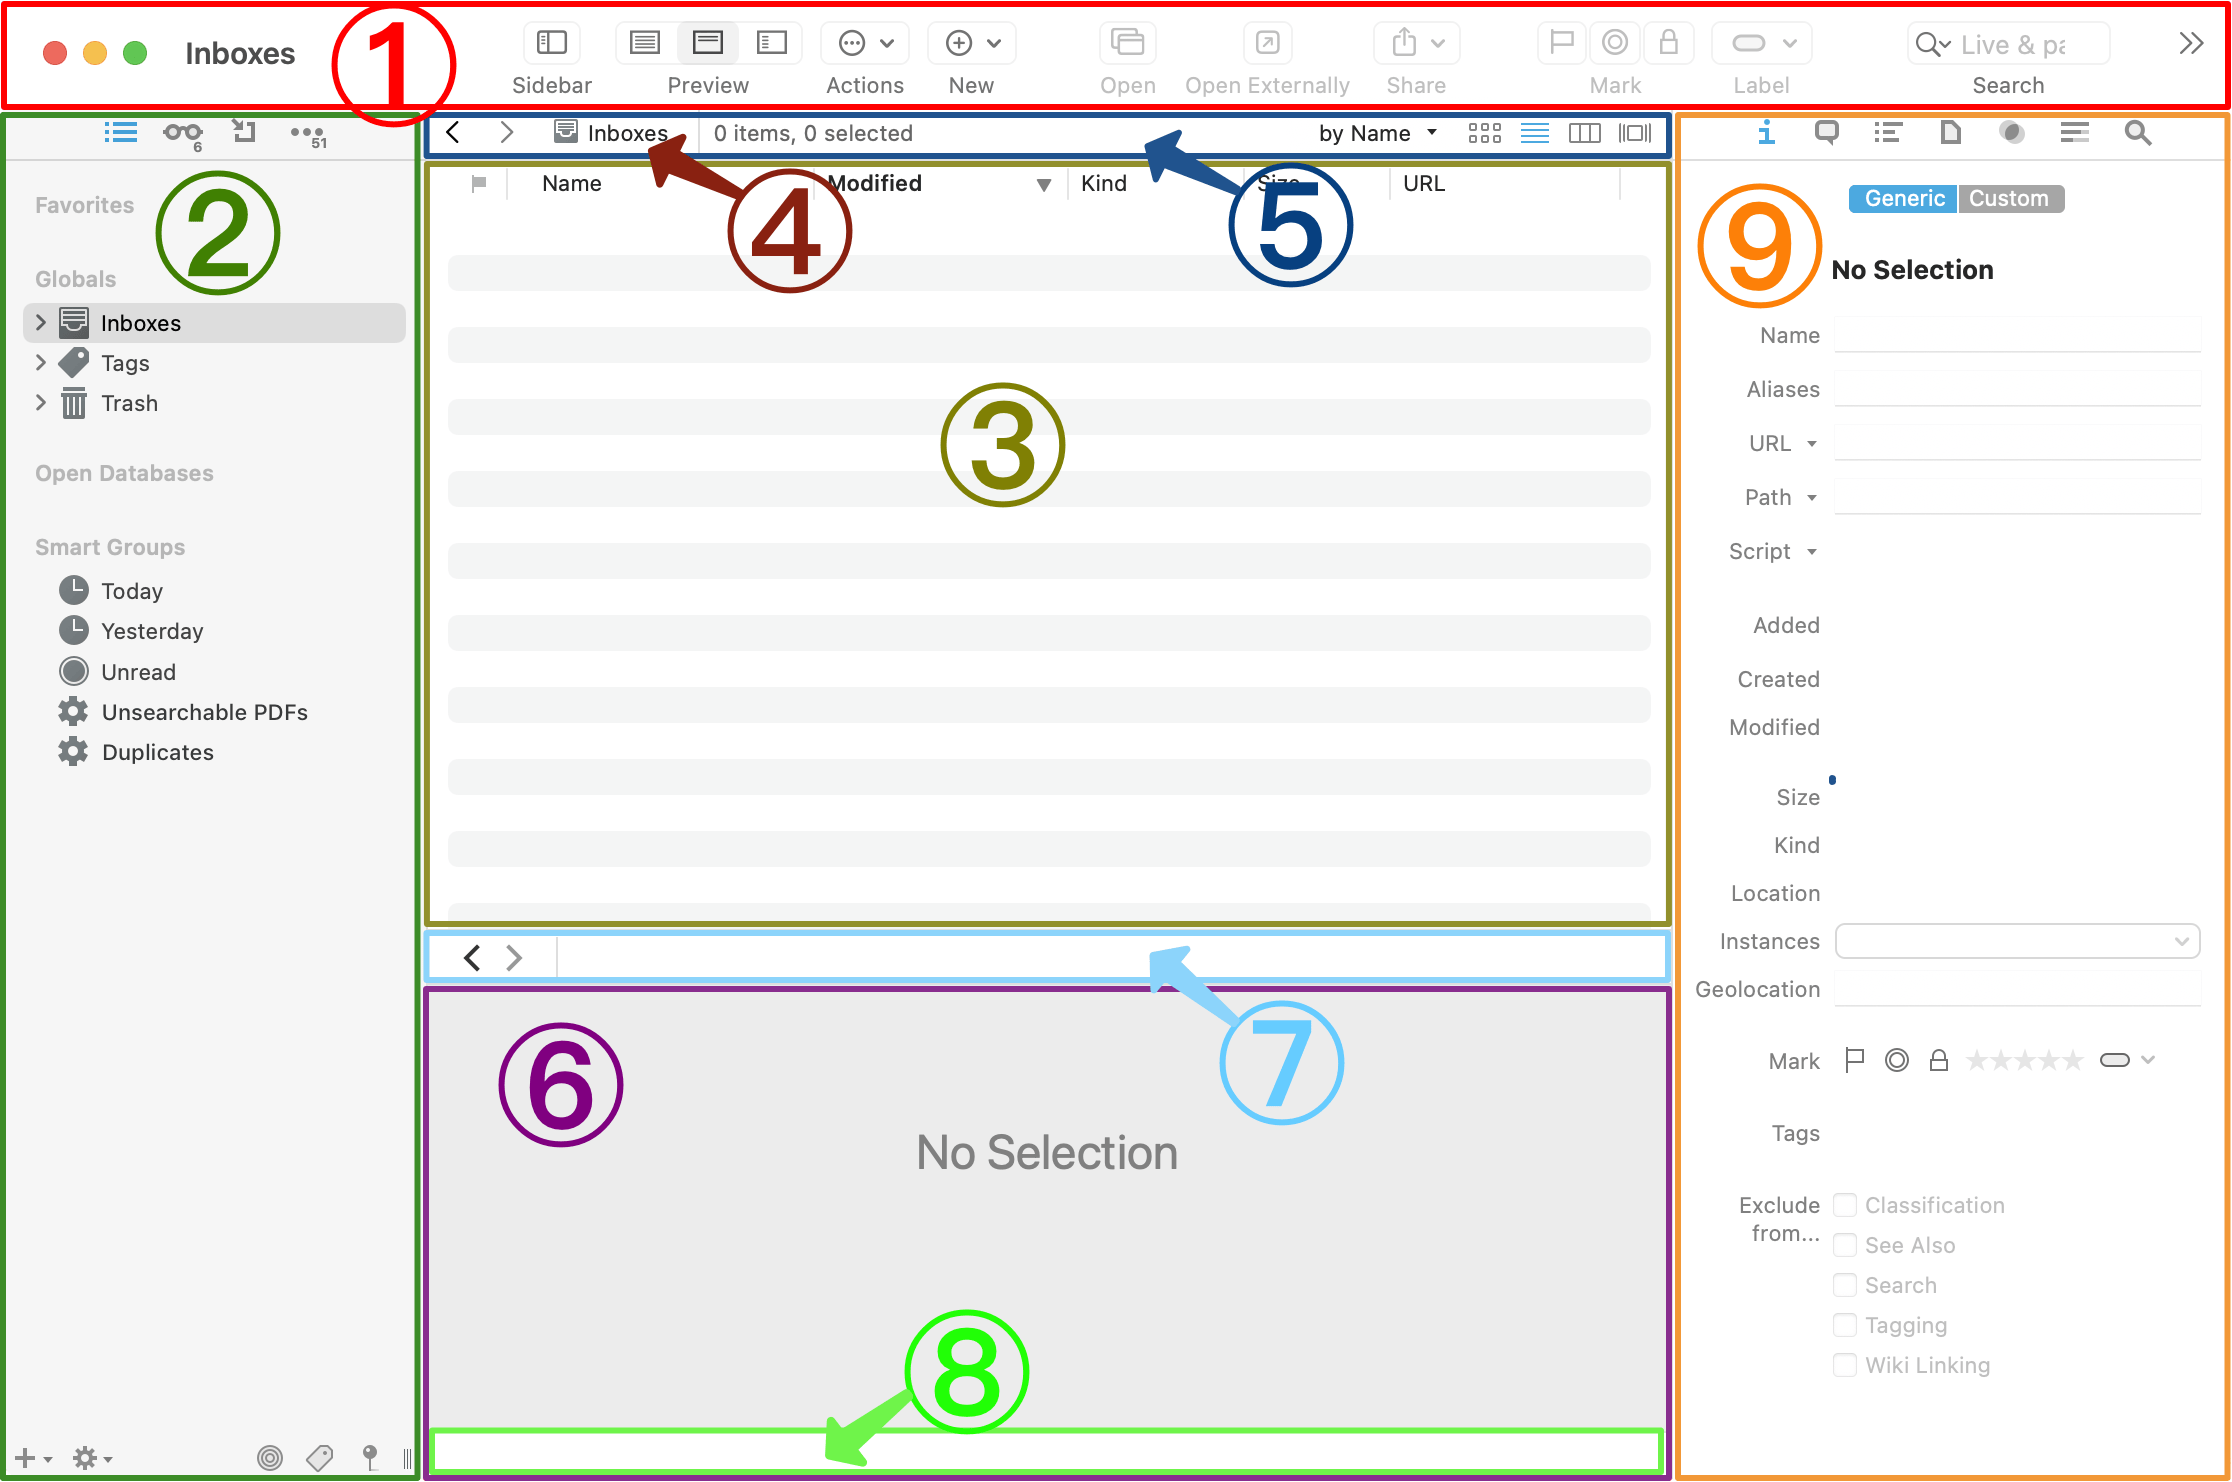
DEVONthink 3 offers a flexible set of controls to create almost any layout you may want. You can selectively show or hide almost every part of the window, and choose a vertical or horizontal arrangement of the item list and view/edit pane. (It also continues to offer two Full Screen options.) Keep reading in this chapter for further details.
Toolbar
The toolbar at the top (Figure 6) provides quick access to many commonly used DEVONthink features, such as showing or hiding parts of the window, marking and labeling documents, and searching. The contents of the toolbar change according to what (if anything) is currently selected.

To learn what any control does, hover over it briefly with your pointer, and a pop-up tooltip tells you its function. If you want to rearrange the items on the toolbar, add new ones, or remove ones you don’t need, choose View > Customize Toolbar. Using the dialog that appears, drag icons onto or off of the toolbar, or drag them to other positions on the toolbar. You can also determine whether icons, labels, or both appear using the Show pop-up menu. Click Done when you’re finished modifying the toolbar.
Each control on the toolbar is accessible in at least one other way (such as a menu command or keyboard shortcut). So, if you prefer to hide the toolbar to give yourself more space, choose View > Hide Toolbar.
Sidebar
Along the left side of the window is the sidebar, which is shown in Figure 7. To be more precise, DEVONthink can show any of four different sidebars, depending on which icon is selected at top. The Navigate ![]() sidebar shown below is the default and most common one, but there’s also the Reading List
sidebar shown below is the default and most common one, but there’s also the Reading List ![]() sidebar, the Import
sidebar, the Import ![]() sidebar, and the Extras
sidebar, and the Extras ![]() sidebar, all discussed ahead.
sidebar, all discussed ahead.

You can hide the sidebar by choosing View > Hide Sidebar; to display it again, choose View > Show Sidebar. If the sidebar is hidden, however, you won’t be able to see or access your global Inbox (see Inboxes), Trash, favorites, global smart groups, or global smart rules.
Navigate Sidebar
The “main” sidebar view, shown above in Figure 7, shows global items (such as the Inbox, tags, and Trash from your global database, plus smart groups and smart rules); it also displays your open and recent databases, and your favorite databases, documents, and groups (see All About Favorites). It’s handy to show this, for example, when you want to drag something from one database to another.
If you want to use the keyboard to move around within the Navigate sidebar, go to Settings/Preferences > General > Interface and select “Keyboard navigation” (in the Sidebar section). Having done that, you can do the following in the Navigate sidebar:
Move up or down using ↑ or ↓.
Expand or collapse a group using ← or →.
Rename the selected item by pressing Return and typing a new name.
Remove the selected item from the sidebar by pressing Delete or Backspace.
Switch to the previous or next database with ⌘-Option-R and ⌘-Option-E, respectively.
By default, DEVONthink unifies all your databases under the Open Databases heading, and it unifies all your inboxes (in much the same way as Apple Mail) under the Globals heading. However, if you prefer, you can keep databases and/or inboxes separate.
You can alter these settings in Settings/Preferences > General > Interface in the Sidebar section:
With “Unify databases” checked (the default), each database along with its contents is an entry under Open Databases (Figure 8, left). If you uncheck “Unify databases,” only the database names are shown under Open Databases; select one to show its expanded contents under its own sidebar heading (Figure 8, right).
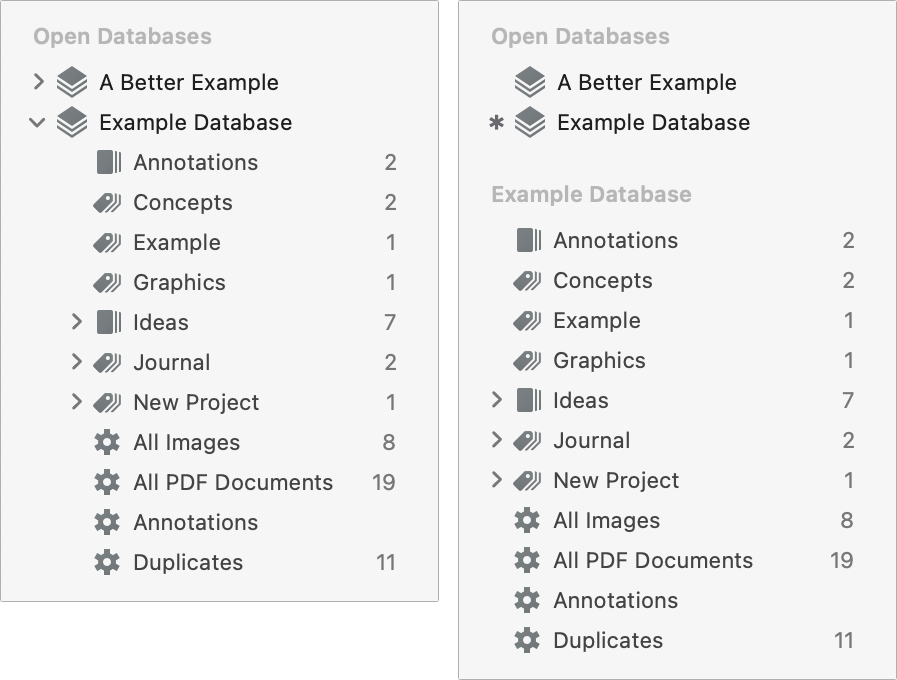
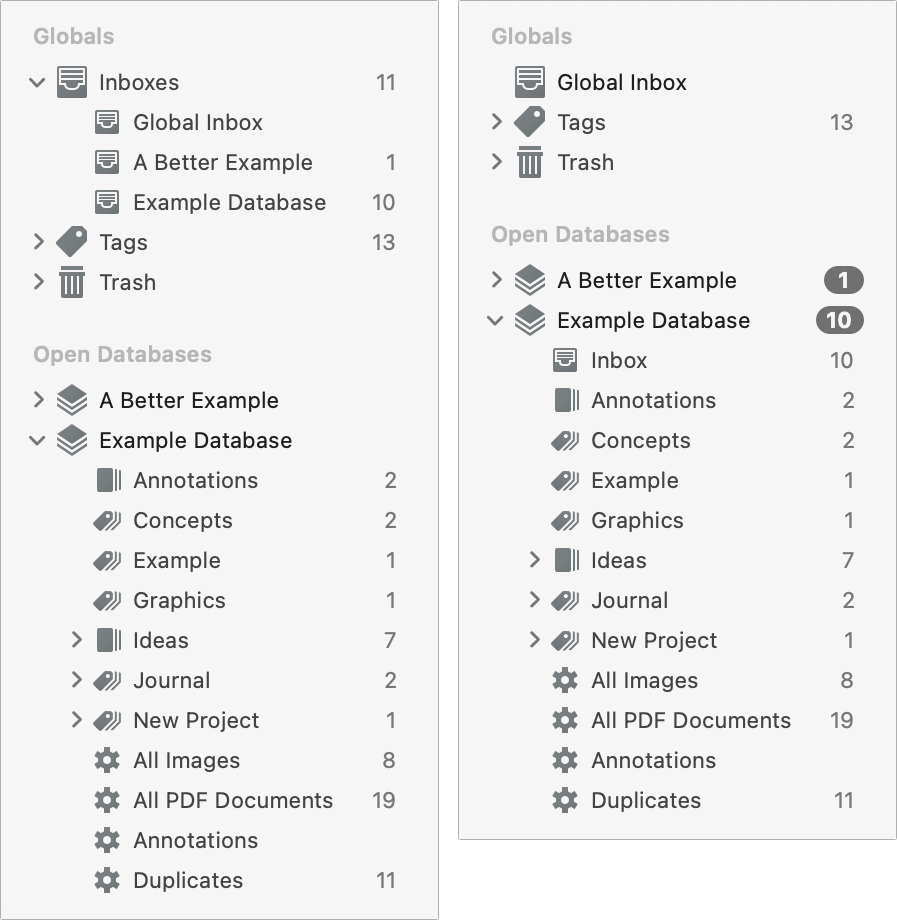
Figure 8: The effect of having “Unify databases” on (left) and off (right). In the latter, the selected database, expanded under its own heading, has an asterisk (*) next to its name under Open Databases. With “Unify inboxes” checked (the default), each database’s inbox appears in the Inboxes group under Globals (Figure 9, left). If you uncheck “Unify inboxes,” only the Global Inbox appears under Globals, while each database’s inbox appears under that database’s name in the Open Databases section (Figure 9, right).
Reading List Sidebar
The Reading List ![]() sidebar (Figure 10) functions much like the Reading List in Safari and other browsers: it displays documents you’ve marked for later reading.
sidebar (Figure 10) functions much like the Reading List in Safari and other browsers: it displays documents you’ve marked for later reading.
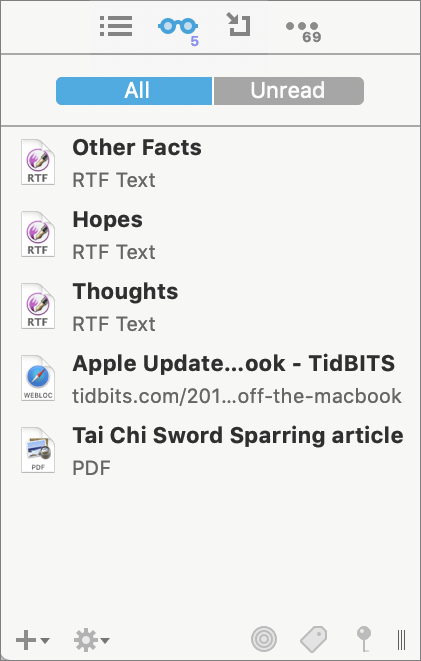
To add a document to the Reading List, select it and choose Data > Add To > Reading List (or the comparable commands on the Action ![]() menu or the contextual menu). The Reading List maintains its own read/unread status for each document, separate from the document’s main status. Documents are marked unread by default, but when you select one, its status changes to read. (If All is selected at the top of the list, it shows both read and unread items; click Unread to show only unread items.) To remove an item from your Reading List (without deleting it from your database), right-click (or Control-click) it and choose Remove Item from the contextual menu. You can rearrange the Reading List via drag and drop.
menu or the contextual menu). The Reading List maintains its own read/unread status for each document, separate from the document’s main status. Documents are marked unread by default, but when you select one, its status changes to read. (If All is selected at the top of the list, it shows both read and unread items; click Unread to show only unread items.) To remove an item from your Reading List (without deleting it from your database), right-click (or Control-click) it and choose Remove Item from the contextual menu. You can rearrange the Reading List via drag and drop.
Import Sidebar
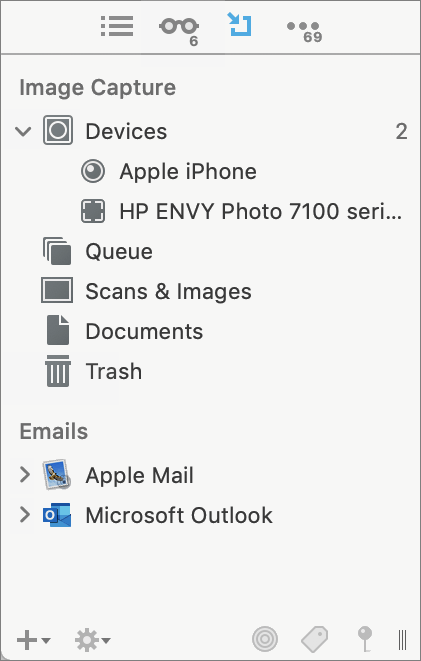
The Pro and Server versions of DEVONthink have an Import ![]() sidebar (Figure 11), which adds yet another way to import scanned documents and email messages. For more details, see Scan Documents and Add Email Messages, respectively.
sidebar (Figure 11), which adds yet another way to import scanned documents and email messages. For more details, see Scan Documents and Add Email Messages, respectively.
Extras Sidebar
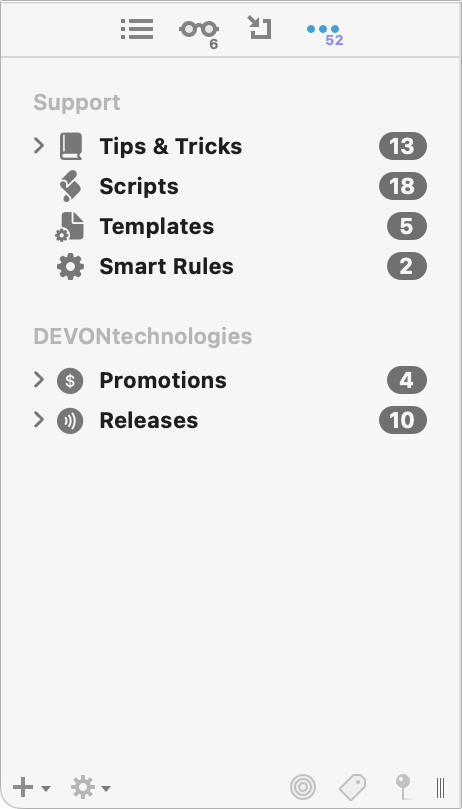
The Extras sidebar, like the Support Assistant window, provides access to useful, up-to-date content and tools from DEVONtechnologies, including scripts, templates, smart rules, tips, tricks, and news (Figure 12).
Item List
The item list, sometimes referred to as the view, is the portion of the window (labeled ⓷ in Figure 5) that lists your documents and groups—it’s the one part of the window that’s always present, though you can change its appearance at any time. As in the Finder, you can display the items in the list as Icons, List, or Columns, as well as using Cover Flow (which was present in older versions of macOS, before being replaced with Gallery view in Mojave). At your option, the item list may also be accompanied by the view/edit pane, sidebar, inspector, and other window elements.
You can switch item list views by using commands in the View portion of the View menu, or by clicking the icons on the information bar.
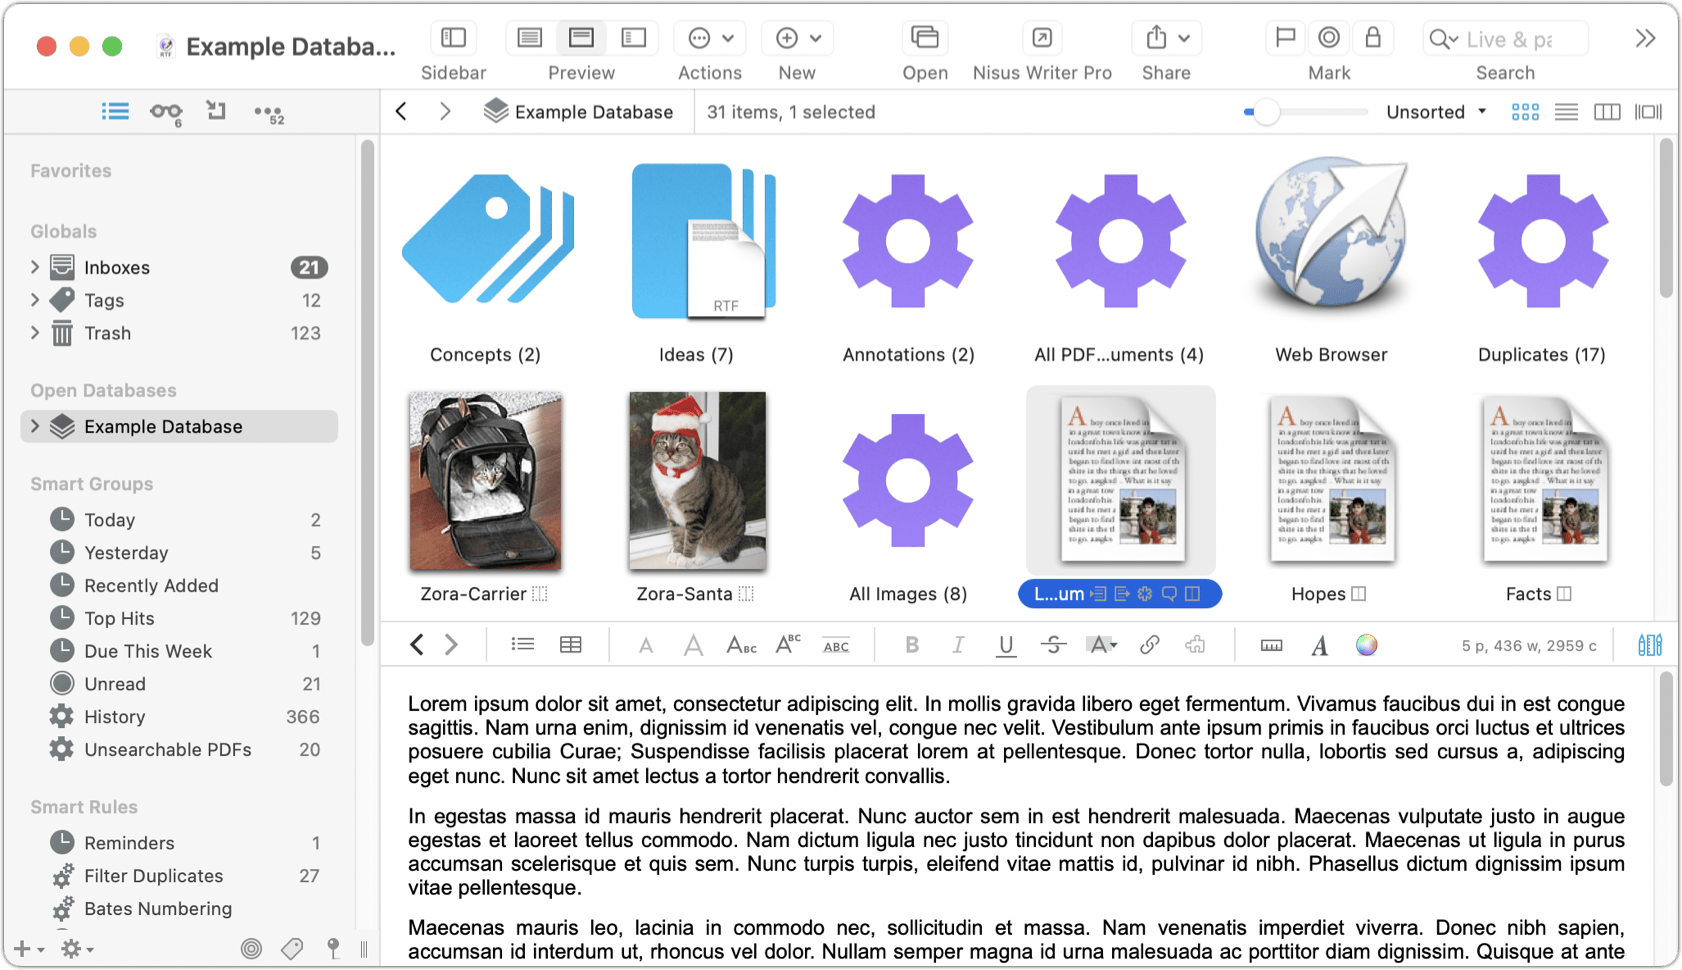
View as Icons
Icon view (Figure 13), which displays large thumbnails of each document, is perhaps the least useful option. While in Icon view, you can use the slider on the information bar to adjust the size of the icons. You can also sort the icons in many ways (by name, kind, size, and so on) using the pop-up menu next to that slider.
In Icon view only, you can choose View > Show Details or View > Hide Details (⌘-Option-L) to toggle the display of additional details about each document or group (Figure 14), giving Icon view some of the additional benefits of List view.

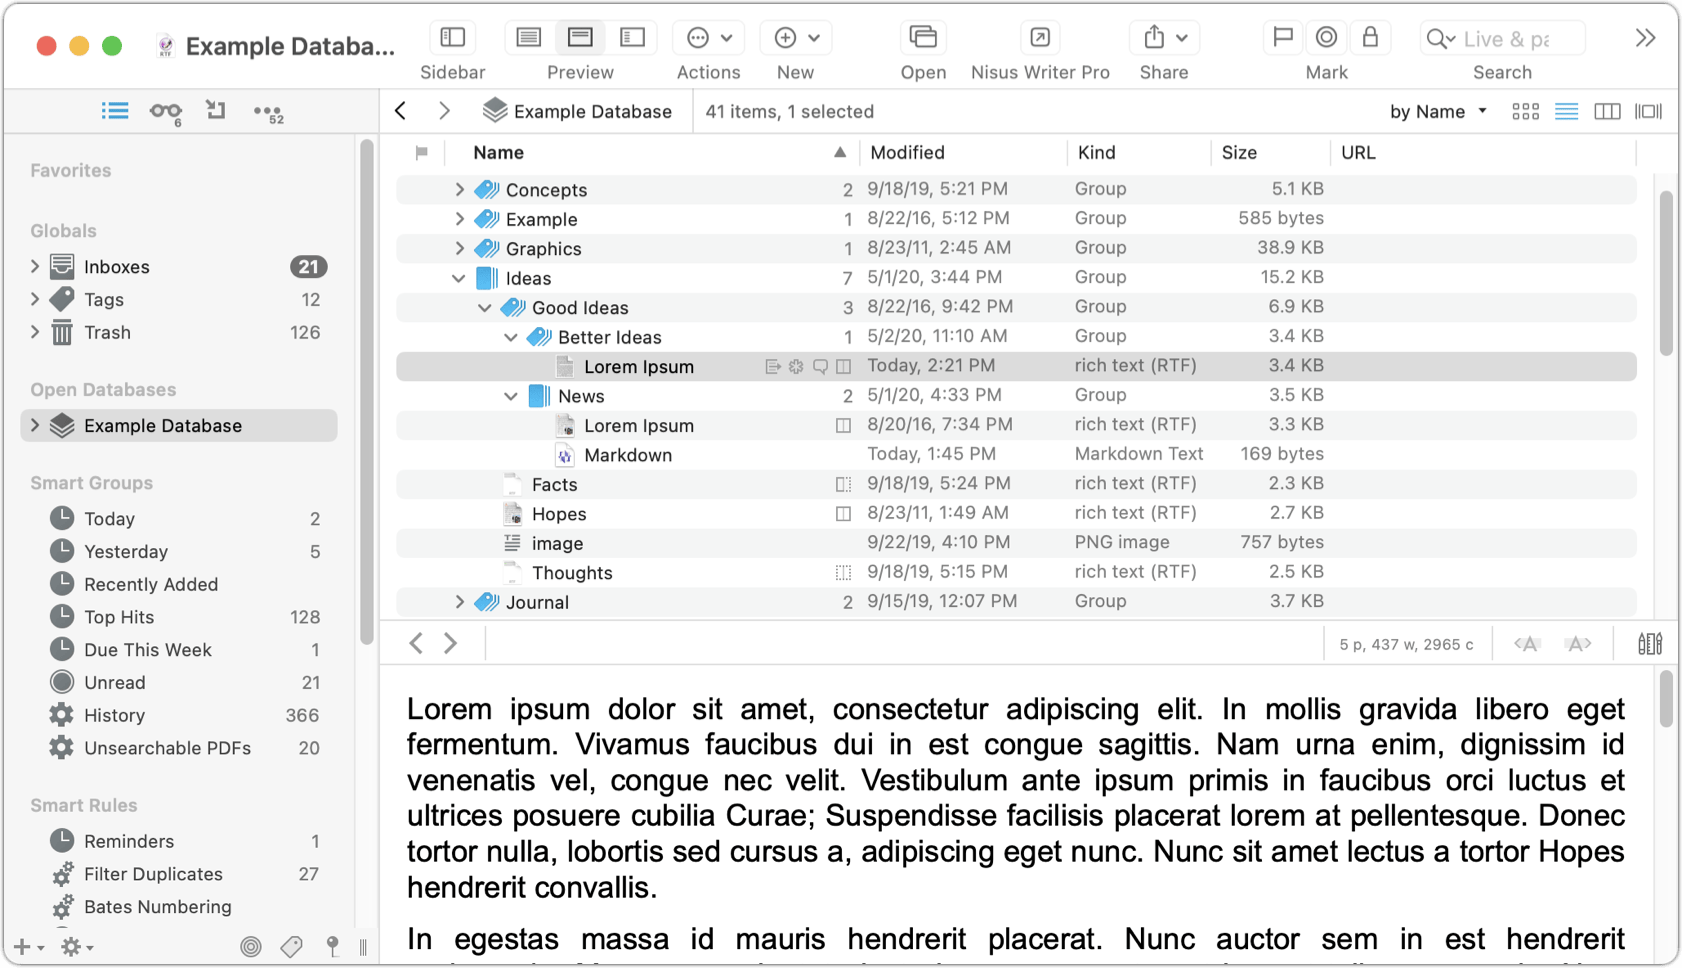
View as List
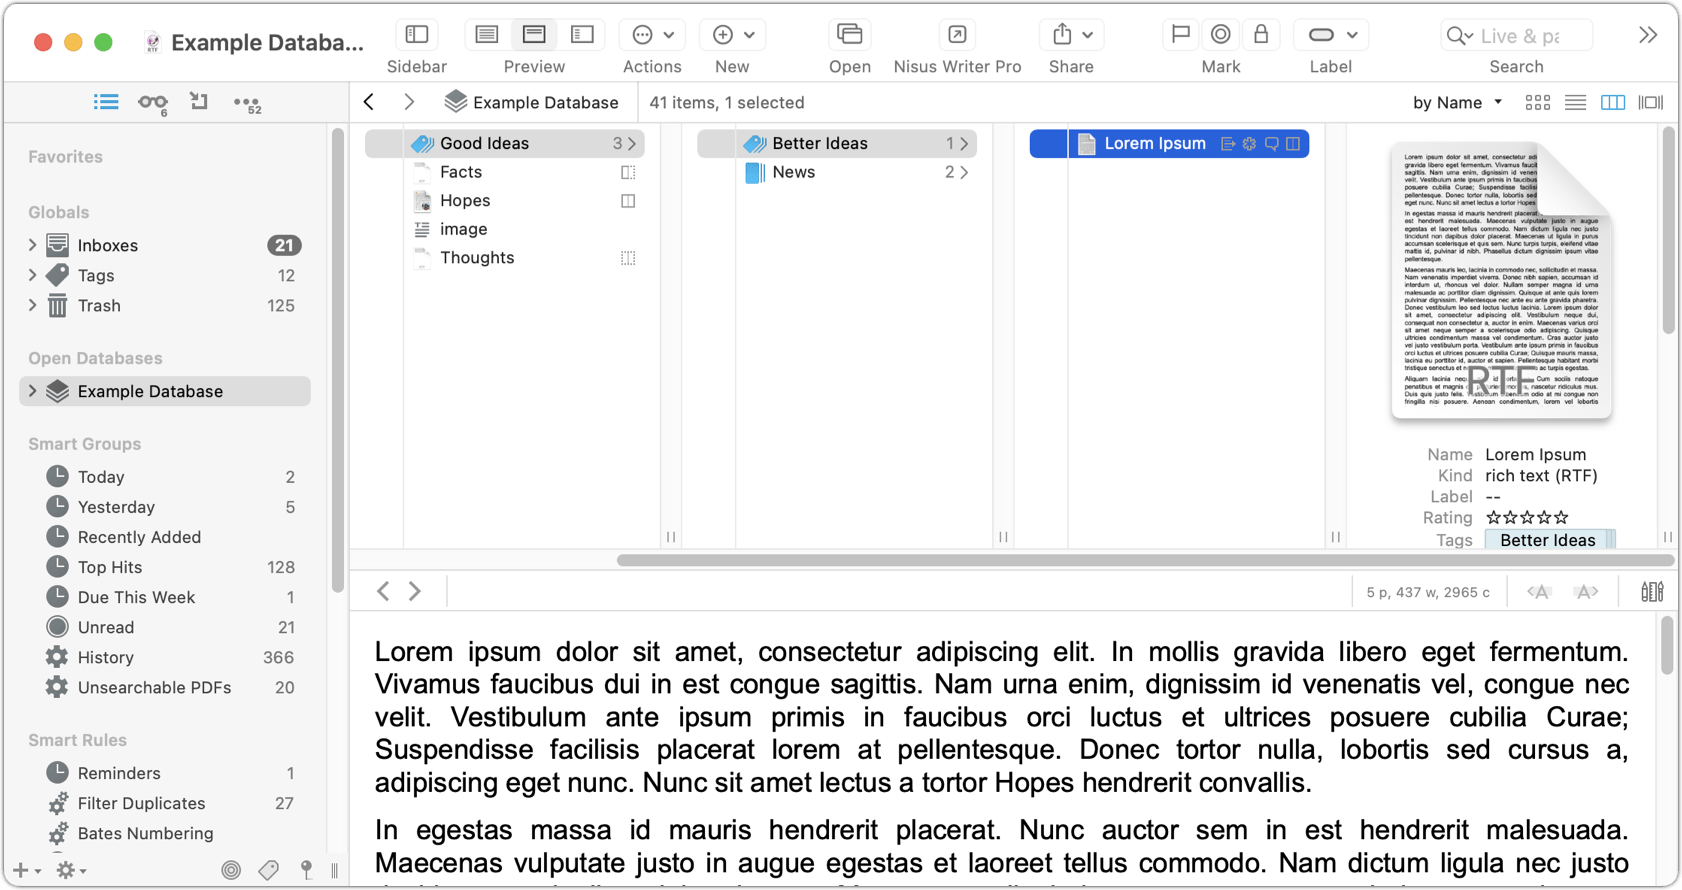
List view (Figure 15) provides more detail about each document, as well as a hierarchical view of all your groups. By default, List view shows Name, Modified (date and time), Kind, Size, and URL columns. To change which columns appear, choose a column name from the View > List Columns submenu. As you might expect, you can sort by a column by clicking its name; reverse the sort order by clicking again; drag and drop to rearrange columns; and resize columns by clicking the border between two adjacent column headers and sliding the pointer left or right.
View as Columns
Column view (Figure 16) lets you quickly navigate a deep hierarchy of groups without losing your place or running out of room on the screen.
As in the Finder, you can drag the dividers between columns to resize them individually, Option-drag them to change the width of all columns at once, or double-click a separator to auto-resize to the width of the longest name. You can also sort by any criterion you prefer. To change the sort criterion, choose a command from the View > Sort submenu; choose Ascending or Descending from this menu to reverse the sort order.
View as Cover Flow
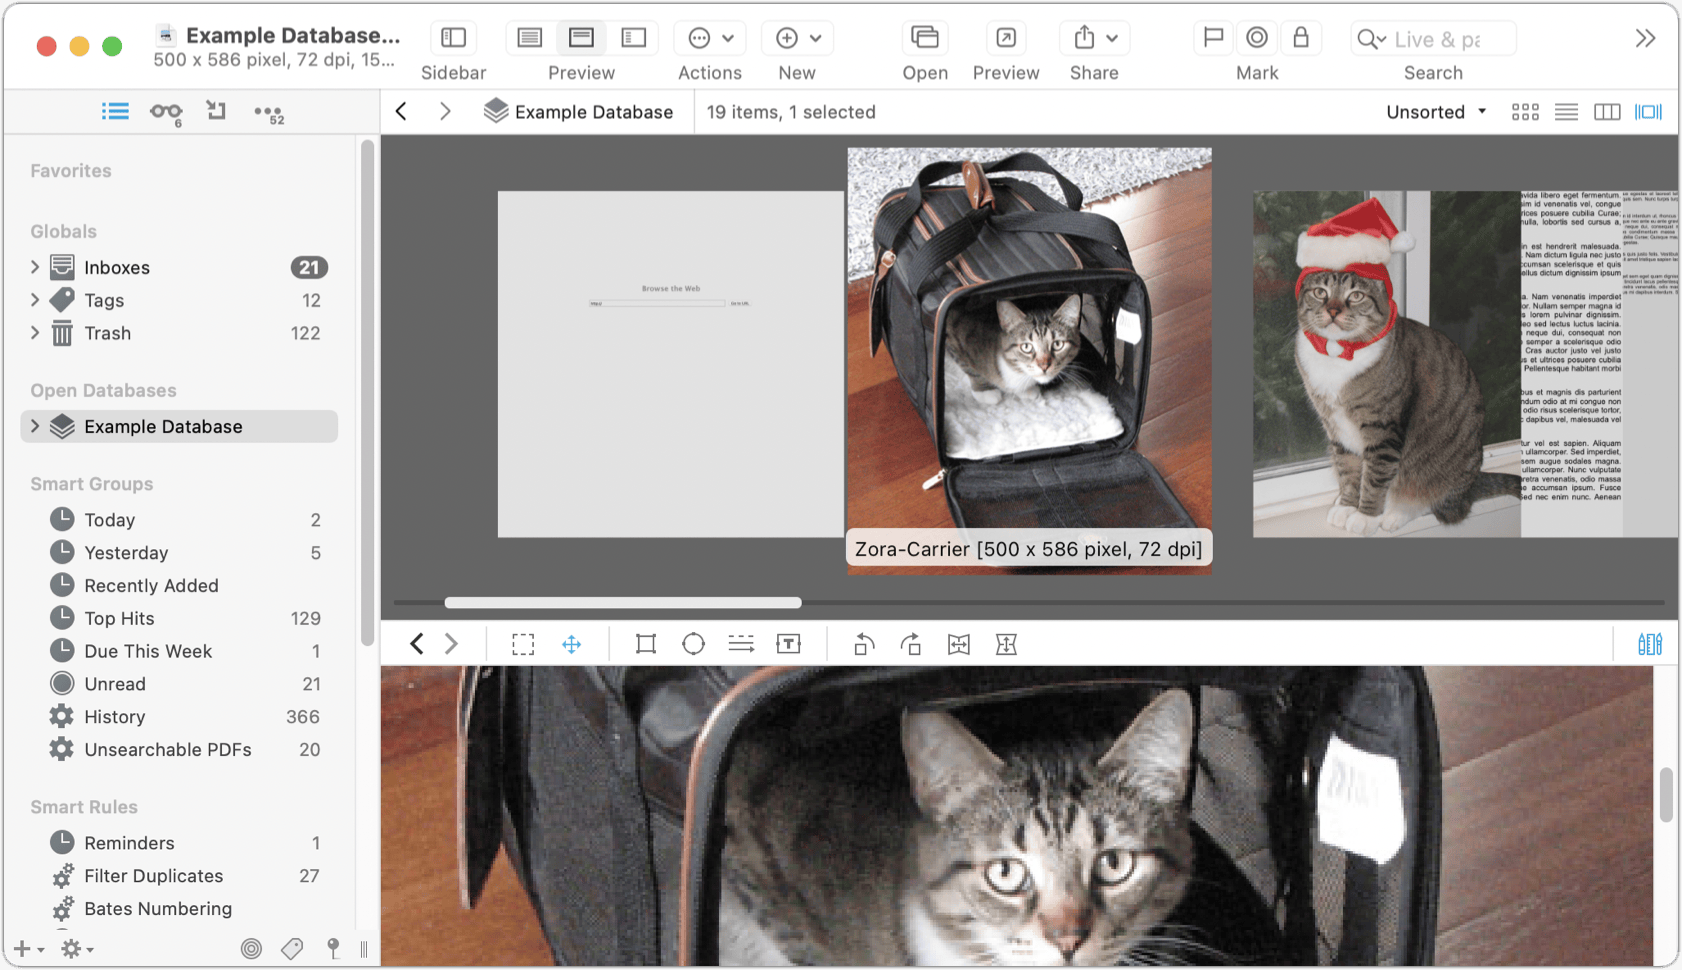
Cover Flow (Figure 17) displays a large thumbnail of each document in the current group in a horizontally scrolling list; it’s useful primarily for graphics. The selected item (in the middle; a bit larger than the others) shows a tooltip with the document’s name and resolution; a full-size image appears in the view/edit pane.
Path Bar
Just above the item list is a horizontal strip with two sections divided by a vertical line. The left-hand section is the path bar, which helps you navigate within your database. It shows the item currently selected in the sidebar and a “bread crumb” path of enclosing groups, if any. You can click any item in this path to jump to that group, right-click (or Control-click) it to see a contextual menu with Open and Reveal commands, or ⌘-click it to open it in a new window. There are also back ![]() and forward
and forward ![]() icons, which work like those in a web browser for moving to previously viewed documents. (You can right-click, Control-click, or click and hold the icons to see a list of earlier or later locations; ⌘-click an item in the history list to open it in a new window.)
icons, which work like those in a web browser for moving to previously viewed documents. (You can right-click, Control-click, or click and hold the icons to see a list of earlier or later locations; ⌘-click an item in the history list to open it in a new window.)
Information Bar
Immediately to the right of the path bar is the information bar, which (as the name suggests) displays information about the currently selected item(s), such as the number of items in the current view and the number of items (if any) currently selected.
On the right side of the information bar is a pop-up menu to change the sort order (using any of dozens of pieces of metadata) and icons to switch between Icon, List, Column, and Cover Flow views.
View/Edit Pane
The view/edit pane (sometimes referred to as the preview) is the portion of the window (labeled ⓺ in Figure 5) that displays the contents of the selected document, if any. In most cases, it lets you edit it, too. Although you can double-click any document to open it in its own window if you prefer (or in an external app, depending on the setting of Settings/Preferences > General > Interface > “Double-click opens documents externally”), you can often do all your editing right in the view/edit pane. I discuss editing further (whether in the view/edit pane or otherwise) in Edit Documents in DEVONthink.
As in the Finder, web browsers, and most document-based apps, the view/edit pane can have multiple tabs, each showing a different document. The tab bar is normally hidden if only one document is open; to display it all the time, go to Settings/Preferences > General > Interface and check “Always show tab bar.” Most controls for working with tabs (such as New Tab and Close Tab) are found on the Window menu.
You can drag tabs left or right to reorder them; scroll through a large number of open tabs; close a tab without switching to it first; and, in Big Sur or later, use the spring-loading effect (as in the Finder) to drag something onto a tab, wait until it opens, and then continue dragging it to a specific location.
To open multiple documents, each in its own tab, hold down Option and choose Data > Open In Tabs (⌘-Option-O). (If the view/edit pane is not visible when you use this command, DEVONthink opens a separate document window, with each document in a different tab.)
Widescreen
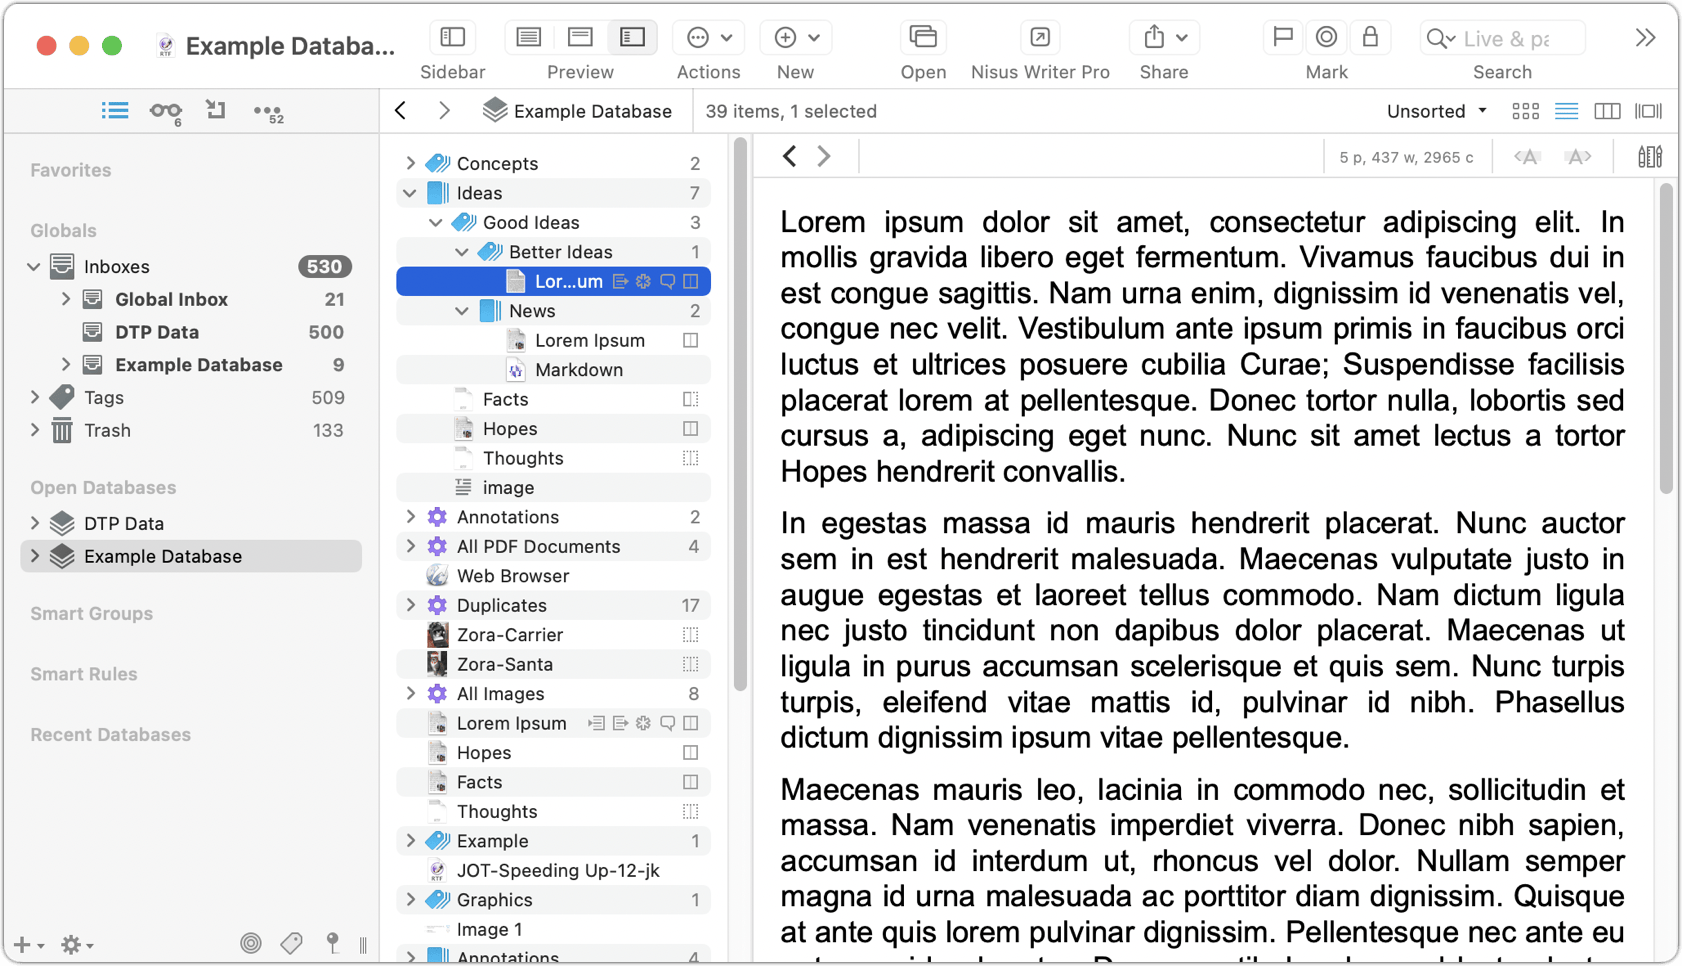
The widescreen preview option (View > Widescreen or ⌘-7), positions the view/edit pane on the right side rather than at the bottom. This arrangement makes more efficient use of screen real estate on large monitors (especially widescreen monitors). Figure 18 shows a widescreen preview along with List view; compare with Figure 15, which shows the same thing with a standard preview.
Full Screen
If you find screen clutter distracting, you can use either of two Full Screen modes. First, you can opt for macOS-style Full Screen mode, which applies to the entire DEVONthink window; to enter this mode, choose View > Full Screen > Window (⌘-Control-F) or click the Full Screen ![]() icon in the upper-left corner of the window. To leave Full Screen mode, press Esc.
icon in the upper-left corner of the window. To leave Full Screen mode, press Esc.
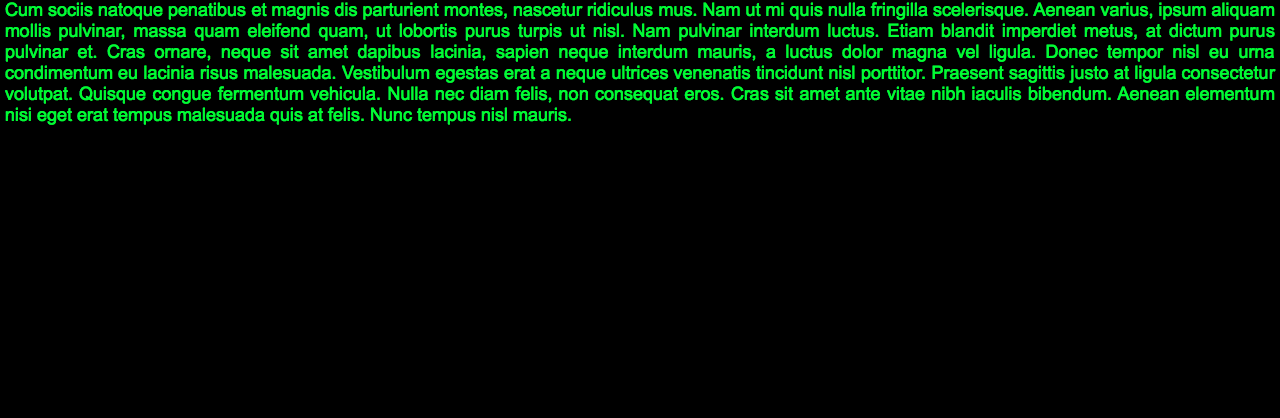
Alternatively, you can use DEVONthink’s document-specific Full Screen mode. When you choose View > Full Screen > Document (⌘-F7), the selected document fills your entire screen; in the case of plain text and rich text documents, your entire screen turns black by default while text becomes bright green (Figure 19). To leave Full Screen mode, press Esc.
To adjust Full Screen mode’s font, size, colors, and text width, go to Settings/Preferences > Editing and make changes in the Full Screen section.
Navigation Bar
At the top of the view/edit pane is a narrow strip of controls called the navigation bar (Figure 20; also labeled ⓻ in Figure 5). The selection of controls on the bar varies according to what type of document (if any) is selected and its current state.

In general, the navigation bar contains controls for (you guessed it) navigating within the view/edit pane, such as visiting the next or previous page within a web browser or PDF, as well as previous locations elsewhere in DEVONthink (using the same back ![]() and forward
and forward ![]() icons as on the path bar). One other control that appears consistently on the right side of the navigation bar is the Show Editing Bar
icons as on the path bar). One other control that appears consistently on the right side of the navigation bar is the Show Editing Bar ![]() icon, which replaces the contents of the navigation bar with controls appropriate for editing the document type selected (e.g., one set of controls for text, another for graphics, and yet another for PDFs). I say more about this later, in Edit Documents in DEVONthink.
icon, which replaces the contents of the navigation bar with controls appropriate for editing the document type selected (e.g., one set of controls for text, another for graphics, and yet another for PDFs). I say more about this later, in Edit Documents in DEVONthink.
Tag Bar
Any document in a database can have one or more tags to help associate it with related content. One way to see those tags is to use the tag bar (Figure 21), which is labeled ⓼ back in Figure 5 (see Tag Documents for more). Group tags ![]() (that is, tags representing group names) show extra tabs on the right side; ordinary, non-group tags
(that is, tags representing group names) show extra tabs on the right side; ordinary, non-group tags ![]() do not.
do not.

The tag bar can appear at the bottom of the view/edit pane, whenever the view/edit pane is visible. To toggle it on or off, choose View > Show Tags or View > Hide Tags (⌘-Control-Option-T), or click the Show/Hide Tags ![]() icon on the toolbar.
icon on the toolbar.
Inspectors
Just as the sidebar pane appears on the left side of the window and may display any of several different sidebars, the inspector pane (labeled ⓽ in Figure 5) appears on the right side of the window and may display any of seven different inspectors, depending on which icon is selected at the top. From left to right, they’re the Info ![]() inspector, the Annotations & Reminders
inspector, the Annotations & Reminders ![]() inspector, the Content
inspector, the Content ![]() inspector, the Document
inspector, the Document ![]() inspector, the Concordance
inspector, the Concordance ![]() inspector, the See Also & Classify
inspector, the See Also & Classify ![]() inspector, and the Search
inspector, and the Search ![]() inspector. (The currently selected icon appears in blue.) I describe each of these ahead.
inspector. (The currently selected icon appears in blue.) I describe each of these ahead.
Info Inspector
Besides listing statistics about the current document, this inspector (Figure 22) lets you rename the document; exclude it from classification, search, See Also, and tagging; modify labels and tags; see and navigate to duplicates and replicants; add aliases; and lock or unlock the document. I discuss many of these activities elsewhere.
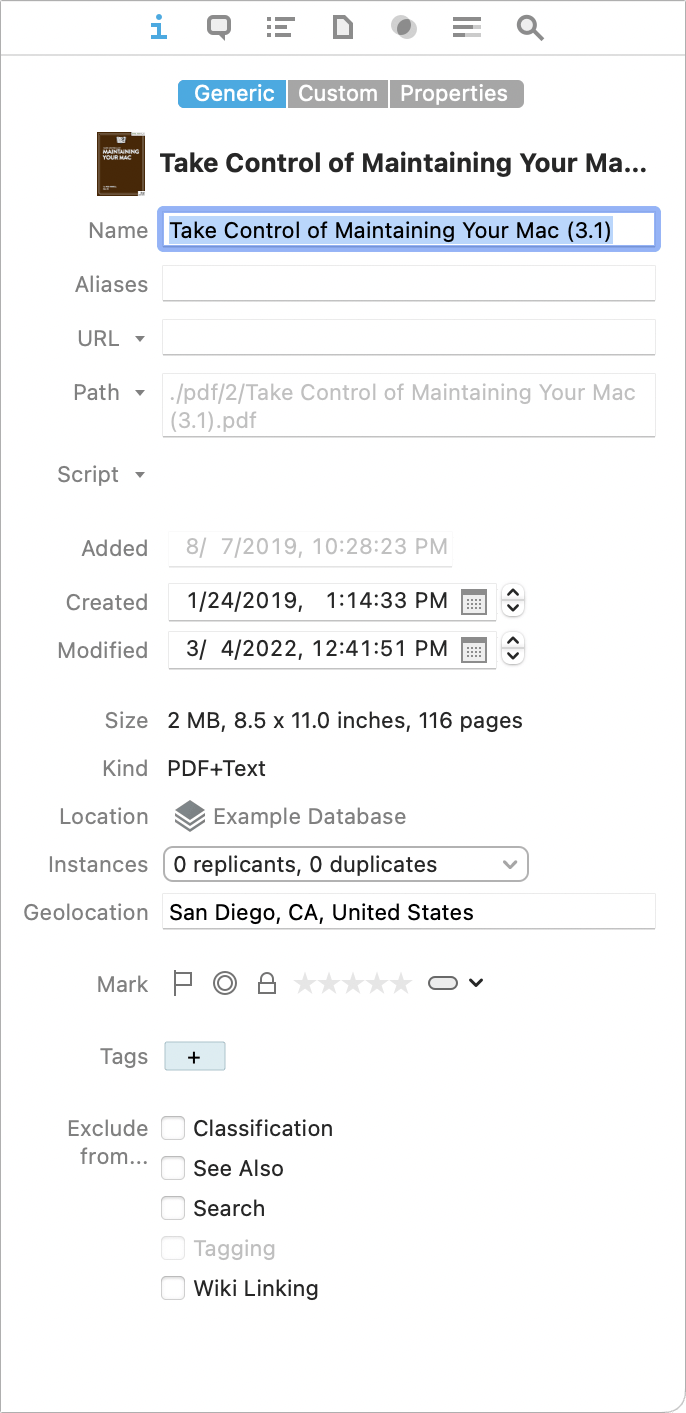
The Properties tab, which was located in the Document inspector before version 3.9, includes items such as author, title, subject, and keywords.
DEVONthink Pro and Server expand the capabilities of the Info inspector by adding a Custom tab, where you can add any of numerous built-in or user-defined metadata types. To learn more about metadata generally and custom metadata specifically, refer to Work with Metadata, later in this book.
In case the inspector is hidden or displaying a different pane, you can also display the information from the Info inspector in a popover by selecting a document and choosing Tools > Get Info (⌘-Shift-I) or clicking the Info ![]() icon on the toolbar.
icon on the toolbar.
Annotations & Reminders Inspector
The Annotations & Reminders inspector (Figure 23) provides the tools to set reminders (including alarms) about the current document (see Use Reminders), view or add Finder comments, and add or edit annotations (separate files containing comments about this file; see Template).
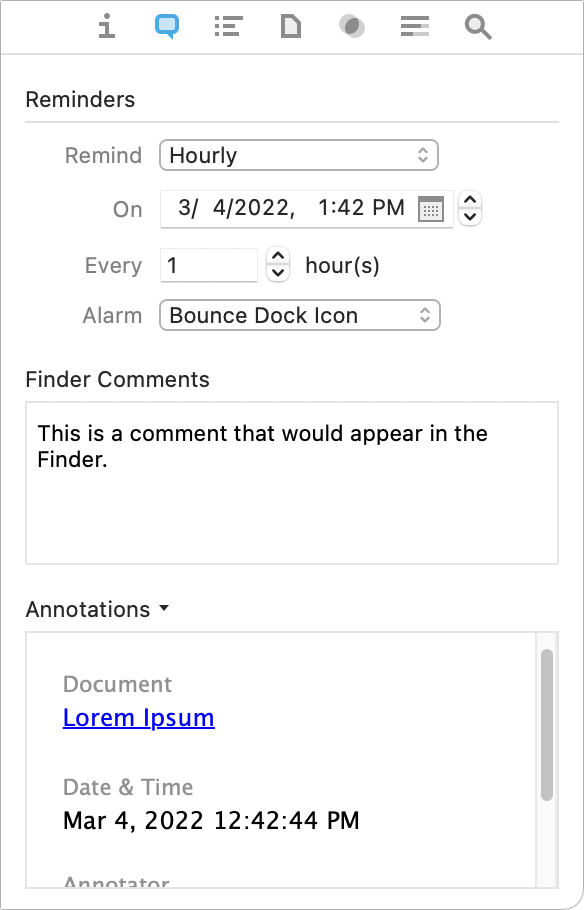
In this context, an annotation is a text note you add to a document, group, tag, or other item. You can type your notes in the Annotations field here or in the field that appears when you choose Tools > Get Info (⌘-Shift-I) and click the Annotations & Reminders ![]() icon. DEVONthink stores these annotations as separate documents (annotation files) that are linked to the originals; you can see them, for example, in the Annotations smart group at the top level of the database.
icon. DEVONthink stores these annotations as separate documents (annotation files) that are linked to the originals; you can see them, for example, in the Annotations smart group at the top level of the database.
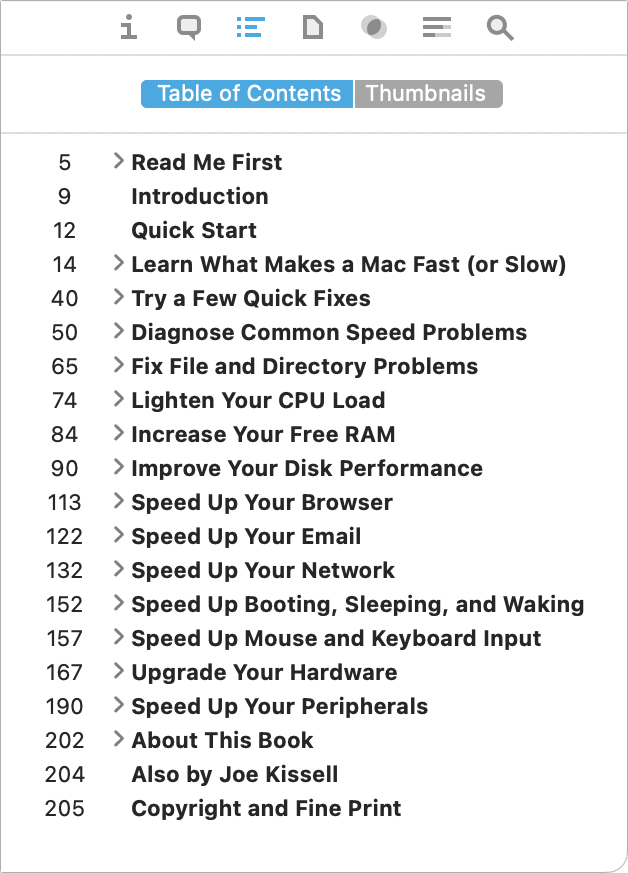
Content Inspector
The Content inspector displays the table of contents for PDF, Markdown, and EPUB documents that include one; it also shows thumbnails for PDF documents (Figure 24). Both the table of contents and the thumbnails are live, so you can click an item to navigate to that point in the selected document.
Document Inspector
The Document inspector (Figure 25) shows a wide variety of document-level metadata.
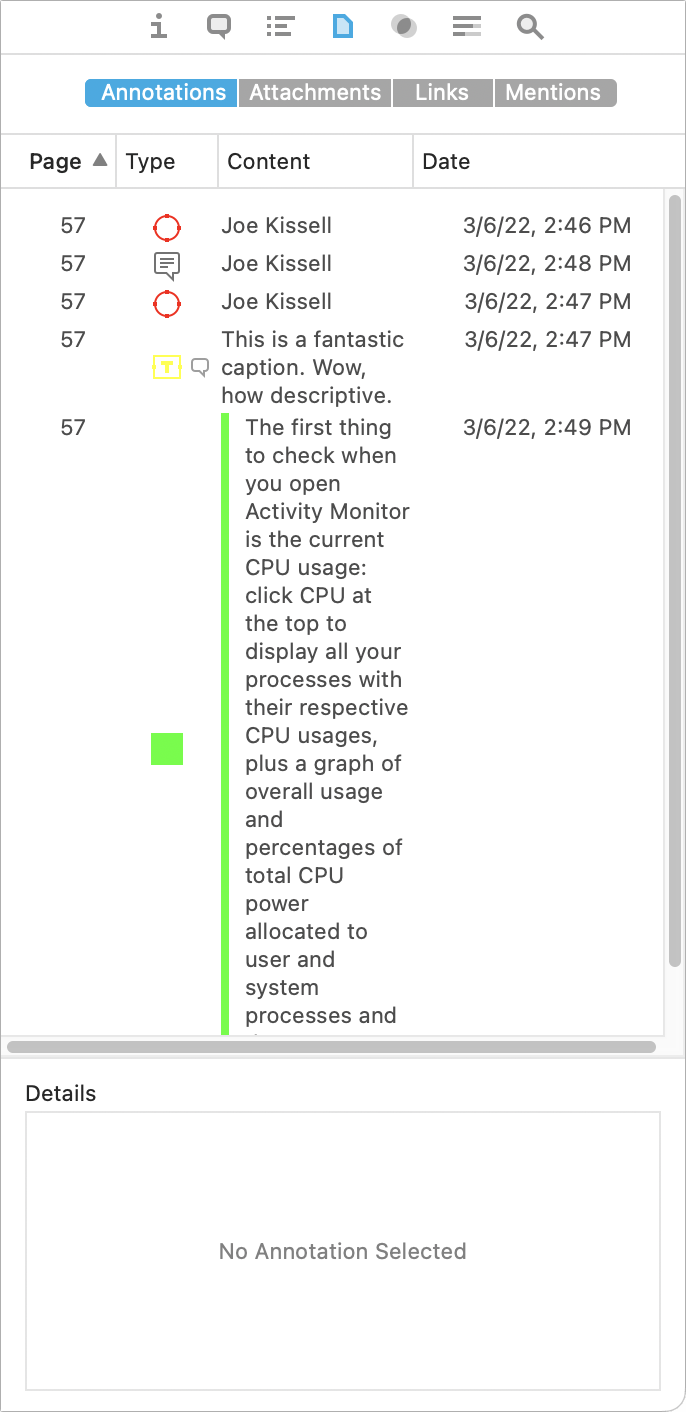
The Annotations tab shows highlights in RTF files and PDF annotations (not to be confused with DEVONthink’s annotation files); the Attachments tab displays attachments in files that support them; the Links tab shows any hyperlinks found in PDF and RTF files, as well as in web archives and other web-based documents (outgoing links are found at the top under the Links heading, while incoming links are found at the bottom under the Incoming Links heading; see Work with Item Links and WikiLinks for more on using links); and the Mentions tab shows other documents that mention this one (by including this document’s name, prepended with an @ sign, somewhere in the text).
Concordance Inspector
Do you wonder whether you’re overusing certain words, or are you curious about how often certain terms in a document occur relative to other terms? Select the document and choose Tools > Inspectors > Concordance > List or click the Concordance ![]() icon in the inspector. The Concordance inspector (Figure 26) lists every word in your document by frequency (number of occurrences).
icon in the inspector. The Concordance inspector (Figure 26) lists every word in your document by frequency (number of occurrences).
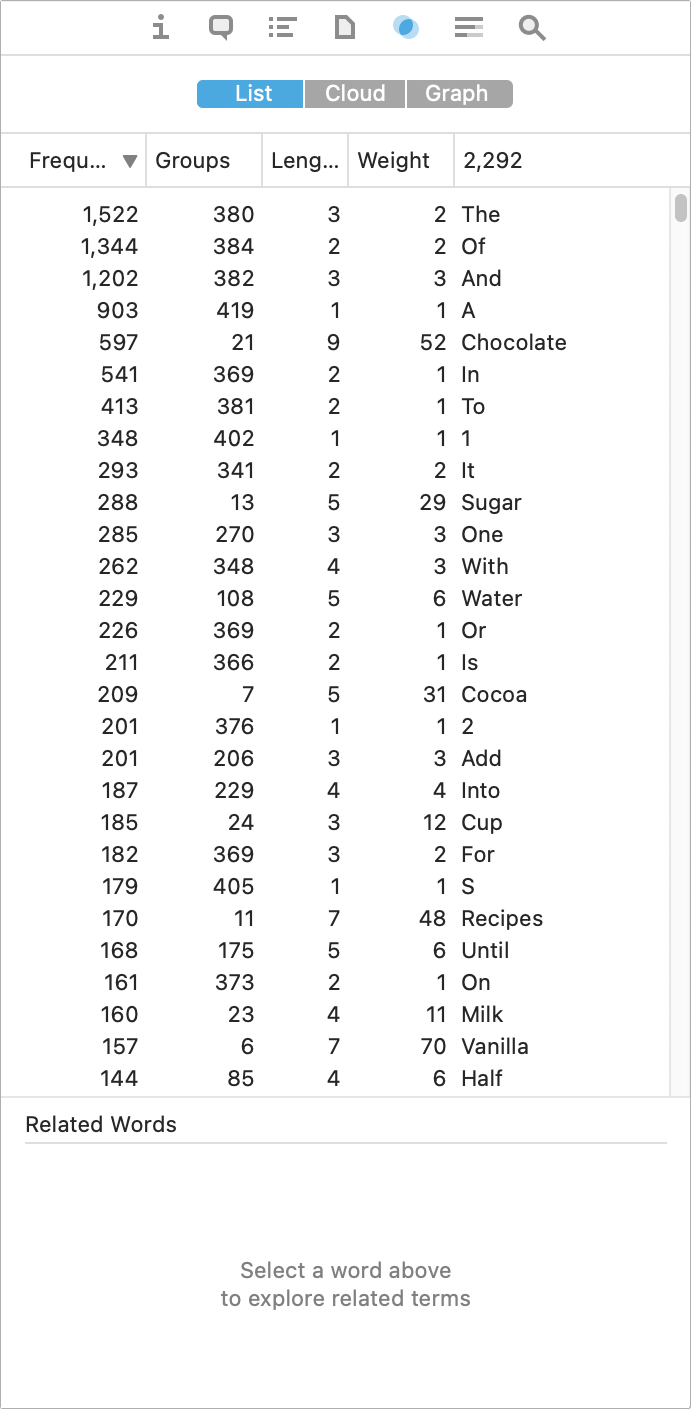
I discuss the Concordance in more detail later, including how to use the feature across multiple documents—or even an entire database—and the Cloud and Graph options (see Search Using the Concordance).
See Also & Classify Inspector
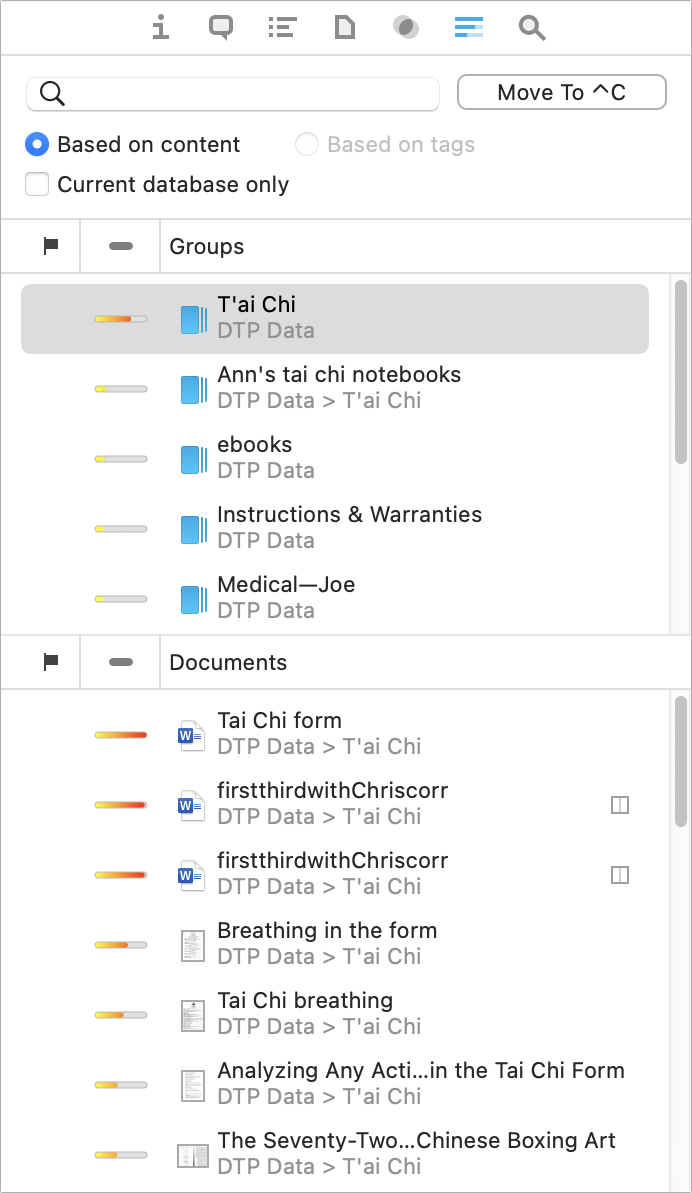
One of DEVONthink’s coolest and most powerful features is found in the See Also & Classify inspector. The See Also and Classify features use artificial intelligence to help you determine where a document should go and what other documents may be related to it.
To open this inspector (Figure 27), select a single document and then choose Tools > Inspectors > See Also & Classify (Control-S). You can use the controls just under the search field to choose whether the analysis is done by content or (if applicable) by tags, and whether it’s confined to the current database. The next portion of the inspector lists groups that may be a good place to store the document. The bottom portion lists other documents that have similar contents to the one you’ve selected. I discuss these features further in Classify Documents.
Search Inspector
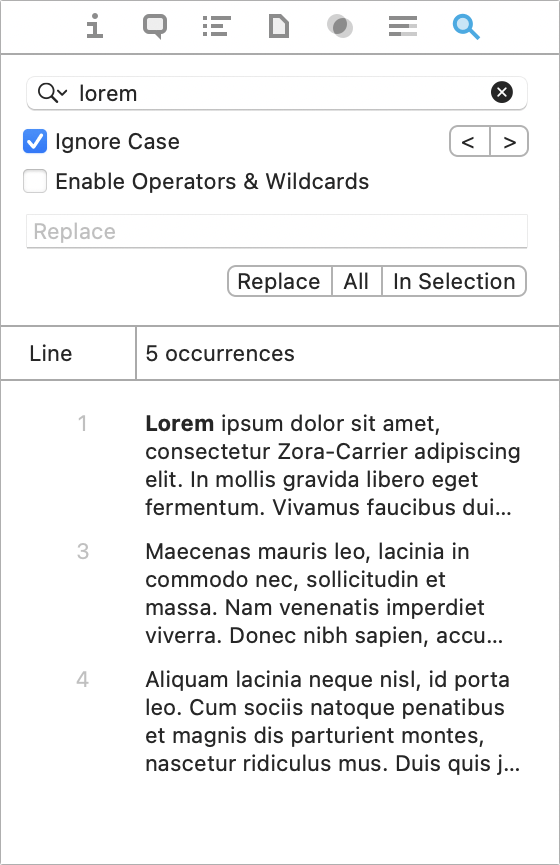
DEVONthink offers several ways of searching, but the Search inspector (Figure 28) is the place to go if you want to search and/or replace within the current document. Matches are listed at the bottom of the inspector and highlighted in the view/edit pane. To learn more about searching within a document, see Search Within a Document.
Panels
A few windows in DEVONthink, called panels, look different from normal windows or popovers and provide extra info or special features. The following are the panels you’re likely to see most frequently.
Activity
On the Activity panel, you can follow the progress of tasks that take a while to complete. To display this panel if it’s not visible, choose Window > Activity (⌘-Option-A). Examples of what it may show:
When you sync your database with another location (see Sync DEVONthink Databases), the Activity panel shows you the syncing progress. (If you’re syncing directly between two Macs, it appears on both.) Ordinarily it disappears when the sync is complete.
In DEVONthink Pro or Server, when you choose Data > OCR > “to searchable PDF” (or configure the app to perform OCR automatically on newly scanned documents), the Activity panel appears, showing the progress of each document as it is recognized and any documents waiting for their turn.
Download Manager
When you download a file from the web using the built-in web browser in DEVONthink Pro or Server, a Download Manager panel appears, much like the one in Safari or Firefox. It shows your current, pending, and recent downloads and lets you stop or redirect them.
To open this window, choose Window > Download Manager.
Log
The Log panel, which you can toggle by choosing Window > Log, lists errors and other status messages generated during DEVONthink’s normal activities. These may include notices that documents have been imported or exported, for example, or that the database has been converted from an older format.
If you find the Log panel intrusive and want to prevent it from appearing unless you explicitly display it, uncheck the “Show log automatically” box in the lower-left corner of the Log panel. (DEVONthink ignores that setting if it needs to display information on a critical error.)
Document Windows
If your monitor is sufficiently large, you may find it comfortable to do all your viewing and editing right in the view/edit pane of DEVONthink’s main window. However, it’s often more convenient to view, edit, or create documents in their own windows, which also provide extra toolbar icons for your convenience.
To open a document window, double-click any document (or choose a command from the Data > New submenu to create a new one from scratch). The appearance of the window and the controls available on the toolbar vary according to the type of document you’re editing. For example, Figure 29 shows the window for a rich text document.

Inboxes
The next-to-last item I want to introduce you to on this interface tour is the inbox, which as I’ve already mentioned is meant as a storage place for newly imported or indexed documents you haven’t yet sorted. In this respect it’s rather like the inbox in your email app. (Just as I recommend trying to keep one’s email inbox empty most of the time, I recommend the same for DEVONthink—the app is much more useful and effective when you group, or at least tag, each document.)
Because DEVONthink supports multiple databases, it has multiple inboxes, too—one for each database, plus a global Inbox (which is technically a separate database). Even if you’ve only ever created a single database, you still have two inboxes, because the global Inbox is always present. This fact can be either a blessing or a curse, depending on your point of view.
Your global Inbox appears at the top of the sidebar under Globals, which means that if your sidebar is hidden, you can’t access it. (Choose View > Navigate, click the Sidebar ![]() icon on the toolbar, or press ⌘-Option-1 to display the sidebar.)
icon on the toolbar, or press ⌘-Option-1 to display the sidebar.)
So, when you import a new document, where does it go—the global Inbox or the one for a particular database? It depends primarily on your preferences, as I discuss later in Decide Where Your Documents Will Go.
Workspaces
Workspaces let you save arrangements of open databases, windows, documents, and tabs—plus the currently visible inspector, any selected sidebar filter, view selections, and advanced search options—and recall them instantly. If you rearrange items on your screen (or switch to a different workspace), you can return the display to its previous state with a single menu command.
Here’s what you can do with workspaces:
Create a workspace: Choose Go > Workspaces > Add. Enter a name for your workspace and click OK.
Restore an existing workspace: Choose Go > Workspaces > Name of Workspace. You can also press ⌘-Option-number, where the number corresponds to the order in which workspaces are listed at the bottom of the Go menu.
Modify a workspace: To update an existing workspace to reflect the current arrangement of on-screen elements, choose Go >Workspaces > Update “Name of Workspace”.
Edit a workspace: To edit a workspace’s name or order in the Go menu, or to delete it, choose Go > Workspaces > Edit. Then:
To rename a workspace, double-click its name, enter a new name, and press Return.
To rearrange workspaces, click and drag.
To delete a workspace, select it and click the minus
 button.