Chapter 5. Streaming Analytics
Analytics is an end goal of many streaming integration use cases. You can perform in a cloud data warehouse or by using machine learning on a large-scale data store. You can do it using an on-premises Hadoop infrastructure, or in a cloud storage environment. You could utilize a document store or another store like Azure Cosmos DB or Google Cloud Spanner. It could even be done writing into a database.
The most important point is that people want their data to be always up to date. So, when you’re analyzing data, you should always possess the most recent data. And a primary driver of streaming analytics is that people want to do analytics on much more current data than was previously possible.
With ETL systems, people were satisfied with data that was a few hours or even a day old because they were running end-of-day reports, and that was the data that they wanted to see. With streaming systems, they want insight into the most current data. This is true whether the data is being analyzed in memory or is landing somewhere else.
However, getting real-time insights from data is typically not possible if the data needs to land somewhere (Figure 5-1). It’s not possible to get within a few seconds – much less a subsecond from changes happening in the source system to being delivered into a target system that way. And it’s still going to be necessary to trigger the analytics in that target platform somehow. Perhaps you’re pulling it, or maybe you’re running analytics reports, but you still must trigger it.

Figure 5-1. Streaming integration enables real-time analytics for cloud, applications, and historical data
In streaming analytics, the incoming data itself in the data stream is what triggers the analytics because it’s continuously happening. If the goal is to have immediate notifications of anomalies, immediate insight into what’s happening within data, or immediate alerts for unusual behavior, then streaming analytics is essential.
In this chapter, we discuss the most important aspects of streaming analytics, and how to get the most out of your data on your streaming platform.
Aggregation
Aggregation is any process in which information is gathered and expressed in a summary form. Because a data stream by definition is unbounded and infinite, doing aggregations over data streams is challenging. Suppose that you want to know the count and sum of a particular value in an accounts data stream. Both of those numbers are going to keep on increasing infinitely because data in the stream will just keep on coming. It is generally more useful to aggregate functions over a bounded set of that data.
Going back to the example of the order item stream, you might want to determine the top 10 selling items in an ecommerce store. In a database, that query is easy. You select the sum of the quantity, group by item ID, order by the sum of the quantity limit 10, and you have your top 10 selling items.
To change that query to know what sold most in the past five minutes, it would be necessary to put some limiters over timestamps. That query would need to be rerun whenever you wanted to see that value. In a streaming system, you can do time-constrained queries much more easily by utilizing windows, as discussed in Chapter 4.)
To get an answer using this particular example, it would be necessary to create a window that holds five minutes’ worth of data from the order item stream, and group by the item ID. Whenever anything changed, whenever any new data came into that window, that aggregate query would be rerun and it would show the sums all of the quantity sold per item in the last five minutes.
The advantage is that it’s no longer necessary to keep running that query and changing the date premises. Everything is automated. That’s why streaming analytics systems are much better suited to any analysis that is based on time. Streaming analytics is the optimal solution for time-series analysis.
Being able to group streaming data by some factor, aggregate over it, have it continually change, and have an output every time it changes, is key to aggregation. And it is also key to the summarization and analytics capabilities of streaming analytics. There are many different ways that we can do this, depending on the use case. It’s even possible to have intermediate storage where the results of an aggregation can be stored in another window, and then you query that window.
On a practical level, with aggregation, it often makes sense to work backward and reverse engineer what actions to take based on the desired outcome. For example, if you want a dashboard visualization that shows in real time the top 10 items being sold based on changes in the underlying database table, you’d typically use that end result to determine which queries need to be written.
Going further with that example, now that you have visibility into top-selling items every five minutes, it might make sense to store those aggregates in another window. By storing the last hour’s worth on a five-minute basis, it’s possible to do additional queries over that. For example, you might want to be alerted if an item increases or decreases in sales by an anomalous amount within any five-minute period.
Pattern Matching
Pattern matching used to fall into a separate market niche called complex event processing. The purpose of complex event processing was to look at numerous small-grained business events and understand what was happening based on a pattern in those events (see Figure 5-2). With pattern matching, you’re looking for data in a sequence of events from one or more data sources that corresponds to some particular pattern.
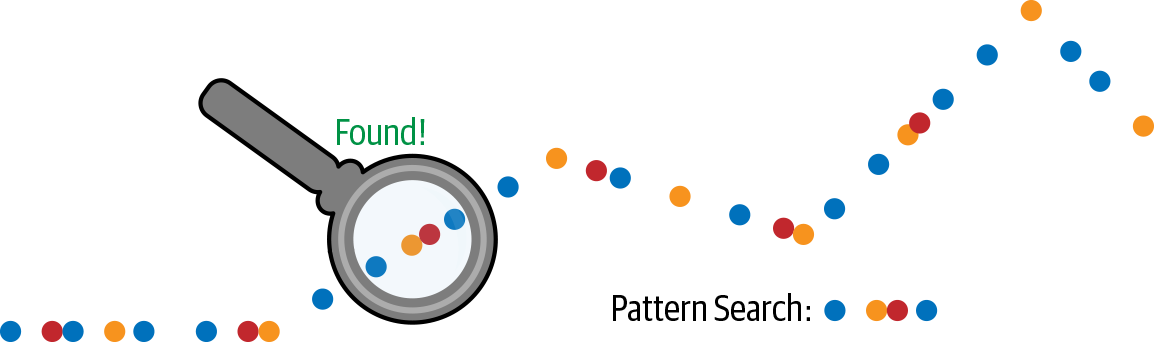
Figure 5-2. Understanding business events using pattern matching
For example, sensor information from an Internet of Things (IoT) device could include the temperature, pressure, flow rate, and vibration. If the temperature rose 10 degrees in that device, that might be within safety parameters. If the flow rate slowed, or the pressure increased, by a certain amount, that might also be within guidelines. However, it might be an indicator of trouble if the temperature rose by 10 degrees, the pressure went up by 10% and the flow decreased by 5% – all within a 10-second period.
By being able to look across those different sources and defining that pattern, an alert could be triggered.
Now the system isn’t simply looking at one event or even the aggregation of events. It’s looking at a sequence of events that meet exact criteria. We can define these happenings ahead of time, and then the data streams can be fed through the pattern matching. They will then output a result whenever the pattern matches.
Complex event processing is an essential part of streaming analytics and any streaming data platform must be able to do it to be considered a complete solution.
Statistical Analysis
Statistical analysis is when you apply statistical methods to real-time data. This is easy to do within a database table. For example, to calculate an average value, you simply select average column value.
However, generating a moving average by time over a database table is very difficult. Database tables aren’t designed to do that. The query would need to be quite complex.
In a streaming system, doing statistical analysis on streaming data means utilizing the aggregate querying capability, but for statistical functions. We’ve already discussed aggregation; about being able to do a summary of values that were in a five-minute window. By replacing that sum with an average, now you have a five-minute average.
If, alternatively, you use a sliding window for which every time a new value comes to the window the output changes, the average now becomes a true real-time moving average. Similarly, you can do other statistical analyses.
Of course, certain things are impossible in real-time mode. The mean can be calculated, for example, but not the mode or the median. Those types of analyses don’t work in a real-time data system. However, performing standard deviations or linear regressions certainly do work.
Imagine, in addition to doing a five-minute moving average, you’re also doing a five-minute moving standard deviation. It’s possible to check for a value that exceeds two times the standard deviation above the average or below the average, then an alert will be triggered because it’s an anomalous value.
Thus, based on simple statistical analysis, it’s possible to do interesting anomaly detections.
Integration with Machine Learning
Machine learning is a process by which computer systems can learn and improve from experience without being explicitly programmed. By inferring from patterns in data and generating algorithms and statistical models, computer systems can perform tasks without being given explicit instructions. In short, they learn from the data that they are given.
What we’ve defined up until now are analyses that need to be specifically written. For example, you must specifically say, “this is the aggregation I want to perform,” or “this is how I want to calculate these statistics and how I want to compare them.” Or you must specifically say, “this is the exact pattern that I’m looking for, that if this pattern occurs, I want to trigger an alert.”
A machine learning algorithm is different. The main thing about machine learning is that you don’t necessarily know what you’re looking for. The rules about what is “normal” are not known. It hasn’t yet been determined what anomalous behavior means with regard to a particular data set. By integrating a trained machine learning model into a streaming analytics data flow, you would feed the current values to the model and then wait for results.
Alternatively, a model might be trained to understand the normal relationship between a set of variables in a data event. Then, by feeding it a set of variables, it can output what is normal versus what is unusual.
There’s obviously a lot more that can be done using machine learning. Instead of simply having the two categories of normal and unusual, there could be different clusters that represent different types of behavior.
For example, if attempting to analyze a network, a machine learning algorithm could be trained to pick up on a number of different behaviors: normal user behavior, normal machine behavior, virus behavior, an external breach, or an external hack type of behavior. By classifying these behaviors, the machine learning model could trigger an alert for any events that fit into those categories.
The difference between streaming integration with machine learning versus other approaches is that machine learning is best suited for when you don’t know what to look for in the data. You simply don’t know how to write the rules.
The biggest challenge with integrating machine learning into a streaming environment – also known as operationalizing machine learning – is the way machine learning has traditionally worked. Historically, data professionals such as data analysts or data scientists were given a large volume of raw data. They would then spend, on average, 80% of their time preparing that data: cleansing it, manipulating its structure, enriching it, and labeling it.
In other words, they would perform a lot of data manipulation ahead of time on the raw data to get it into the appropriate form for training. They would then train the model using a sample of that data. Only after all that time and effort would they have a well-trained model that represented the sample data.
Ideally, they should be able to give that model back to IT so that it can be run against the real-time data that’s coming in.
But there’s a problem. The model was trained on the prepared data that had various features extracted and was cleansed, enriched, and filtered. A lot of different tasks were performed to process that data before the model was trained. As such, the raw data that IT has might look nothing like the processed data used to train the model. There’s a mismatch. A machine-learning model has been created, but it doesn’t match the raw streaming data that is to be used to make predictions or spot anomalies.
The solution is to move as much of that data preparation as possible into the streaming system. The streaming system should be used for data cleansing, preparation, feature extraction, enrichment – for all of the tasks that the data scientist was previously doing after they received the data. This would now all be performed in the streaming system beforehand. That prepared data then can be utilized to train the machine learning model. The benefit is minimizing latency. The historical way to train the machine learning model is based on data that is out of date because it takes the data scientists so much time to prepare it and apply it to the model. In a streaming architecture, the data is prepared in milliseconds so that it is still current data.
If desired, there can be a simultaneous process during which the streaming system is still writing the training files, but it’s also passing the real-time streaming data into the machine learning algorithm so that it can return real-time results. And those real-time results could be classified into different categories of data. It could be making predictions into the future or looking at the difference between a predicted value and an actual value. But it’s doing this based on machine learning training, not on any hardcoded values.
Anomaly Detection and Prediction
Anomaly detection and prediction are the end goals of streaming analytics. If unusual behavior is identified – perhaps unusual network behavior, unusual sales of a particular item, or the temperature of a device increasing while pressure also rises – that behavior could indicate a potential problem that might require an alert. This is one of the top benefits of streaming analytics: alerts on critical issues based on complex calculations that can be done in real time. With such real-time alerting, it’s possible to know immediately whether you have a network breach, you’ve mispriced your flat-screen televisions, or that there’s a problem in a manufacturing pipeline.
Unlike other analytic systems in which queries are made after the fact to understand what has happened, streaming analytics systems can automatically send immediate notifications, without human intervention.
Alerting based on anomalies, pattern matching, and statistical analyses are all key aspects of streaming integration. We can extend these functions to make predictions. In addition to generating alerts immediately, you can also utilize visualizations or dashboards to see predicted outcomes based on what’s going on right now. This can help with quality assurance, customer experience, or other business concerns.
It can also help with predictive maintenance. For example, based on real-time information, we can identify that a particular motor is likely to wear out within the next two weeks, as opposed to its expected full-year lifespan, because data from it has been matched against machine learning analyses that have been done on failing motors in the past.
You can use predictive analytics to identify the current state of a sensor in a factory, a pipeline, or a fleet of cars, and utilize that information to make decisions.
Being able to not only identify anomalies, but also make predictions based on all the streaming data that you have and present that effectively to users – which we talk about in Chapter 6 – is the primary goal of streaming analytics.