JavascriptExecutor is a class under the Selenium library that executes JavaScript code snippets. For example, a Selenium WebDriver command such as WebElement.click() might not work on all browsers, but JavaScriptExecutor could help you to click on an element in any browser by executing the appropriate JavaScript snippet. There are a couple of Selenium WebDriver functions to handle JavaScript, such as executeAsyncScript() and executeScript(). The executeAsyncScript() method lets you inject JavaScript snippets into the page for asynchronous execution. The following is the syntax for this method:
JavascriptExecutor jse = (JavascriptExecutor)driver;
Let's see how you can click on an element without using Selenium's click() method. The following code snippet displays an alert message as a pop-up:
(JavascriptExecutor) driver).executeScript("arguments[0].click();", WebElement element);
JavascriptExecutor jse = (JavascriptExecutor)driver;
jse.executeScript("alert('Selenium Essentials saved my Day!')");
A few of the helpful tasks using JavascriptExecutor are discussed as follows.
Page scroll allows the user to focus on an element to perform any action. It helps you to scroll throughout the web page using xy coordinates. There are numerous methods and techniques to make it happen.
The following is a list of methods to scroll the web page:
- Scroll down: This is the
JavascriptExecutormethod that makes use of the xy coordinates to scroll down the page. The page scrolls down with respect to the changes made on the y co-ordinate. The following is the code for this method:import org.openqa.selenium.JavascriptExecutor; JavascriptExecutor jse = (JavascriptExecutor)driver; jse.executeScript("scroll(0, 250)"); //Y-coordinate '250' can be altered - Scroll up: Similar to the above snippet, JavaScript uses xy coordinates to scroll up the page. The page scrolls up with respect to the changes made on the x coordinate. The following is the code for this method:
JavascriptExecutor jse = (JavascriptExecutor)driver; jse.executeScript("scroll(250, 0)"); // X-coordinate '250' can be altered - Scroll to bottom of the page: The
document.documentElement.scrollHeightmethod returns the height of the HTML element. Thedocument.body.scrollHeightmethod outputs the page/frame height, and finallydocument.documentElement.clientHeightreturns the browser window height. This method gets the user to focus on the bottom of the page quickly. The following is the code for this method:JavascriptExecutor jse = (JavascriptExecutor)driver; jse.executeScript("window.scrollTo(0,Math.max(document.documentElement.scrollHeight,document.body.scrollHeight,document.documentElement.clientHeight));"); - Full scroll to bottom in slow motion: The following two methods get the user focus on the bottom of the page in slow motion.
- Method 1:
for(int second = 0;; second++) { if (second >= 60) { break; } ((JavascriptExecutor) driver).executeScript("window.scrollBy(0,400)", ""); //y value '400' can be altered Thread.sleep(3000); } - Method 2:
JavascriptExecutor jse = (JavascriptExecutor) driver;
for (int second = 0;; second++) {
  if (second >= 60) {
    break;
  }
jse.executeScript("window.scrollBy(0,800)", ""); //y value '800' can be altered
Thread.sleep(3000);
}
- Method 1:
- Scroll automatically to WebElement: These methods automatically focus on a web page element by using different types of JavaScript functions:
- Method 1:
Point hoverItem =driver.findElement(By.xpath("Value")).getLocation(); ((JavascriptExecutor)driver).executeScript("return window.title;"); Thread.sleep(6000); ((JavascriptExecutor)driver).executeScript("window.scrollBy(0,"+(hoverItem.getY())+");"); // Adjust your page view by making changes right over here (hoverItem.getY()-400) - Method 2:
((JavascriptExecutor)driver).executeScript("arguments[0].scrollIntoView();", driver.findElement(By.xpath("Value')]"))); - Method 3:
WebElement element = driver.findElement(By.xpath("Value"));
Coordinates coordinate = ((Locatable)element).getCoordinates();
coordinate.onPage();
coordinate.inViewPort();
- Method 1:
Debugging can be even easier by highlighting elements at runtime through the browser UI. Optimizing user-interactive CSS values paves the way for better user interactions while conducting a seminar or a demonstration. A similar function is available in the Selenium IDE as an add-on, Highlight Elements (Selenium IDE), for stress-free debugging. The following is the code for this function:
WebElement element1 = driver.findElement(By.className("Value"));
WebElement element2 = driver.findElement(By.id("Value"));

JavascriptExecutor jse = (JavascriptExecutor)driver;
jse.executeScript("arguments[0].setAttribute('style', arguments[1]);", element1, "color: blue; border: 2px solid blue;");
jse.executeScript("arguments[0].setAttribute('style', arguments[1]);", element2, "color: yellow; border: 0px solid red;");
The following code snippet provides you with a better understanding of customizing CSS values through JavaScript:
@Test
public void Highlight() throws Exception {
  driver.get(baseUrl + "/");
  WebElement searchbutton = driver.findElement(By.id("Value"));
  highlightElement(searchbutton);
  WebElement submitbutton = driver.findElement(By.id("Value"));
  highlightElement(submitbutton);
  element.click();
}

public void highlightElement(WebElement element) {
  for (int i = 0; i < 2; i++) {
    JavascriptExecutor js = (JavascriptExecutor) driver;
    js.executeScript("arguments[0].setAttribute('style', arguments[1]);", element, "color: yellow; border: 2px solid yellow;");
    js.executeScript("arguments[0].setAttribute('style', arguments[1]);", element, "");
  }
}Tests on a single browser instance are quite usual and consistent. However, opening a new browser window at the start or in the middle of the test lets you open a new browser instance as a child window. So, you have two windows open at a time with an active, newly opened browser window.
The following snippet lets you open a new browser instance to make it ready for testing:
@Test
public void Test01() throws Exception {
  OpenNewTab("https://www.google.com");
}
public void trigger(String script, WebElement element) {
  ((JavascriptExecutor) driver).executeScript(script, element);
}
public Object trigger(String script) {
  return ((JavascriptExecutor) driver).executeScript(script);
}

public void OpenNewTab(String url) {
  String script = "var d=document,a=d.createElement('a'),a.target='_blank';a.href='%s';a.innerHTML='.';d.body.appendChild(a);return a";
  Object element = trigger(String.format(script, url));
  if (element instanceof WebElement) {
    WebElement anchor = (WebElement) element;
    anchor.click();
    trigger("var a=arguments[0];a.parentNode.removeChild(a);", anchor);
} else {
    throw new JavaScriptException(element, "Unable to open Window", 1);
  }
}
In the preceding code snippet, OpenNewTab is the user-defined method that opens a new browser window along with the given URL.
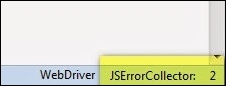
The JSErrorCollector library is a third-party, external Java library file that collects all the JavaScript errors through the Firefox profile during test execution. This library file feeds an extension, JSErrorCollector.xpi, into the Firefox browser profile on runtime to collect JS errors. All the captured JS errors are listed as counts in the bottom-right corner of the browser's page. The following screenshot depicts a list of captured JS errors:
Follow these steps to store the JavaScript errors generated at runtime:
- Download the
JSErrorCollectorJava library file from the following link: - Add the downloaded JAR file to build the path.
- Initialize the Firefox profile with the
JSErrorCollectorextension, as follows:FirefoxProfile ffProfile = new FirefoxProfile(); JavaScriptError.addExtension(ffProfile);
- Finally, collect all the JavaScript errors:
List < JavaScriptError > jsError = JavaScriptError.readErrors(driver);
The following code lets you collect the JS errors and reflects them in the console after test execution:
import java.util.List;
import net.jsourcerer.webdriver.jserrorcollector.JavaScriptError;
import org.openqa.selenium.firefox.FirefoxProfile;
@BeforeTest
public void setUp() throws Exception {
FirefoxProfile ffProfile = new FirefoxProfile();
JavaScriptError.addExtension(ffProfile);
driver = new FirefoxDriver(ffProfile);
baseUrl = "http://404checker.com";
}
@Test
public void Test01() throws Exception {
driver.get(baseUrl + "/");
Thread.sleep(5000);
}
@AfterTest
public void tearDown() throws Exception {
List < JavaScriptError > jsError = JavaScriptError.readErrors(driver);
System.out.println("——————JavaScript Error List——————");
for (int i = 0; i < jsError.size(); i++) {
System.out.println(jsError.get(i).getErrorMessage());
System.out.println("Error Line: " + jsError.get(i).getLineNumber());
System.out.println(jsError.get(i).getSourceName());
}
System.out.println("——————End of the List———————");
System.out.println("
");
driver.close();
driver.quit();
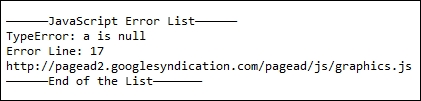
}The following screenshot is a test result for the preceding script that displays the error type, the error line, and the affected JavaScript filename.