
Chapter 2
Mine Growth beneath the Surface
We shall not cease from exploration,
and the end of all our exploring
will be to arrive where we started
and know the place for the first time.—T.S. Eliot
The old cliché is that you can’t see the forest for the trees. In finding new sources of sales growth, the more relevant analogy is the reverse: by looking at the forest of average data, it’s easy to miss where growth truly lies. For example, it is widely known that US manufacturing is in a state of decline. In 2008 alone, manufacturing GDP fell by $44 billion. But if you disaggregate that number, you will find that there were healthy pockets of growth that amounted to almost $32 billion—four times India’s total growth that year.1 The hidden pockets of growth in your industry may lie in your own backyard.
In the previous chapter, we showed how sales leaders can get ahead of competitors by capturing growth based on trends and investing ahead of demand. This chapter takes a look at sales executives who unearthed growth by undertaking micro-market analysis, identifying which markets have the highest growth potential, and aligning their resources to capture them.
A global chemicals and services provider increased the growth rate of new accounts from 15 percent to 25 percent in just one year. The big breakthrough, a sales executive told us, was adopting a more granular view of the market. Instead of looking at current sales by region, as it had always done, the company developed a new and far more revealing view by examining share within customer industry sectors within specific US counties. This deeper level of analysis revealed that although the company had 20 percent of the overall market, it had up to 60 percent in some micro-markets, while in others, including some of the fastest-growing segments, its share was as low as 10 percent.
Sales leaders used this insight to turn the planning process on its head. Instead of relying solely on historical data to allocate resources, they included forward-looking opportunity data at a much finer level of analysis. They adjusted how the sales force was deployed to exploit the growth opportunities and ensured that reps were equipped to win in the opportunity hot spots they had discovered.
The sales leaders we interviewed across a range of sectors agreed that taking this sort of granular approach to growth is essential in deciding where to compete and in translating market insights into actions. The most successful sales leaders were extremely proactive in mining the growth that lay right beneath their feet in what seemed to be mature markets. Many have delivered impressive results thanks to this micro-market approach to growth, even under the strain of the recent financial crisis. At the core of this approach to find growth ahead of competition, leading sales organizations do three things:
- Find the pockets of growth. Using micro-market analysis, companies can identify where opportunity lies at a very granular level based on a combination of market characteristics, including competitive intensity and market attractiveness.
- Look beyond sales to mine growth. To maximize the benefits of micro-markets, leading organizations recognize they need to involve functions beyond sales.
- Keep it easy for the sales team. Micro-market strategies by their very nature are heavy on the analytics, so it’s important that sales teams on the ground don’t get bogged down by the detail and can simply harness the information in the most effective way.
Find the Pockets of Growth
Granularity is a word traditionally used more by scientists than sales leaders, yet it cropped up time and again in our conversations. Companies that have capitalized on micro-markets have taken a geological hammer to all their market and customer data; they break larger markets down into much smaller units, where the opportunities—prospects, new customer segments, or micro-segments—can be assessed in detail.
Portugal Telecom has wielded this hammer in several key markets, including Brazil. Former CEO Zeinal Bava explained in 2011: “To me, there’s no such thing as an effective countrywide strategy. We break the country down into customer segments and then look at different geographies. São Paulo city is very different from São Paulo state, for example…. You have to walk away from the averages and map out the markets. If you are the leader in a specific market, it might be sufficient to offer customers one month [subscription] for free. If you’re number four, you might have to give them three months. When we rolled out 3G, we started in areas where the average revenue per user and spectrum availability supported the business case and service quality underlying the investment.”2
It quickly becomes clear that a broad-brush approach will not lead to the most lucrative hot spots and could leave you wasting resources where growth is significantly below average. Leading companies are taking differentiated approaches to driving revenue growth based on this type of granular information.
In Europe, a consumer telecommunications company reexamined its 15 sales regions and split them into approximately 500 micro-markets based on a variety of characteristics such as shopper population density and store catchment areas. Sales leaders were surprised to see that when viewed at this level of detail, these markets actually varied by a factor of four in terms of shopping activity, economic growth, and wealth. Focusing the microscope on its store penetration in each micro-market and looking at the relative share of stores compared to competitors showed similarly wide variations.
It became apparent that there were deep pockets of opportunity in places with attractive populations and limited competition, but the company did not have the right store footprint or formats to access this untapped demand. There were also places where competition was intense but there were fewer unserved customers than the company had initially believed. It had treated many of these markets in similar ways due to the lack of granular, micro-level segmentation. The head of channels realized quickly that it was time for a much more differentiated approach if the company was to grow revenue profitably.
The company aggregated its 500 micro-markets into four categories. In the most underserved markets with the lowest density of retail stores (both its own and those of competitors) the company focused on developing different store formats to make store economics more attractive and establish a foothold before its competitors. Ultimately, the telecommunications company saw 5 to 10 percent more in-store visits by optimizing its store footprint. It also shaved total store costs by 5 percent by eliminating, resizing, or refocusing less profitable locations.
The chemicals and services company we mentioned at the start of the chapter used a four-step approach to finding pockets of growth. First, it created an opportunity map, which is the foundation of micro-market strategy. It defined the size of the micro-markets at a district level by matching administrative counties with reps’ typical 25-mile territory radius; this typically resulted in coverage of four or five counties. Then, the company determined the growth potential based on a list of 15 drivers, using industry knowledge as well as interviews with customers and reps. Drivers included cost of input, cost of capital, local demographics, etc. The company measured the impact of each driver by analyzing how it had affected growth historically. Third, the company estimated market share in each market and what lay behind market-share differences between markets, which included drivers such as rep coverage, pricing by channel and product, and marketing spend. Finally, sales leaders prioritized the growth pockets based on opportunity for growth. It realized that 60 percent of the fastest-growing counties had inadequate rep coverage, while there were slow-growth territories that were over-resourced.
The company rapidly reallocated resources between territories and focused on those with the most growth potential (Figure 2.1). The head of sales then translated the micro-market insights into specific sales leads and the results were impressive: a tenfold increase in prospects in some micro-markets and a narrowing down of realistic prospects in others. Figure 2.2 shows the scale of the variation.3 In industries I to N, for example, the company calculated that there was an enormous missed opportunity, whereas industries A to D were already close to their full potential.

Figure 2.1 Micro-market analysis reveals pockets of growth
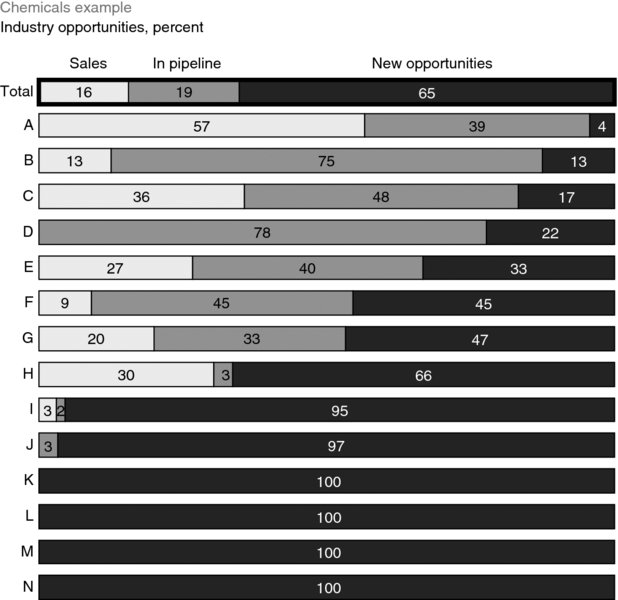
Figure 2.2 Micro-market lens fills the pipeline with otherwise hidden opportunities
Look beyond Sales
Translating detailed analysis into insights is not a novel idea in itself. Nor is it sufficient for capturing micro-market growth ahead of competition. What turns insights into sales is how the front line is managed in the micro-market. The sales executives we interviewed stressed the need for appropriate resource allocation and actionable tactics for sales teams or retail stores to fully exploit the new opportunities.
These sales executives also work very closely with other parts of the organization to capture the most lucrative customer opportunities in micro-markets. This means realigning sales, marketing, and sometimes even noncommercial resources such as customer service or supply chain. Of course, not all resource allocation decisions are at the discretion of the head of sales, so cross-functional collaboration is critical to extract the full value of the micro-market pockets of growth.
Marketing plays a substantial role both in generating micro-market insights and in applying them in the field. For example, an Asian telecommunications company discovered that about 20 percent of its marketing budget was being spent in markets with the lowest lifetime customer value. The company reallocated its marketing budget to the most lucrative part of its markets, which represented more than two-thirds of its opportunity. It did not stop there. It also recalibrated its customer acquisition goals. Targets were reset at the micro-market level based on the market potential rather than being spread equally across all markets. The result: targets rose 10 percent—and were met. What made this initiative so successful was the active collaboration of the marketing, sales, and finance groups in the pursuit of a clear, overarching goal.
The executives we talked to believe that assigning resources from their own sales organization based on previous demand patterns is quite literally yesterday’s game. At the chemicals and services company, one sales rep spent more than half her time 200 miles from her home office, even though only a quarter of her region’s opportunity sat there. This was purely because sales territories had been assigned according to historical performance rather than on growth prospects. After going through the micro-market analysis, the company realized the mismatch. Now, the rep spends 75 percent of her time in an area where 75 percent of the opportunity exists—within 50 miles of her office (Figure 2.3).4

Figure 2.3 Redesigned territories better match rep time with opportunity
This might sound simple, but making this transition required painstaking work. Dedicated analysts were required to create opportunity maps for every sales rep in the company and to identify accounts for reallocation. There was of course a very real risk that the company could lose accounts that had deep relationships with reps being reassigned. Therefore, it designed detailed action plans to reduce attrition for each migrated account. The entire process took about six months, but reps now spend more time selling and less time behind the wheel.
Some companies have used nontraditional sales techniques to exploit new micro-segments. One European integrated telecommunications provider saw a 35 percent increase in call center revenue after just six weeks of actively turning inbound service calls into sales. By analyzing customer data at a very detailed level and developing tailored value propositions, its customer service agents were able to make extremely targeted pitches when customers rang up for general service support (although sales were not attempted if the customer was complaining). Companies from the United States and Canada have seen similar results.
Keep It Easy for the Sales Team
Sales teams have neither the time nor inclination to delve into the data or worry about cross-functional resource allocation. For the micro-market approach to work, complexity must be minimized—the sales team needs simple and effective insights and tools.
A North American logistics company had an overall goal to increase prices by 3 percent annually, but it knew that wide variation in growth and competitive intensity across its markets might make this difficult to pull off. To ensure it met this target, it developed a detailed micro-market pricing scheme and provided simple rules, based on the competitive dynamics of each segment: reps in high-growth markets were expected to raise prices and grow faster, and those in declining markets were allowed to reduce prices to prevent existing customers from leaving. These markets were identified at the city and zip-code level, and tailored strategies were developed by line of business, customer occasion, and customer segment.
This new, simple approach worked well. In prior years, sales teams had always been in the dark as to how prices were set. Now, they could easily understand what was driving the differences, and they embraced the new concept with great enthusiasm. In the past, sales reps had always complained about directives from on high, but now they were actively asking for higher prices for specific customers. The new approach also made performance management easier as reps could now accept that local market characteristics were being taken into account and they could be benchmarked against peers from similar markets.
A cargo airline developed a complex micro-market strategy to categorize customers based on flight/space availability and demand. Although the airline realized that demand varied by time of day, day of the week (for example, shipping fresh sea bass from Italy on a Wednesday for weekend consumption in New York), and week of the year, (for example, shipping flowers the week before Valentine’s Day), it lacked a systematic way to capture the information to inform daily decisions regarding key accounts, such as how much capacity to allocate to each customer. The airline’s new customer-categorization model essentially recognized which customers contributed more to challenging micro-markets and rewarded them accordingly.
The impact of this analysis was tremendous. It helped the company identify opportunities for different negotiation strategies, including providing space on flights on routes with high demand while also raising prices, and asking for higher-volume commitments for flights on lower-demand routes. Given the dynamics of the cargo market, which is very susceptible to changes in flight itineraries and shifts in customers’ own supply chains, this became a very complex model.
To make it easy for the sales force, the company developed a simple performance dashboard for sales teams to manage pricing and volume negotiations with large customers by route on a daily basis. The dashboard includes critical information, such as whether the specific flight is overbooked or not, as well as information on the weekly itineraries of the airline and its competitors. The sales manager holds weekly sales-strategy discussions with each rep to ensure they are always well placed to achieve the desired outcomes. It took six months to set this up, and during this time, the company used more manual methods to drive results to ensure it was not missing any opportunities. This effort generated a share of wallet as high as 20 percent with key customers.
■ ■ ■
Micro-market strategies give sales leaders a powerful way to find growth ahead of their competitors. Next, Gil Steyaert from adidas explains how focusing on overlooked pockets of growth in the company’s core products and markets has helped keep the brand at the forefront of its sector. Pioneer Hi-Bred has been using the micro-market approach for a few years and Alejandro Munoz explains more about how the agribusiness has benefited from going granular.
This granular approach to growth served the telecommunications company we discussed earlier exceptionally well, enabling it to attract more customers and cut overall costs. Deconstructing the averages meant realigning sales capacity with the reality on the ground for the chemicals company—with the additional benefit of a better quality of life for its direct sales force. Meanwhile, the cargo airline understood that the devil was in the detail as it grappled with specific time slots, products, and markets to maximize capacity on flights and improve its negotiating power; yet its real success came in making all this manageable for the front line.
There is so much data to play with today that sales leaders could easily be overwhelmed by the volume, the variety of sources, and the analyses needed to make it useful. In the next chapter, we look in more detail at how companies can use this ‘big data’ to drive sales growth.