
Appendix 2: A Primer on the Unified Modeling Language (UML)
You don’t have to look hard to realize that designing software is a lot like designing anything else. In Chapter 1, There’s a Big Ball of Mud on Your Plate of Spaghetti, we talked about the underpinning of software patterns coming from a pioneer in the field of architecture – not software architecture, but the traditions, engineering, and design practices involved in the architecture of buildings and cities. In 1977, Christopher Alexander documented a pattern language designed to form the basis for the best practices for building towns. His book described 253 patterns that were presented as the paragon of architectural design. The book broke everything down into objects.
Object-Oriented Analysis and Design (OOAD), a practice that is adjunctive to Object-Oriented Programming (OOP), involves the design of an object structure separate from the exercise of writing code. This is usually the job of a software architect or a senior developer. Software architects are similar to architects of buildings: they design the structure of an application. This can be done before the implementation team, which is the team that is going to build what the architect designs, picks the programming language for a project.
OOAD makes use of a set of documentation conventions codified as the Unified Modeling Language (UML). It sounds like a programming language, but it isn’t. Instead, it is a standard for creating diagrams that explains the structure and relationships between components in a software system.
Think of it this way. If you are a musical composer, you can write your notes in a musical score. You can do this without ever touching an instrument. If you are skillful in composition, you can write entire orchestral works on paper using sheet music notation. You can then hand your sheet music to an orchestra and a conductor, and assuming the orchestra comprises competent musicians, they should be able to play your music. Architects are like composers. Programmers are musicians, and the team lead or lead developer is the conductor.
Throughout this book, UML class diagrams are used to convey the structure of the pattern code to be implemented in our real-world projects. If you’ve never worked with the UML before, you’re going to need a short primer. This appendix is designed to be that primer. It isn’t a substitute for a graduate-level OOAD course, or even for reading a whole book on UML. I’m just going to cover the diagram conventions for the one type of diagram we use throughout the book so that you can understand the diagrams, and how they are converted to code.
Again, UML isn’t a coding language; it’s a specification for diagramming your code. There are 14 types of diagram in the UML 2.5 specification. We only need one; the most common among the different diagrams is the class diagram.
Technical requirements
There are many tools for drawing UML diagrams, and although I have presented many such diagrams, I’ve taken the tool used to make them for granted. In the real world, this exercise often happens on a whiteboard. A whiteboard is fine for ephemeral drawings that get erased later. For this book, my diagrams need to be a bit more permanent, so here’s what I’m using:
- A computer running the Windows operating system. I’m using Windows 10. Honestly, this doesn’t matter, since diagramming tools are plentiful for all operating systems, and there are many that will work in your browser.
- A diagramming tool. I’m using Microsoft Visio.
There are quite a few UML tools on the market. Here is a short list of tools I’ve used over the years:
- Microsoft Visio
- StarUML
- Altova UModel
- Dia
- Umbrello
- Umlet
- Omnigraffle (Mac only)
There are many more on the web. I tend to prefer apps that run on my computer versus browser-based solutions.
The structure of a class diagram
Class diagrams consist of several types of structures, and a set of connecting lines that express the relationship between the structures. The structures are as follows:
- A class (obviously)
- An interface
- An enumeration
- Packages (expanded and collapsed)
Connecting lines between the structures show how those structures are related. The relationships we can express include the following:
- Inheritance
- Interface realization
- Composition
- Association
- Dependency
- Aggregation
- Directed association
The last possible element on a UML diagram are the notes. Notes are just what you think they are. Sometimes, an architect needs to add a little more information than what the standard UML allows. Notes let you do that. You shouldn’t use them to write an epistle. Short notes in implementation logic are what you see most commonly.
To understand the patterns in this book, you need to understand class diagrams. Every pattern in this book is expressed with at least one UML diagram. The most important patterns are covered with two diagrams each.
Let’s take a look at the parts of a UML diagram. They aren’t that hard to decipher once you realize the meaning of all the diagram’s pieces. Let’s start with the structures.
Classes
A class diagram is a visual representation of an object’s class. Let’s say our program requires us to model a circle like the one in Figure A2.1:

Figure A2.1: This is not a UML diagram of a circle.
If we want to model this in UML, the class diagram would look like Figure A2.2.
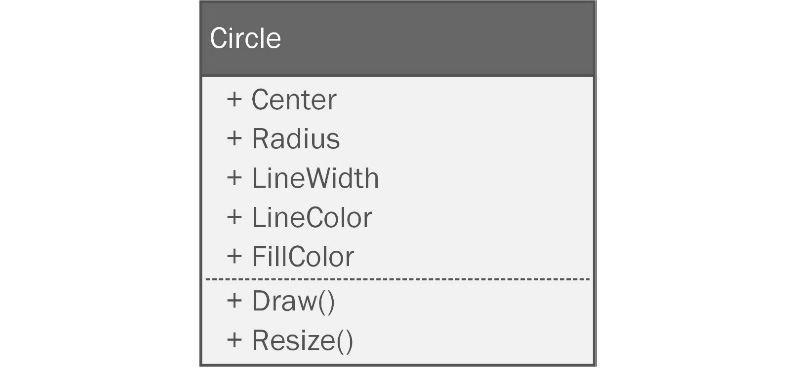
Figure A2.2: This is an example of a UML diagram. The class name, Circle, is at the top, followed by a list of properties, a dividing line, and a list of methods. The + indicates that they’re all public.
That’s not too difficult, right? It is a box split into three sections.
The top section contains the name of the class. The class is simply the codified version of what I put in my UML diagram. Understanding these details is central to the coverage in Chapter 3, Getting Creative with Creational Patterns, of creation patterns. These are patterns that revolve around object creation.
The middle box in Figure A2.2 contains a list of the properties that are members of the class. Note they do not have types. Some people put types in the diagram. I was taught not to because that is an implementation detail. The architect simply designs; they don’t constrain the builder any more than necessary. The programmer that implements the diagram picks the types. If it happens that you are the architect and the developer, feel free to specify the types if that is helpful.
Beneath the list of properties, we draw a line to separate the properties section from the next section. Visio made this a dashed line for my drawings. The dashed line has no significance. It can be solid or whatever line style that appeals to you.
The bottom box in Figure A2.2 is a list of methods. It doesn’t include details on how to implement the methods, or what they do – just the names, and any arguments.
You might have noticed there are + signs in the diagrams. These refer to your access modifiers. As with types, some architects put them in and some don’t. Others put them in when it is vitally important – when the class just won’t work unless that detail is honored. I succumbed to the temptation to make a cute diagram to show you what the access modifiers look like in Figure A2.3.

Figure A2.3: Access modifiers.
The plus sign (+) denotes a public property or method. The minus sign (-) denotes a private property or method, and the hashtag (#) indicates that the property is protected. C# supports a few more access modifiers, such as internal, but they are unique to C#, so UML won’t have a symbol for them. If you don’t understand these access modifiers, refer to Appendix 1.
That’s it! UML class diagrams are very simple in nature. We’re not done yet though. UML diagrams can show different levels of detail. This really depends on your preferences and the audience for your diagrams. When I studied OOAD in graduate school, my instructor wanted me to put as few implementation details in the diagram as I could. This habit has stuck with me. I’ve seen other people diagram everything to the smallest detail. I’ve never been one for micromanaging, so I’m going to stick with leaving as much as possible up to the developer.
Abstract classes
Abstract classes are classes we aren’t allowed to instantiate directly. You can only instantiate subclasses of an abstract class. Diagramming them requires one tiny change to the diagram. Here’s an example in Figure A2.4.

Figure A2.4: When diagramming abstract classes, type the name of the class in italics.
Here, we can see that the Shape class is abstract and the Circle class is not. To specify a class as abstract, you need to type the name of the class in the top box in italics. Watch out for this! Sometimes, it can be hard to see, especially if your diagramming tool uses a cute font that makes italics difficult to spot.
Diagramming required types
There are times when you absolutely must define a property type, method argument, or return type because the implementation absolutely requires it. In those cases, you can specify the types in a diagram, as I have in Figure A2.5.

Figure A2.5: You can specify particular types using a colon followed by the type.
The Image class has a property here that absolutely must be of type Shape. It’s represented with a colon separating the property name and its type. Likewise, I can specify a return type for a method. The Image class has a method called GetCircle() that must return Circle. It is similarly specified with a colon and the type after the method signature is defined.
Constructors
A constructor is a special method that is called when an object is instantiated. Appendix 1 covers this in detail if you’re not sure what I mean. A constructor must have the same name as the class where it is defined. For a lot of people, just seeing a method with the same name as the class is enough. It can also be drawn more formally, as shown in Figure A2.6.

Figure A2.6: Constructors in a UML diagram are difficult to miss.
You can’t miss it. It’s the method with the obnoxious <<constructor>> in front of it. Since obnoxious things are very pedagogical, this is the convention I’ll be using.
Don’t diagram every tiny detail
In the world of web design, designers use a trick when dealing with their clients that has been around for centuries. When working with initial designs, the objective is to get the layout right and not focus on copy. The difficulty arises when you try to put fake copy in a web page design. Your clients will focus on what the copy says, and they’ll try to word-smith the text on the page. The objective is to get buy-in on the design, but that can’t happen because all the stakeholders are wrapped up in what the placeholder text says.
To get around this, designers use lorem ipsum text. Lorem ipsum are words from a famous book on ethics attributed to the Roman statesman and poet Marcus Tullius Cicero. The text looks like this:
This text is placed in a design draft as a placeholder for the actual copy. Since the text is unintelligible, anyone looking at the design with this text in place isn’t tempted to critique the content. They focus on the design.
In UML, when you want to do this, you can use empty, or nearly empty, classes to encourage stakeholders, namely the developers, to focus on the pattern design instead of what you’ve named the properties.
I do this a lot within this book. The projects aren’t real, and the code doesn’t really matter beyond being pedagogical. We’re here to learn the patterns. You can expect to see a lot of diagrams like Figure A2.7.

Figure A2.7: When designing with patterns, it is normal to see classes without all the details filled in. The point is to design and critique the structure, not the content.
In the Person and Teacher classes, I used placeholders. In the Student class, I didn’t specify anything. Both notations are valid. When you have the structure down, you can choose to either fill in the missing properties, methods, and relationships or leave them as implementation details for the developers.
If you choose the former, be careful. When you’re first getting used to working with UML, it is tempting to use it as a tool to specify minutiae. Resist this temptation. If you don’t, your diagrams will become so complicated that they lose their meaning.
Interfaces
Interfaces are extremely important to OOAD and pattern diagramming. Drawing them is not very different from drawing classes. They look the same except for an obnoxious <<Interface>> expressed in the title box on the diagram. You can see one in Figure A2.7.

Figure A2.7: An interface in UML.
Some languages only allow you to implement methods in interfaces. Interfaces in C# can specify public properties in addition to the usual public methods, so it is legitimate to see properties defined on an interface. To reiterate: all properties in methods in an interface have to be public. You’ll only ever see + symbols for the access modifiers.
Enumerations
Enumerations refer to a finite set of values that rarely change. For example, the list of states in the United States hasn’t changed in 70 years. The days of the week haven’t changed in thousands of years. These are good candidates for enumerations. Let’s look at a quick example:
public enum DaysOfWeek { Mon, Tue, Wed, Thur, Fri, Sat, Sun };They can be used as types, with the effect of preventing spurious data from being passed into a property or variable:
var dayOff = DaysOfWeek.Wednesday;
This is better than just making it a string:
var dayOff = "Wednesday";
I set the variable to “Wednesday", but as my enum reveals, my program is expecting a very specific value. The "Wednesday" string isn’t right. I could easily set any value as long as it is a string. If my class needs a day of the week, and I use an enumeration as the type, it would be impossible to pass in Bruceday as a day of the week. Bruceday only occurs in my house where every day is a beautiful, beautiful Bruceday. I’ve been trying to standardize it as an internationally recognized day off for years. I figured it was a lock when country superstar Alan Jackson recorded, “It’s Bruceday Somewhere.” At the last minute, he changed the title to “It’s Five O’Clock Somewhere.” I think it was a mistake. Apparently, you have to be a Nordic or Greek god, a main sequence star, or a planetary body before you are taken seriously.
An enumeration, like interfaces, features an obnoxious notation added to the title box, as seen in Figure A2.8.
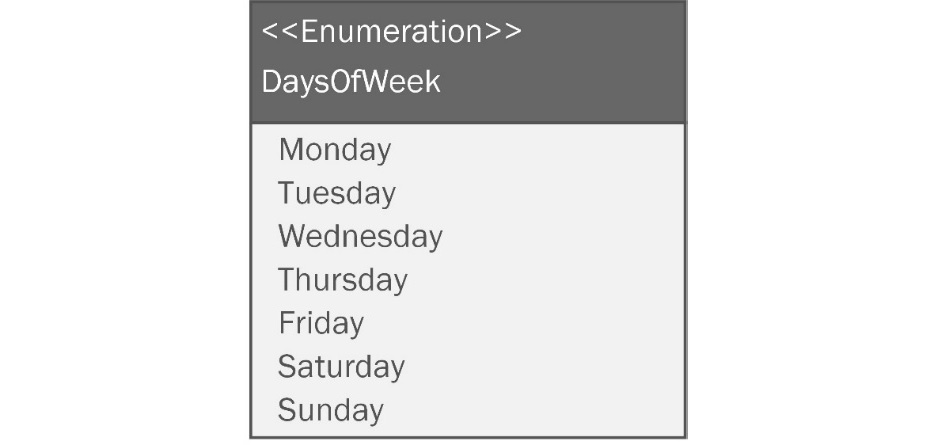
Figure A2.8: An enumeration in UML.
When you draw an enumeration, the properties represent the values that go into the enumeration. Enumerations don’t have methods, so there won’t be anything in the lower part of the diagram. There aren’t any access modifiers either. Just the contents are shown.
Packages
Packages are collections of the preceding structures. In C#, you would call it a namespace. There are two ways to draw packages: expanded and collapsed. Expanded packages are drawn with a rectangle around the classes and structures that belong to that namespace. They are used to show the contents of the package.
Collapsed packages don’t show the contents. They are just a representation of the namespace. You can see an example of both expanded and collapsed packages in Figure A2.9.

Figure A2.9: Expanded and collapsed packages in UML.
I only used the expanded package once in the book to express a dependency on a third-party library.
Connectors
In business, one of the most important factors to success is the relationships between the people you work with. The same can be said of a system of classes, interfaces, enumerations, and packages. In addition to the structures in a class diagram, the diagrams perhaps more importantly express the relationships between the structures, using a standardized set of lines and symbols. These lines connect structures together. Let’s look at the relationships expressed in UML class diagrams.
Inheritance
Inheritance between two classes is presented with a solid line with an open triangular arrow on one end. For example, if I have a class called Person, and another class called Student that inherits from Person, the diagram would look like Figure A2.10.

Figure A2.10: Inheritance is represented with a solid line with an empty triangular arrow pointing to the based class.
The arrow should point from the inheriting class to the base class. You are expressing that a student IS A person. As a best practice, the base classes are always drawn above the subclasses, so the arrows should always be pointing up.
Interface realization
We discussed interfaces in Appendix 1 if you’re not sure what these are about. Interfaces are the most flexible way to pass around dependencies without tightly coupling two objects together. This makes them very important to our study of patterns.
When a class implements an interface, you draw a dashed line from the class implementing the interface to the interface itself. The end of the line has a hollow arrow pointing to the interface, as shown in Figure A2.11.
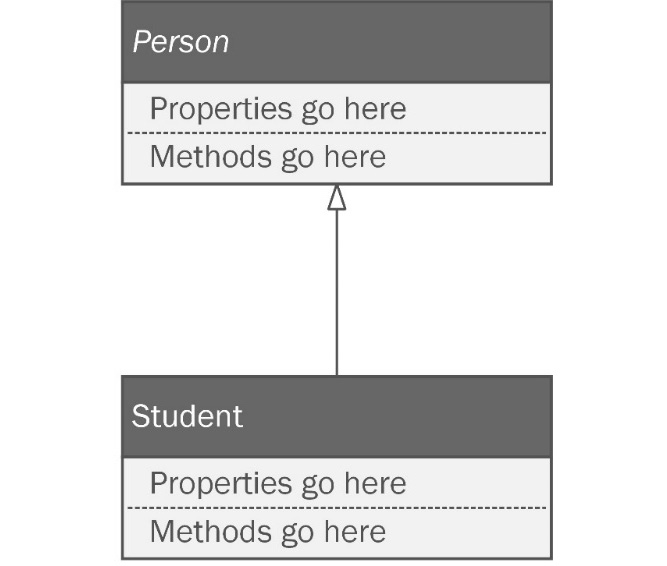
Figure A2.11: An interface realization line is dashed, with a hollow arrow pointing from the implementing class to the interface.
Composition
Composition refers to creating an object out of other objects. You are expressing a relationship by saying HAS A. To make a car object, you might need an engine object and a hood ornament object. You would say a car has a hood ornament, and you would be expressing composition. See Figure A.12 for an example of composition.

Figure A2.12: Composition in UML is shown using a solid line, with a diamond on the end of the containing class.
In UML, composition is expressed as a solid line drawn between classes, with a filled diamond on one end. The diamond should be pointing to the class that has whatever you’re putting into it. In our Car example, a car has an engine, so the line would go from the engine to the car and the diamond would be pointing to the Car class.
Association
Association between two classes indicates that they interact with each other. A driver object interacts with a car object. The driver puts gas in the car. The car transports the driver to another place. To draw an association in UML, you use a solid line with no arrow, as seen in Figure A2.13.

Figure A2.13: Associations show objects that interact with each other.
Aggregation
Aggregations are a type of association involving multiplicity. A warehouse object will have a relationship with inventory items expressed as “An order has many inventory items.” Don’t confuse it with composition. Not only does it seem like the same thing, but the symbols are also nearly identical. Aggregation is an empty diamond on a solid line, as seen in Figure A2.14.

Figure A2.14: Aggregation is an empty diamond on a solid line.
Aggregation and composition are different. Composition refers to the construction of an object from other objects. Aggregation refers to a relationship where there is a one-to-one, one-to-many, or many-to-many relationship between objects, but the objects can stand alone. If we had a CollegeCourse object, we could express aggregation with student objects. There are many students in one class. If the college cancels the class, the students don’t instantly vanish. You can have a student without a class.
Directed association
A directed association shows a container relationship. A spaceship object is related to passenger objects in this way. Passengers are contained within the spaceship. Note that the spaceship is not composed of passengers, so it’s not the same thing as composition. A directed association can be diagramed as seen in Figure A2.15.

Figure A2.15: Directed association between two classes.
The line is solid and the arrowhead is two lines rather than a triangle.
Dependency
When one class depends on another, you will find yourself changing both classes when modifications are needed. If you change one, you have to change the other. Imagine an electrical plug and an electrical socket. They are truly designed to be physically dependent on one another. If you had to change the design for the plug, you’d probably have to change the socket design too, and vice versa. A dependency relationship between two classes is something we usually strive to avoid, even though they are unavoidable. That might sound very Zen, but I’m referring to a relationship between two classes. A dependency is expressed using a dashed line with a non-triangular arrowhead on the end, as seen in Figure A.16.

Figure A2.16: Dependencies between classes are drawn with a dashed line and an angular arrowhead pointing from the dependent to the dependence.
These relationships can be vocalized as A depends on B changing as little as possible. I added the last part to remind me of the SOLID principle discussed in Chapter 2, Prepping for Practical Real-World Applications of Patterns in C# . The O in SOLID refers to the open-closed principle. Classes should be open for extension but closed for modification. Dependencies are unavoidable, but when you see them in the diagram, scrutinize them and implement them with care.
Notes
Notes are just what you think they are. Sometimes, an architect needs to add a little more information than what standard UML allows. Notes let you do that. You can see an example in Figure A2.17.

Figure A2.17: This is what a note looks like in UML.
You shouldn’t use them to write an epistle. Short notes in implementation logic are what you see most commonly.
Best practices
UML class diagrams are easy to create and understand, or at least they should be. Unfortunately, many diagrams fall victim to the same forces I covered in Chapter 1. They can be a Golden Hammer, and they can grow uncontrollably to become too complicated to be useful. Software succumbs to these forces slowly over time. Sometimes, it takes years to make a repository full of spaghetti. Diagrams tend to fall apart over the space of days. UML is a plan. If your plan is a messy disaster, how can your software be anything else?
To curb the tide of these destructive forces, I’m going to give you four hints to keep your diagrams useful, easy to read, and hopefully, keep you out of analysis paralysis.
Less is more – don’t try to put everything in one big diagram
UML diagrams are meant to be used by the development team, but they are often shared with other project stakeholders. If you go to a meeting with a diagram that looks like the guidance system schematic for the Patriot missile system, you shouldn’t expect to be well received. The developers won’t appreciate you and management will not think highly of you. The UML for the project in Chapter 6, Step Away from the IDE! Designing with Patterns Before You Code, and Chapter 7, Nothing Left but the Typing: Implementing the Wheelchair Project, could easily become way too big if you try to diagram the entire project in one diagram. Check out Figure A2.18. Even if I printed it on a plotter 3 feet wide by 2 feet tall, the diagram would still be hard to read.

Figure A2.18: Don’t do this! This diagram covers the entire project presented in Chapter 7. It is too big, too complicated, and it won’t fit on one page.
It’s better to break the system down into small parts and diagram those. You’ll see this done in Chapter 7 . Make diagrams of small systems and keep them simple. As a rule, I try to keep to one or two pages at most. If the diagram won’t fit on two standard sheets of paper, it is probably too big, and you will need to find a way to break it down into smaller pieces.
Don’t cross the lines
In the classic movie Ghostbusters, the heroes of the story invent a dangerous, high-tech proton accelerator that fires a stream of energy capable of trapping and holding ghosts. In the movie, the chief scientist who invented the technology warns his comrades to never cross the streams, meaning they should never let the bolts of energy from two proton packs cross one another. Try to imagine all life as you know it instantly coming to an end as all the atomic particles in your body explode at the speed of light. They called it a total protonic reversal. That’s bad.
Now, apply the same caution to crossing lines in your UML diagrams. Crossed lines are ambiguous. The best you can do is to make it look like a circuit diagram and have one line hop over another. You can see an example in Figure A2.19.
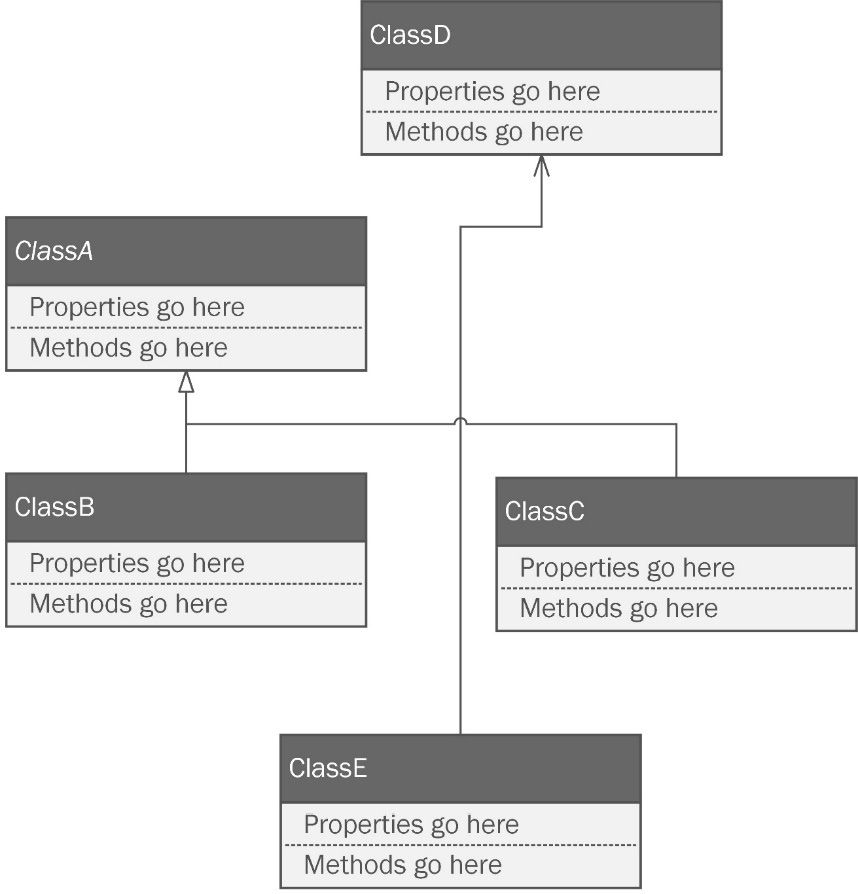
Figure A2.19: The connector between Class D and Class E crosses the line between Class C and Class A.
You’re not sure where they originate and where they terminate. If there is no way to draw a class diagram without crossing lines, it is probably too big.
This doesn’t apply if the lines are going to the same place. Class B and Class C are both inheriting from Class A. Technically, their lines join rather than cross. When this happens, I make an effort to join the lines together so that they look like one line.
The most direct path for lines leads to a mess
This best practice is baked into the better UML diagramming tools you’ll find online. Even Visio does it by default. Drawing straight lines between classes leads to a messy diagram. You can see what I mean in Figure A2.20.

Figure A2.20: Circuitous lines with right angles instantly make a diagram look better.
It is better to draw a more circuitous line that is easy to follow and, as we already noted, doesn’t cross other lines.
Parents go above children
When you are diagramming any sort of inheritance or interface implementation, you should always draw the parent element above, or at least higher than, the child element, as depicted in Figure A2.21.

Figure A2.21: Parent elements should always be above child elements, which means your arrows should always point up.
This makes your diagram easier to follow as long as you are consistent.
Keep your diagrams neat
Spend time keeping your diagrams tidy. I’d give you the same advice for your code. Clean up things you aren’t using anymore. Correct your spelling. Details matter! I would add that you should pick fonts that are easy to read. Fonts in your diagram should show italics very well so that you can always see abstract classes.
Summary
This appendix covered the UML. While it sounds like a programming language, it is really a standard way of drawing diagrams to represent structures and patterns of code. We only need 1 of the 14 recognized UML documents to get through this book, but the one we do use is used quite extensively.
The class diagram shows the structures of a system along with the relationships between those structures. The structures may be classes, interfaces, enumerations, and packages. Common relationships include inheritance, interface realization, composition, association, and more. Notes can be added to a diagram to add more details but should be kept concise.
We learned the best practices for UML class diagrams, including keeping a diagram as legible as possible. Avoid clutter in the diagram that comes from trying to define every single possible relationship between structures. Focus instead on those that are vital to the implementation of the diagram. A good diagram isn’t necessarily one that definitely conforms to the standards of UML. A good diagram is one that communicates quickly, with just enough detail to allow a developer to successfully implement the intent of the diagram, without micromanaging every detail.
Further reading
Baumann, Henriette, Patrick Grassle, and Philippe Baumann. UML 2.0 in action: A project-based tutorial. Packt Publishing, 2005.