
4 |
Project stage 2: plan |

Figure 4.1 Plan
Now that the terms of reference have been agreed with the sponsor, a detailed plan of the work has to be prepared.
 |
A project manager often considers how much of his or her time needs to be spent on preparing a plan. Too much time planning for a simple project may be considered a waste, but too little time on a complex project would introduce unnecessary risk. A simple project could be viewed as one with a small budget, or a small number of people involved. A complex project would be the opposite, where the budget would be large, more than three or four people involved in the team and, perhaps, where there are a number of different locations involved in the project. |
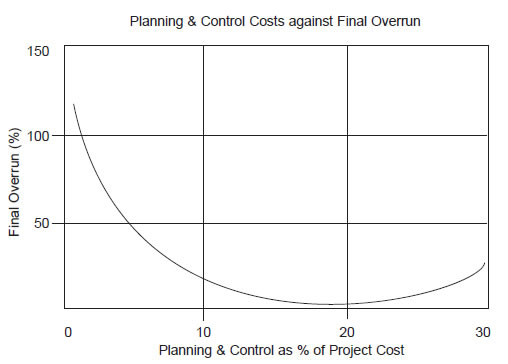
Figure 4.2 One benefit of planning is reducing the final overrun cost
Figure 4.2 shows the general relationship between how much planning and control is carried out on a project and the final cost overrun. As a rule of thumb, if less than 5 per cent of the project cost is spent on planning and control, then the project manager can expect a high probability of doubling the original budget. About 15 to 20 per cent of the project cost should be allocated to planning and control. If too much time is spent on planning and control, for example, over 25 per cent, then there is a danger that the final project budget will exceed original estimates.
Quite often, a newly appointed project manager will have a number of objections towards spending any significant time on planning a project. The most common complaint is that planning requires a lot of work and this takes time – time that can be spent on completing tasks required by the project.
Another complaint is that planning is not viewed as being productive by many people involved in a project. It is not action; it is not producing anything! Planning is a pretty chart that gets pinned on a wall at the beginning of a project and never gets updated again. It will change within a few days of starting a project, so why create a plan in the first place.
A final complaint that is often heard is that the original plan is fixed and cannot be changed, as the sponsor has agreed to it. The project manager will feel committed to the original plan and will believe that changes cannot be accommodated. The concept of change during the life of a project in this case is not understood. Change will inevitably happen and a process must be put in place to capture, assess and action requests for change.
All these objections to preparing and working with a plan are overcome when a project manager considers the following:
- A plan is a ‘map’ that allows us to reach the project objectives.
- Getting the team to participate in preparing a plan allows the project manager to secure ‘buy-in’ to the project by the team. The team will feel that it is their plan as they contributed to preparing it.
- As a minimum, the plan contains detailed information on what needs to be done (the tasks), by whom and by when. Without this information, the team will not know what to do and when to do it by.
- No corrective action can be take during a project unless there is something to refer to. This reference point, or baseline, is the plan.
Above all, a plan is a tool or business device that allows the objectives of a project, as defined in the TOR, to be achieved. It is a ‘living’ document that can be changed during the life of the project.
Earlier in this book we have said that a plan contains the following seven elements:
1 Creating a work breakdown structure (WBS).
2 Creating the team structure and individual responsibilities.
3 Estimating effort and duration for each task.
4 Preparing the schedule.
5 Allocating resource to tasks.
6 Determining the budget.
7 Risk analysis and contingency.
Each of these elements will now be discussed in detail, using the case study to show us how to prepare the necessary documentation to complete our plan.
Creating a work breakdown structure
 |
Break down each insurmountable giant mound of work into reasonably bite-sized chunks so that the people in your project team can gobble them up easily. What’s a reasonable chunk? Something of a size manageable by the person or people about to do the work. (Dalim Basu, Project Manager, ITN) |
Preparing a WBS is a technique that allows the project manager to break down the total work of the project, described in the TOR into themes, or main groups of work. These themes, or groups, are then subdivided into tasks and then sub-tasks. The final sub-task should be viewed as a piece of work, or work package, that an individual or team can deliver to a budget, where they define and control the dayto day activities to an agreed quality standard.
In another example of how much detail a WBS should describe, consider the construction of an office building. It would be acceptable to identify a task labelled ‘Install lift’ and not to break this task down any further. This task can be assigned to the building contractor who would then identify and manage the design and construction of the lift to an agreed budget, time and quality specification. This is an example of a team, rather than an individual, carrying out the lowest task described in a WBS.
The approach in constructing a WBS is similar to building an organization chart. There are many popular software applications that allow us quickly to construct organization charts, and these can easily be used to prepare a WBS.
After preparing a TOR, it is very tempting to use one of many excellent project management software packages to create and record a WBS. If at all possible, avoid using a computer at this stage and use the technique described in this section to create a WBS. There are two main reason why this is suggested:
1 Creating a WBS is a great exercise to begin building and motivating the team. Everyone feels they are contributing to the creation of the plan. All that is needed is a meeting room, a flipchart, pens and adhesive notepaper. Ask each team member to note down any tasks they think are needed that meet the project objectives. This is a challenge that the team will like, and the project manager will harness the experience of the team at this early stage.
2 The WBS is an excellent communication device that can be used after it is complete. At a glance, anyone looking at the WBS will see the entire work needed to complete the project. They will also see significant detail of each main phase of the work as they inspect the hierarchical structure of the WBS from top to bottom.
Here are the basic rules for creating a WBS:
- The first box at the top of the WBS tree should show the project name, or an acronym of the project name (as in Figure 4.3).
- The descriptions of the work in each box should be brief and easily understood.
- Do not subdivide all the work to the same lowest level.
- WBS does not show any interdependencies.
- WBS does not show any timescales.
Figure 4.3 is an example of a WBS using our e-commerce case study from Chapter 3. When this was created, not enough information was known about creating a new department within the organization, so it was decided to keep the WBS simple by just identifying the phase as ‘New Department’. This is acceptable, because this phase of the work will be allocated to the HR department where a sub-project will be created. A TOR will be generated by HR followed by a plan to create the new department.
Another thought about creating a WBS. It is natural to consider the items that need to be delivered and to record these in the WBS. There are several other ways to create a WBS. These include:

Figure 4.3 Work breakdown structure for the E-commerce Pilot Project
- by geographic structure
- product component structure
- functional structure.
The geographic structure of an organization, such as ‘Northern’ and ‘Southern’ regions, may be visualized when creating a WBS and the deliverables from each sub-geographical structure considered. If a project involves creating a product made up of several components, then the WBS may be created showing all the main components and sub-components that different teams would need to work on. Finally, a WBS may be created showing the work that needs to be carried out by the different functions in the organization, such as Finance, Production, IT, Marketing, HR and so on.
Creating the team structure and individual responsibilities
|
Split project teams into sub-teams of not more than eight people. (Peter Suhr-Jessen, Project Manager, Novo Nordisk) |
After the WBS has been completed, an initial team structure can be created and presented as an organization chart. Not all the resource names can be identified at this stage, but their function can, and it will be the responsibility of these functions to deliver the tasks allocated to them. For example, if the resource in the IT department cannot be identified as named individuals, then their functions, such as ‘network specialist’ or ‘telecom specialist’ can be recorded. Figure 4.4 shows the creation of project team structure from the WBS.
This is only the initial creation of the project team structure. After the effort of each task is identified, as described later in this chapter, the number of individual resources can be identified and allocated to each task.
After the project team structure has been created, a chart describing the authority and responsibility of key members can be drawn up. These key members are not limited to the project team itself, but can include others such as the sponsor, stakeholders, users or customers, suppliers, company departments, consultants or other contractors.
It is the process of creating this chart that will generate a great deal of discussion and begin bonding the team together. Quite often the sponsor is invited to participate in this discussion, as he or she is the person that must agree to the overall authority and responsibility of each person or group identified on the chart.
To create an authority chart, first agree the type of authorities that will be created.
 |
Here is a list of four types of authorities that may be considered: |
|
Different types of projects, or processes within a project, will attract different types of authorities and responsibilities. In a project that creates a product, there may be authorities such as ‘must assemble’ or ‘must check’. In other projects that deal with security issues there may be ‘must record information’ or ‘must hold key’.
The next step in creating an authority chart is to agree on the tasks that will be considered, usually from the WBS, and to agree on the resource that will have different levels of authority. The team carrying out the exercise to create the authority chart then debates the authorities and responsibilities required for each task and which resource will be given these authorities and responsibilities. An example of such a chart can be seen in Figure 4.5.
Work Breakdown Structure


Figure 4.4 Creating a project team structure from a work breakdown structure
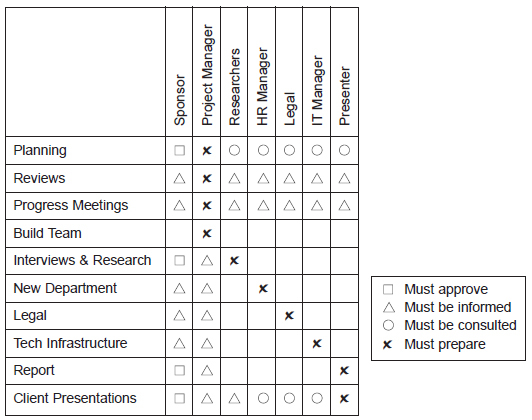
Figure 4.5 Authority chart for the E-commerce Pilot Project
Estimating effort and duration for each task
Now is the time to introduce the power and flexibility of a computer. Great care must be exercised in selecting the appropriate software package that will be used to complete the plan and then to control the project. The classic mistake when selecting a software package is to think that it will provide a rapid step-by-step recipe to planning and control. This rapidness in planning is often not achieved. The great flexibility offered by a variety of software packages is their potential weakness. A project manager inexperienced in using a particular package can easily and quickly change some figures, and then spend the next two to three hours working out why the package does not present information the way the project manager expects.
The golden rule in working with computer packages is to gain experience by initially using paper, then quickly move on to a spreadsheet and, finally, use a software package specifically designed to plan and control projects.
In this book we will begin this process by using paper to record information which can easily be transferred to a spreadsheet. All the information described in this and the next four sections, that are needed to complete a project plan (effort, duration, schedule, budget and risk), can be recorded on two sheets of paper, examples of which are shown in Figures 4.6 and 4.7.
First start by transferring the tasks identified in the WBS to the analysis matrix as shown in Figure 4.6. A blank form is also shown in Chapter 9, Figure 9.4, for you to use throughout the project management process. Once the tasks have been recorded, you need to estimate how long it will take each resource, or team of resources, to complete each task. This is the effort required to complete the task.
After completing your estimates of effort for each task, translate this into the duration each task will take and record this on your analysis matrix.
|
What is the difference between effort and duration? When estimating effort, think of the time that the task will take to complete assuming no interruptions, breaks, lost or wasted time (no weekends, holidays, sickness, training days etc.) when working on the task. Duration is the time the task actually takes to complete and includes all the lost, wasted or waiting time. Effort drives costs and duration drives the completion date of the project. |
As a project manager, whenever you need to estimate the effort and duration for work, always invite the experts in to obtain these figures. They are the people with the experience to give you reasonably accurate figures. Do not be tempted to estimate these figures yourself. The responsibility of the project manager is to provide the tools, techniques and framework to plan and control.

Figure 4.6 Analysis matrix recording tasks, dependencies, effort, duration, costs, risk and contingency
Achieving the correct estimates for effort and duration is the part of planning that can easily be confusing and where several errors can occur.
|
In a meeting with the experts, asking the question ‘How long will it take to create your report?’ may be met with a response like ‘Three weeks’. If a project manager accepts this value with no further questioning, there is a big chance that a misunderstanding has occurred. A follow-up statement like ‘Is that three weeks of solid work?’ may get a response of ‘Yes’. This would indicate that the estimate was for effort and not duration. The next question would be ‘Do you have the people to do this work in three weeks?’ This latter question will prompt a response that will provide an estimate for the duration of the task, which already has an estimate of three weeks’ effort. |

Figure 4.7 Time activity chart recording task schedule, project duration and resource plan
Quite often a sponsor will ask the project manager to reduce the time it will take to complete a particular task (i.e. the duration), and may even offer to provide more resource (i.e. effort) to support this request. An inexperienced project manager may instinctively think that ‘throwing’ more resources at a task will reduce the time that it takes to complete this task. In other words, increasing the effort can reduce the duration of a task. In many cases this is not true. Consider the following:
- Holding a meeting – as you ask more people to attend a meeting (increasing the effort), the meeting time usually increases (increasing effort not decreasing effort) as everyone wants their thoughts to be heard and to contribute positively to the meeting.
- Clearing an old factory site – if one machine can clear the site in ten days, then two machines may clear the site in about five days. Here is a near linear relationship where increasing the effort decreases the duration. However, there will come a point where a maximum number of machines can be used to clear the site, and then there will be insufficient room for them to manoeuvre. Increasing the number of machines beyond this point will not decrease the duration, but will increase the effort and hence the cost for clearing the site. The extra machines will be parked and will not contribute to clearing the site.
- Taking an aeroplane trip – this is fixed duration trip. Increasing the effort by putting more pilots, crew or passengers on the plane will not decrease the duration of the trip!
Estimating effort and duration is not a one-off process. This is only the first time that these estimates have been made, and the project manager will revisit these estimates when allocating resources (putting names to tasks) later in preparing this plan, and then regularly review these estimates during the life of the project.
Preparing the schedule
The project schedule will show when tasks can be carried out and when the project will be completed. Figure 4.7 shows an example of recording information to produce a project schedule on a time activity chart. The same list of tasks appears in the first column as in the analysis matrix shown in Figure 4.6. At the top of the form is the timescale showing the days, weeks or months, and against each task, the duration recorded in the analysis matrix is entered. This gives the first indication of when the project completion date will be. Some further checking is necessary before this can be confirmed, and this is described in the following sections on allocating resource when the resource plan is prepared.
Before the time activity chart can be filled in with the list of tasks and their duration, the dependency of each task on any other task needs to be identified and recorded. To do this, fill in the ‘Depend’ column in the analysis matrix. All tasks except the first task in the project must have a dependency. This information is vital in determining the project completion date, and software packages must have this information entered to do this. The most common type of dependency is when one task finishes and the next task starts. This is called a finish–start (FS) dependency. There are also finish–finish (FF) dependencies where both tasks must finish at the same time, and start–start dependencies, where both tasks must start at the same time. These three dependencies are shown in Figure 4.8.

Figure 4.8 Three common types of task dependencies to consider
Allocating resource to tasks
|
When there are limited resources, both in terms of finance and people, prioritization becomes all-important, as is the need for regular progress reporting. (Howard Gerlis MBCS, Member of Council, British Computer Society) |
At this stage of the planning process, the actual individuals who will carry out the tasks may not have been identified. The analysis matrix may only have their function recorded, such as ‘Internal Team’ or ‘Client Team’. As soon as resource names are identified, the plan, in terms of the analysis matrix and activity time chart, has to be updated to include actual names. The main work now is to reconfirm the estimates of effort and duration in the analysis matrix. The resources that have been provided to join the team are not necessarily the ones that were considered or expected when the estimation process took place. Their experience many not be as extensive as was hoped, or their availability may only be part time. This will probably change the original estimation of effort and duration recorded in the analysis matrix.
The final aspect of allocating resource during the preparation of the plan is to ensure that each resource, or team, has not been overallocated work. The project manager needs to make sure that nobody has been given two days’ work that has to be completed in a one-day period. This process of checking work allocation is known as resource levelling. At the bottom of Figure 4.7 is the resource plan which checks on resource allocation and allows the project manager to reschedule tasks on the time activity chart to avoid overallocation of work. Rescheduling the work will usually change the project completion date.
The resource plan in Figure 4.7 also identifies the minimum number of resources that are needed to complete each task during a particular week if the project completion date, the end date, cannot be moved. In this example we can see that the project manager will need assistance during weeks 3 and 4, and will probably require assistance during the rest of the project as their allocation is two weeks of work (effort) during every week. The maximum number of resources needed in the internal team will be seven people during weeks 5 and 6. If these people cannot be located, then tasks need to be rescheduled to reduce the numbers in the resource plan.
Determining the budget
The budget required to complete the project is estimated and recorded on the analysis matrix (Figure 4.6). Three figures need to be calculated:
- total resource costs
- equipment costs
- expenses.
At this stage of the planning process each of these costs is an estimate, and the estimates will change as the work on the project begins. The process of estimating these costs is to provide a structured framework for estimating the total project costs. These are presented to the sponsor so that he or she may raise the necessary budget, or make appropriate changes to the scope and deliverables, to reduce the project costs.
Referring to Figure 4.6, the rate for each team is recorded at the top of the analysis matrix. As the client team will be a cost that they already meet, this has been excluded from the project estimates. Next, the effort for each resource, in this case the project manager and the internal team, is calculated and recorded in the appropriate cost column. The total resource costs can now be estimated. A oneline cost for equipment and expenses is provided, although any detailed calculations and estimates can be provided in a separate supporting report. The total estimated project cost can now be recorded and reported to the sponsor.
Risk analysis and contingency
|
No project will run exactly to plan. Take a risk-based approach to project management and anticipate changes and risks to the project as far ahead as possible. This is a major key to success and will help you when things go wrong. (Paul L’Estrange, Manager – Development Support, Philip Morris) |
While preparing your WBS, analysis matrix and activity time chart, you will include tasks or adjust your estimates to make provision for when things go wrong. This contingency planning is an important part of preparing your project plan. However, as a project manager, you will find yourself in a position where you need to defend any contingency arrangements in your project. You may find yourself in front of your sponsor or steering committee presenting your plan and that body-piercing question is put to you:
![]() ‘How much contingency have you included in this project?’
‘How much contingency have you included in this project?’
or
![]() ‘Where is your contingency?’
‘Where is your contingency?’
Your response may be:
![]() ‘We’ve added 10 per cent extra time to the end of each task.’
‘We’ve added 10 per cent extra time to the end of each task.’
Or
![]() ‘We’ve added a task at the end of each phase called ‘Contingency’
‘We’ve added a task at the end of each phase called ‘Contingency’
in case we need more time.’
One of the first things your sponsor or steering committee member will do when he or she reviews your plans is to discover where you have added ‘extra time’, and then they will remove it! The psychology of this is simple, you know your sponsor will try anything to reduce the costs or timescales for delivering the project. So, you expect them to cut 5 to 10 per cent away from your budgeted cost or time. You, in turn, need to add 10 or 20 per cent to your planned budget before you meet because you expect it to be taken away!
This scenario is one of the key areas where projects begin to fail. If you have estimated correctly, you need that time to complete the tasks. You do not want your sponsor or steering committee member to take it way. How do you overcome this dangerous situation?
You need to justify to your sponsor or steering committee member exactly where and why you have added ‘extra time’ in your project plan. This is done by carrying out a risk analysis to identify all those tasks that are high risk and then create new tasks that are contingencies in case things go wrong. By this process you are specifically identifying two types of tasks:
- work that must be done to reduce the risk of the project failing
- work that might be needed if things go wrong.
Work that has been identified as ‘must be done’ will increase the project budget, but they will reduce the risk of project failure. In other cases, a series of tasks could be identified as ‘work that might be done’, which are solutions to problems when things go wrong. No additional cost is required at the this stage in the project, but might be required if things go wrong; ‘Forewarned is forearmed’ is a very appropriate saying.
How to measure risk
Risk and contingency need to be carried out during the planning stage of a project, although this step is often omitted because it is often thought to be too difficult or time-consuming to prepare. This is a misconception as the process for preparing a risk analysis only involves the following two steps:
- identifying high-risk tasks
- preparing contingency tasks.
Identifying high-risk tasks
To carry out a risk analysis for each task on your plan, you will need to:
- determine the probability of failure of that task using a high, medium or low scale
- determine the impact on the project if the task fails using a high, medium or low scale.
After you have recorded your risk assessment for each individual task, you need to highlight those tasks that have a combination of medium (M) or high (H) ranking for both the ‘probability of failure’ and ‘impact on the project’. These are your high-risk tasks and a contingency plan of action needs to be made for each one. Record the contingency actions as tasks in your analysis matrix.
In our case study, the analysis matrix in Figure 4.6 shows a typical risk and contingency assessment, which are recorded in the last three columns. For each task, the probability of failure was recorded as H, M or L, and then the impact on the project was also recorded as H, M or L should the task fail. The risk assessment highlighted four tasks having a combination of MM, MH, HM, or HH and these were:
- Project Manage – Reviews
- Project Manage – Progress Meetings
- Build Team – Client Team
- Interviews and Research – London, Madrid, Paris, Frankfurt
Preparing contingency tasks
After completing the risk assessment, a contingency plan can be created to reduce the risk of these four tasks failing.
In our case study in Figure 4.6, for the first two tasks a suitable contingency would be to hire a project assistant who would be responsible for all the logistics to ensuring the project reviews and progress meetings are held. Tasks like sending reminders to participants, preparing an agenda, recording meeting minutes and circulating actions arising from the meetings would need to be actioned.
To reduce the risk of the client team not performing well, a consultant specializing in team-building and leadership may be hired.
For the final high-risk task, completing a number of interviews across Europe, commitment from senior members of the organization would have to be gained before these interviews took place. A communications exercise may be the answer raising the profile of the project to the senior management team.
|
|
The complete plan
All the elements of the plan are now complete and this needs to be presented to the sponsor for approval before communicating the plan to the team.
The plan consists of a work breakdown structure, authority chart, analysis matrix and time activity chart. From these reports we know what needs to be done, when and by whom. We also have a team structure, their authority and an estimate of how much the project will cost. High-risk tasks have been identified and contingency plans drawn up.
The plan is a collection of living documents and will change over the life of the project. Managing this change process will be discussed in Chapter 8 when we consider how to control a project. We now need to build, lead and motivate our team which is discussed in the next three chapters.
|
|