
In Chapter 3, you learned how to capture data from a WCF service. In Chapter 6, you learned how to capture data from a BizTalk application. In this chapter, you’ll learn how to use captured data. In most cases, the data will be displayed to a user, often a business manager who is interested the performance of a business process. BAM provides two out-of-the-box ways to display the data to a user: a web application called the BAM Portal and Excel pivot tables. Because these tools are provided with BizTalk Server and no development work is needed to use them, we have found that most of our clients prefer to use one of these two techniques to minimize development costs.
The data captured by BAM is stored in SQL Server. If you need more flexibility than the built-in tools provide, you can use any data access technique that works with SQL Server to read BAM data. BizTalk Server 2009 has some changes in the structure of the BAM Analysis database that allow Microsoft Office PerformancePoint Server 2007 to display BAM metrics; this is beneficial because earlier versions of BizTalk Server did not work well with PerformancePoint.
![]() Note More about consuming BAM data from BI tools, such as PerformancePoint Server and SQL Server Reporting Services, may be found in Chapter 11.
Note More about consuming BAM data from BI tools, such as PerformancePoint Server and SQL Server Reporting Services, may be found in Chapter 11.
This chapter will cover
- The BAM Portal
- Using Excel to view BAM aggregations in a pivot table
- The BAM databases
- Looking at data in SQL Server
- Enhancing BAM data with lookups
The BAM Portal
The BAM Portal is an ASP.NET application that is accessed through a web browser; it provides a simple interface for querying data in the BAM Primary Import database.
When you look at the BAM Portal, you will see each of the views that you can access in the left- hand navigation column. Each view will have three subpages associated with it: Activity Search, Aggregation, and Alert Management. If you don’t see a view you expect, you should examine the security permissions on the view, which are managed using bm.exe. Each subpage provides a different way to work with the view.
Activity Searches
The Activity Search page (see Figure 7-1) is used to search for an instance of a BAM activity. As you’ll recall from Chapter 5, each instance of a BAM activity contains information captured from a business process or message flow. Values captured in the observation model may be used to search in the BAM Portal.

Figure 7-1. The Activity Search page
Queries are built using the Query Builder, which is found by selecting the view that interests you in the left-pane navigation, and then clicking Activity Search. You can create queries using dynamically built drop-down lists to provide search criteria. Adding and removing criteria alters the T-SQL query that is being built behind the scenes. Once the query is created, it may be stored and later reused, or used to define a BAM alert.
![]() Note Alerts are covered later in the chapter in the section “Alert Management” and in Exercises 7-2 and 7-4.
Note Alerts are covered later in the chapter in the section “Alert Management” and in Exercises 7-2 and 7-4.
Aggregations
The Aggregation page (see Figure 7-2) provides a means to visually represent aggregated BAM data as a graph and pivot table. It is available for views that include aggregated data.

Figure 7-2. The Aggregation page
As described in Chapter 5, BAM views can provide measures and dimensions that support analytical processing. As BAM data is collected, data is aggregated in efficient, easy-to-query tables. Aggregations in BAM views have two flavors: scheduled and real-time.
A scheduled aggregation is represented within the BAM Analysis database as an OLAP cube and is a snapshot of your business data at a specific instance in time. A scheduled aggregation is best used when you want to examine where your business is at a date/time milestone. For instance, one client needs to have data at the conclusion of each month and each quarter. Scheduled aggregations worked best in this scenario and are more like traditional business intelligence solutions.
Real-time aggregation data is stored in the BAM Primary Import database and is updated using database triggers. Real-time aggregation is a powerful feature of the BAM infrastructure that is not available in more traditional BI stacks. As an example, you could watch the behavior of a business process and always have up-to-date values for how long the process is taking on average or the maximum length of time the process has taken for each hour in the last week.
Within the Aggregation page, two main areas display aggregation data: the Pivot Table View and the Chart View.
The Pivot Table View
If you’ve gone beyond the basics of Microsoft Excel, you’ll be familiar with pivot tables. A pivot table is a data summarization tool that may display data organized in rows and columns, where the definitions of the rows and columns can be chosen by the user. Pivot tables also provide out-of-the-box functionality such as summation, sorting, counting, and filtering.
![]() Note It’s not a good practice to name your pivot tables
Note It’s not a good practice to name your pivot tables PivotTable1, PivotTable2, and so on. When the BAM Portal actually renders a pivot table, a meaningful name will be much more helpful to the user.
Pivot tables make it easy to analyze the data in a BAM view, if the data is aggregated using measures and dimensions. The pivot table can be adapted by the user by modifying the rows and columns, but the default display is the one that was designed in Excel at the completion of the View Creation Wizard.
The Chart View
The Chart View is simply a graphical representation of the aggregation and the reported data. When you drag and drop items from the Chart Field list into the Chart View, the pivot table is synchronized and the graph is changed to reflect the new fields.
Alert Management
Alerts are used to notify a user or system when some condition is detected in the business data. Alerts are created in the Activity Search and Aggregation pages. As an example, in the Manufacturing view’s Activity Search page, you could create an alert that would notify you when an order had a bale count of more than 400. In the Marketing Aggregations view, you could create an alert that would fire when an agent generates more than 20 orders in one state.
Alerts can be used to detect problems in the behavior of business processes. As an example, imagine a web site that sells electronic equipment. If more than 1,000 printers are sold from the site in less than one hour, users may be taking advantage of an errant coupon code or a problem with the web site. An alert could be raised to notify site managers that the situation should be investigated.
Alerts aren’t useful, however, until they have a subscriber. When an alert is created, the portal will display the Alert Management page (see Figure 7-3). This page allows you to create a subscription to an alert. Two types of subscriptions are available: file and e-mail. A file subscription writes a file when the alert triggers, and an e-mail subscription sends an e-mail. You can have as many subscriptions as you want to a single alert, so you can have both file and e-mail subscriptions for the same alert.

Figure 7-3. The Alert Management page
The obvious way to use alerts is to notify a person about a business situation, but there’s another way to use them that automates the response. An alert subscription can write the alert to a file folder. There’s no reason that file folder can’t be a BizTalk Server receive location. That would allow a BizTalk orchestration to be automatically activated in response to a BAM alert. In turn, the BizTalk orchestration can call .NET code or a web service that automatically handles the alert situation.
At AWO, when a large order is received, temporary staff must be added at the factory to cope with the order. A BAM alert identifies the large order and writes a file using a file subscription. That file is picked up by a BizTalk receive port and written into a Microsoft Office SharePoint Server (MOSS) document library using the SharePoint adapter, initiating a MOSS workflow that will create tasks for the HR department. This is a common pattern in which BAM alerts activate a new business process either through an orchestration or by sending a message to some other system.
You can use this technique to allow the user to modify the business rules for a business process. At AWO, the factory manager can use the BAM Portal to change the order size that triggers the HR business process. We wouldn’t advise implementing complex business logic using BAM alerts, however. Instead, consider using BizTalk’s business rules engine, which is another tool that allows end users to modify the behavior of a business process. To modify human-to-human workflows, you should also consider Microsoft Office SharePoint Designer, which can be used to modify workflows in Microsoft Office SharePoint Server.
EXERCISE 7-1. BUILDING THE MARKETING CUBE
In Chapter 5, you created three views of the Orders activity. The Manufacturing view has no aggregations. The OrderStatus view uses real-time aggregations, so you don’t need to take any actions to see the data. The Marketing view, however, uses a scheduled aggregation. In order to see data in this view, you will need to build the cube before trying to examine the data.
![]() Note If you didn’t run any data through the system in Chapter 6, the exercises in this chapter won’t display any data. If you didn’t do the exercises in Chapter 6, run the batch file
Note If you didn’t run any data through the system in Chapter 6, the exercises in this chapter won’t display any data. If you didn’t do the exercises in Chapter 6, run the batch file C:pro bam sampleschapter sixfinished.bat.
![]() Note In a production system, the package that builds the cube would normally be scheduled to run on a regular basis. Details of scheduling BAM jobs will be covered in Chapter 13.
Note In a production system, the package that builds the cube would normally be scheduled to run on a regular basis. Details of scheduling BAM jobs will be covered in Chapter 13.
![]() Note If you don’t build the cube, as described in this exercise, any scheduled (non-real-time) aggregations will not be populated, and you’ll be left wondering why there is no data in the portal.
Note If you don’t build the cube, as described in this exercise, any scheduled (non-real-time) aggregations will not be populated, and you’ll be left wondering why there is no data in the portal.
- Open SQL Server Management Studio, click the Connect button in the Object Explorer, and connect to SQL Server Integration Services on your database server.
- Open Stored Packages, and then open MSDB. If you did the exercises in Chapter 5, you should see a package called BAM_AN_Marketing.
- Right-click the BAM_AN_Marketing package, and select Execute Package if you are using SQL Server 2005 or Run Package if you are using SQL Server 2008.
- In the Execute Package Utility dialog box, click the Execute button (see Figure 7-4).
- A Package Execution Progress window will be displayed. Wait until the package has completed execution, and then click the Close button to close the Package Execution Progress window.
- Click the Close button to close the Execute Package utility.
- In SQL Server Management Studio, click the Connect button in the Object Explorer, and connect to SQL Server Analysis Services on your database server.
- Open the Databases icon to show a list of Analysis Services databases. You should see a database called
BAMAnalysisthat contains BAM’s aggregation cubes.- Open the
BAMAnalysisdatabase to open the database objects.- Open the Cubes icon to show a list of cubes.
- Right-click the Marketing cube icon and select Browse. A browse window will appear that contains a list of measures and dimensions. Drag the AgentNumber field to the Row Fields zone. Drag CustomerCountry to the Column Fields zone. Drag Price to the Detail Fields zone. You should see a matrix of total sales by agent number and country, as shown in Figure 7-5.
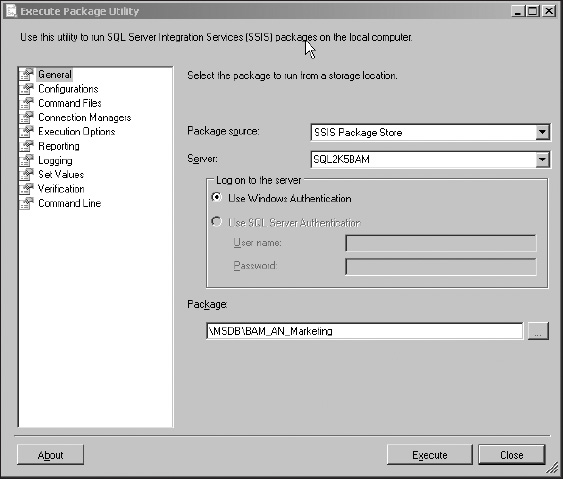
Figure 7-4. The Execute Package Utility dialog box
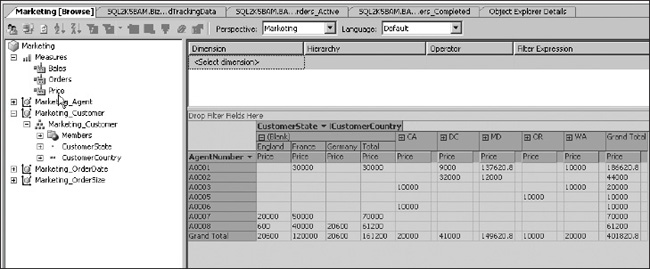
Figure 7-5. The matrix as it appears in SQL Server Management Studio
EXERCISE 7-2. EXAMINING DATA USING THE ACTIVITY SEARCH PAGE
This exercise will demonstrate how to query the views you defined in Chapter 5. In Chapter 5, you created three views onto the order data: Manufacturing, Marketing, and OrderProgress.
![]() Note This exercise depends on Exercise 7-1. Please complete Exercise 7-1 before attempting to use the BAM Portal.
Note This exercise depends on Exercise 7-1. Please complete Exercise 7-1 before attempting to use the BAM Portal.
- Open a new copy of Internet Explorer, and go to
http://<your server name>/bam. If you are running everything on one computer, you can just enterhttp://localhost/bamin the address field.- Examine the navigation column on the left-hand side of the page. You should see a list of the views created in Chapter 5.
- In the Manufacturing view, open Activity Search and then click Orders. In the center of the page, you’ll see a Column Chooser pane. Select some of the columns in the Available Data and Milestones box, and then click the >> button to move these columns to the Items to Show box. (see Figure 7-1 earlier in the chapter for an illustration of this page.)
- When the Items to Show box has items in it, the Execute Query button will be active. Click Execute Query to display a list of all the items in the Manufacturing view.
- Take a look at the Query pane. Select BaleCount in the Business Data drop-down box. Select Greater Than or Equal in the Operator drop-down box. Enter 400 in the Value text box. Click Execute Query again, and you will see a list of orders for more than 400 bales.
- Try selecting some of the other business data items in the Business Data drop-down box. Note that after you select the item, the Operator drop-down list will change to reflect the type you selected. For instance, if the data type is a Business Milestone, the Operator drop-down will change to include operators such as At, On or Before, Before, After, After the Last, and others.
- Within the Value text box, enter the value you wish to query against. Note that the value you enter varies based upon the data type of the Business data item. For instance, if the data type is a Business Milestone, a calendar icon is added to the right of the text box to allow you to select a specific date and time.
- You can add multiple conditions to the query by clicking the Add button for each new condition. Each condition can use either AND or OR.
- Once you have created a useful query, you can save it for reuse later. Click the Save Query button, and a File Download dialog box appears. Click the Save button to save the query on your hard disk.
- To reopen the saved query, click the Browse button to choose the query file to open, and then click the Open Query button to load the query.
- To create an alert from a query, create the query and execute it to ensure that you see the correct data. Then click the Set Alert button. On the Alert Details page, provide a name for the alert and a text message to be included in files or e-mails generated by the alert (see Figure 7-6). Then click Save Alert.
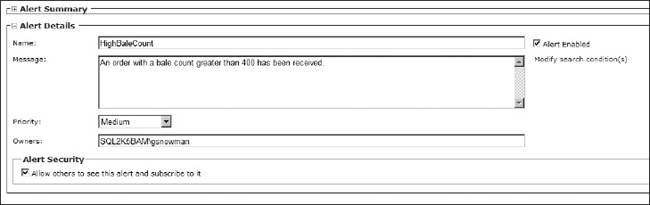
Figure 7-6. The Alert Management page during the creation of an alert
EXERCISE 7-3. EXAMINING DATA USING THE AGGREGATIONS PAGE
In this exercise, you’ll use the Marketing view as an example of a view with aggregations.
- In the BAM Portal, open the Marketing view, click Aggregations, and finally click AgentCountry. You will see an Excel pivot table and an Excel chart; both of these are implemented using Office Web Components. (See Figure 7-2 earlier in this chapter for an illustration of this page.)
- Both the pivot table and the chart provide the power of Excel in the browser. Click the Field List button in the pivot table (see Figure 7-7) to bring up a list of available measures and dimensions.
- Once the Field List is displayed, you can drag dimensions to the rows or columns, and drag measures to the data area. Try dragging CustomerCountry back to the field list, and then drag OrderSize to the Columns area. The button to the right of the Field List button is the Help button; click the Help button to learn more about working with pivot tables in Excel.
- The Field List button is also available in the Chart View. Again, try changing the measures and dimensions that are used in the chart.

Figure 7-7. The Aggregation page showing the location of the Field List button
EXERCISE 7-4. WORKING WITH ALERTS
In this exercise, you’ll use the Alert Management page to add a subscription to the alert you created in Exercise 7-2.
- In the BAM Portal, open the Manufacturing view, click Alert Management, and finally click Orders. You will see the alert you created in Exercise 7-2. (See Figure 7-3 for an illustration of this page.)
- Click the Add Subscriber button, select e-mail as the transport, and enter an e-mail address for the alert.
![]() Note In order to receive the e-mail, you must have configured an SMTP server with relay enabled as part of the BAM configuration.
Note In order to receive the e-mail, you must have configured an SMTP server with relay enabled as part of the BAM configuration.
Managing Permissions
Like other resources in Windows, a user needs appropriate permissions to see a BAM view. As the administrator of a BizTalk implementation, you will be able to see all views, but your users will need to be added to each view before they get access. To give a user permissions to see a view, use the bm add-account command. As an example, the command bm add-account-AccountName:SERVER1Tony -View:Marketing will give user Tony permissions to see the Marketing view. The bm remove-account command can be used to remove permissions, and the bm get-accounts command returns a list of accounts that have permission to access a view.
Indexing a View
If your users often search on a specific field in an activity, you can improve performance by indexing that field. Use the bm create-index command to create an index. The index will be implemented as a SQL Server database index. The get-index and remove-index commands are also available to manage indexes.
Customizing the BAM Portal
You can customize the appearance of the BAM Portal. It is quite easy to add a logo or graphic to each page of the portal, or to modify the instruction page that appears when the portal is loaded.
EXERCISE 7-5. ADDING A LOGO TO THE BAM PORTAL
EXERCISE 7-6. ADDING AN INSTRUCTION PAGE TO THE BAM PORTAL
Aggregating Data from Multiple BAM Implementations
If you have multiple instances of BAM in your organization, you can provide a single instance of the BAM Portal that allows your users to navigate to all of the available activities and views across all instances of BAM. Use the bm enable-reference command to add links to another set of BAM databases. As an example, if you have two servers, AWO1 and AWO2, and each is a single server implementation of BAM, you would run the command bm enable-reference-TargetServer:AWO2 -TargetDatabase:BAMPrimaryImport on server AWO1 to enable a user viewing the portal on AWO1, http://AWO1/bam, to navigate to the views on AWO2. Similarly, the command bm enable-reference -TargetServer:AWO1 -TargetDatabase:BAMPrimaryImport on server AWO2 will allow navigation in the opposite direction, providing the appearance of a completely seamless integration between the two BAM implementations.
Using Excel to View BAM Aggregations
When you initially created your BAM views in Excel, the BAM Add-In for Excel automatically created pivot tables within the Excel workbook for any view that contained measure and dimensions. Because the pivot table operates on aggregated data, it will only be created for aggregated views.
When you deploy the Excel file, the bm.exe command-line utility will notify you that activity, view, and security have completed successfully, and that it has saved a copy of your workbook file with the extension _LiveData to the same location from which you referenced the definition file.
![]() Note If you export the BAM definition as XML, and then deploy the XML file, the live data workbook won’t be created. In order to create the live data workbook, you must deploy the Excel workbook that contains the view.
Note If you export the BAM definition as XML, and then deploy the XML file, the live data workbook won’t be created. In order to create the live data workbook, you must deploy the Excel workbook that contains the view.
This _LiveData workbook is the same structure as the original workbook except that connection strings and database connections have been added to it. Just as the name implies, the workbook is now feeding off of raw data from your BAM infrastructure.
EXERCISE 7-7. VIEWING BAM DATA USING EXCEL
In this exercise, you’ll use the live version of the Excel workbook to view aggregated data.
![]() Note Once again, this exercise assumes that you deployed the activities created in Chapter 5 and populated them in Chapter 6.
Note Once again, this exercise assumes that you deployed the activities created in Chapter 5 and populated them in Chapter 6.
- Examine the Excel workbook you created during the Chapter 5 exercises, and confirm that you have an XLS file. If you have an XLSX file (i.e., your file is saved in Excel 2007 format), open the file using Excel and then save it in the
C:BAMfolder using Excel 97-2003 format.- From the Start menu, right-click Command Prompt, and then select Run As Administrator. This will start a command shell with administrator privilege.
- Change directory to the folder containing the workbook with the activity and view definitions.
Note You must be a local administrator to run the
bm.execommand. These instructions assume that you have a single server installation and you used the default database names. If that is not the way your system is set up, you may need to add the-Serverand-Databaseparameters to thebm.execommand.- Enter the following commands:
path %path%;C:Program FilesMicrosoft BizTalk Server 2009Tracking

bm regenerate-livedataworkbook -workbookname:awo.xls- Using Excel, open the
awo_livedata.xlsfile that was just created. This will open the newly created live data version of the Excel workbook.- Click the Marketing and OrderProgress tabs to view live data in Excel, as shown in Figure 7-8.

The BAM Databases
BAM uses five primary databases, as listed in Table 7-1. Four of the databases are relational; the BAM Analysis database is stored in SQL Server Analysis Services.
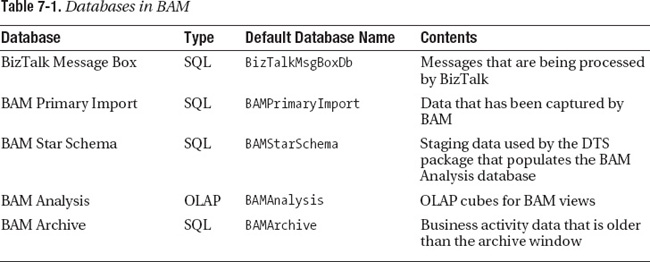
If you need to access the data from a custom application, the recommended approach is to do so through the SQL Server views that are created by the bm.exe tool.
When you issue the deploy-all command for your observation model, BAM automatically creates the underlying data model for your activities and views. The activities in BAM Primary Import are partitioned for archival and performance purposes into multiple tables, so it’s best to use the SQL Server views, which aggregate data from all the partition tables.
Microsoft has committed to maintaining the structure of the views in future versions of the product, so you can read the view data using any programming tool that works with SQL Server. It’s recommended, however, that you don’t update the database directly; use the BAM API instead when you need to write new activity data.
![]() Note The BAM API is covered in Chapter 10.
Note The BAM API is covered in Chapter 10.
There’s a vocabulary problem that makes this topic confusing. The term view is used with two different meanings. A SQL Server view is a virtual table that is defined using a SELECT statement. A BAM view is derived from an activity by subsetting, aggregation, or aliasing. SQL Server views are used to implement both BAM activities and BAM views. Table 7-2 lists the SQL Server views that are used to define BAM activities and BAM views. The Type column in Table 7-2 indicates whether each SQL Server view is part of a BAM activity or a BAM view.

Reading Data from SQL Server
Reading data from the SQL Server views is quite simple. Listing 7-1 shows some C# code that reads data from the BAM Primary Import database.
Listing 7-1. ADO.NET Code Sample to Read from a SQL Server View
//This code assumes the view name has been generated

//in a secure manner. Do not let the user enter the

//view name because of the risk of SQL injection

//attacks.

public SqlDataReader GetView(string viewName)

   {

      //Create connection

      string connectionString = @"Server=BIZTALK2009;Database=BAMPrimaryImport;"+

@"User ID=BIZTALK2009Administrator;Password=password;"+

@"Trusted_Connection=False;";

      SqlConnection myConnection = new

          SqlConnection(connectionString);


      //Create command

      SqlCommand myCommand =

          myConnection.CreateCommand();

      myCommand.CommandText =

          "SELECT * FROM " + viewName;

      myCommand.CommandTimeout = 120;


      //Mark the Command as text

      myCommand.CommandType = CommandType.Text;


      //Execute the command and return

      //the SqlDataReader result

      myConnection.Open();

      return myCommand.ExecuteReader

          (CommandBehavior.CloseConnection);

}
BAM and OLAP
Scheduled aggregation data is stored in the BAM Analysis database so that it may be aggregated over time and analyzed. Because the data is stored in a cube as opposed to a traditional SQL table, you would query the data using multidimensional technologies such as MDX and ADOMD.NET.
ADOMD.NET is a set of .NET objects used to read from OLAP-based cubes in the Microsoft. AnalysisServices.AdomdClient namespace. To use these objects, you’ll need to reference the Microsoft.AnalysisServices.ADOMDclient.dll file. MDX, or Multidimensional Expressions, is a query language. It’s analogous to SQL but allows you to query multidimensional databases. The query shown in Listing 7-2 will get a list of average order prices tabulated by agent and quarter from the Marketing view cube.
Listing 7-2. An MDX Query for the MOLAP Cube Created in Chapter 5
WITH MEMBER [Measures].[Average Price]

AS 'AVG({[Marketing_Agent].[Marketing_Agent].Members}, [Measures].[Price])'

SELECT

NON EMPTY

{

CROSSJOIN

(

{[Measures].[Orders],

[Measures].[Price],

[Measures].[Average Price]},

[Marketing_OrderDate].[Marketing_OrderDate].&[2009].Children

)

} ON COLUMNS,

{

ORDER({[Marketing_Agent].[Marketing_Agent].Members}, [Measures].[Orders], DESC)

} ON ROWS

FROM

[Marketing]
EXERCISE 7-8. VIEWING BAM DATA IN SQL SERVER MANAGEMENT STUDIO
In this exercise, you’ll take another look at the data you’ve already viewed in the portal, but this time you’ll drill into the structure of the data by using SQL Server Management Studio.
![]() Note Once again, this exercise assumes that you deployed the activities created in Chapter 5 and populated them in Chapter 6.
Note Once again, this exercise assumes that you deployed the activities created in Chapter 5 and populated them in Chapter 6.
- From the Start menu, click either Microsoft SQL Server 2005 or Microsoft SQL Server 2008, and then select SQL Server Management Studio.
- Connect to the relational database engine on whatever server holds the BAM Primary Import databases (see Figure 7-9).
- You should see several BAM-related databases. The data you captured in Chapter 6 will be in the
BAMPrimaryImportdatabase. Click the plus sign next to the database name, and then click the plus sign next to the Tables icon. You should see several tables that have names beginning withbam_. Some of these tables contain activities, and some contain metadata. The Orders activity you created in Chapter 5 is contained in tables that have names that begin withbam_Orders.- Right-click the
bam_Orders_Activetable, and then select Open Table. This table should contain the activity items that are still in flight. These are the items indicating where either the orchestration has not completed or the manufacturing instructions have not been sent.- Right-click the
bam_Orders_Completedtable, and then select Open Table. You should observe the completed activities, as shown in Figure 7-10.
Figure 7-9. Viewing the BAM databases
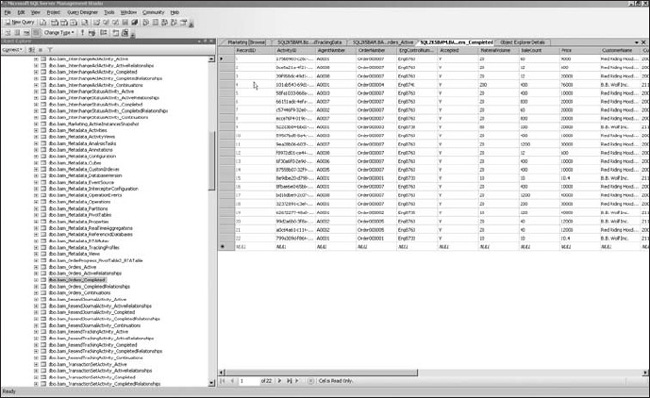
Figure 7-10. The
bam_Orders_Completedtable- Right-click
bam_Orders_ActiveRelationshipsandbam_Orders_CompletedRelationships, and then open them. These tables will be empty, as there are no relationships in this data.
- Click the plus sign next to the Views icon, to show the list of views defined in the database. Note that one BAM view corresponds to a set of several SQL Server views. The manufacturing BAM view is contained in SQL views that have names that start with bam_Manufacturing_ViewOrders.
- Right-click bam_Manufacturing_ViewOrders_View and then select Open View. You will see all the activities in the view, including the aliases (see Figure 7-11). Because this is a view, the data is only stored once, although it can be selected from the view using either its original name or the alias name.
- Right-click bam_Manufacturing_ViewOrders_View and select Script View As
CREATE TO

Figure 7-11. The bam_ Manufacturing_ViewOrders_View view
- Right-click bam_Manufacturing_ViewOrders_CompletedAliasView and select Script View As
- Examine bam_OrderProgress_ViewOrders_CompletedAliasView. This view defines the durations that you created when you built the COO view.
- The OrderProgress view uses real-time aggregation, so let’s examine the way this is implemented. Right-click bam_OrderProgress_ViewOrders_view and select Open View. You will see the individual data items in the view.
- Right-click bam_OrderProgress_ProgressTable_RTAWindowView and select Open View. You will see the aggregate data for the view.
- Return to the Tables list, and find the
BAM_Orders_Activetable. Open the Triggers list for this table, and then double-click the bam_ OrderProgress_ProgressTable_RTAActiveTrigger. You will see that each time a row is inserted, updated, or deleted, the trigger fires to keep the aggregations up to date.- Find the
BAM_Orders_Completedtable. Open the Triggers list for this table, and then double-click the bam_ OrderProgress_ProgressTable_RTACompletedTrigger. This trigger fires when a new item is inserted into theBAM_Orders_Completedtable.
![]() Note See Exercise 7-1 for an example of viewing data from the BAM Analysis database in SQL Server Management Studio.
Note See Exercise 7-1 for an example of viewing data from the BAM Analysis database in SQL Server Management Studio.
Enhancing BAM Data with Lookups
When you’re designing your observation models, you’ll need to decide how much information to include. At AWO, the BAM activity just includes the agent number, but a less normalized observation model might also have included the agent name, state, and country. Another example is customers; the activity could have included just the customer number, or it could also include the customer name, state, country, industry code, and so forth. The smaller activity will use less database space and perform better. An activity that includes additional information will allow users to see information in a format that is easier for them with no additional effort from the development team.
Usually, we prefer to optimize for performance by capturing just the key data. As an example, we would capture just agent number and customer number, because agent number is the key for the agent table in our database, and customer number is the primary key for customers. Then we’ll use the data presentation tier to expand the captured data so that users can query and display the fields they want to see.
We have used two main techniques for showing additional data to the users. For scheduled aggregations, you can modify the cube and aggregation package to add additional lookup data. For real-time aggregations, we often use SQL Server Reporting Services Report Builder to query the data and create a report model that links the BAM data to the appropriate lookup tables.
Often, after the BAM solution has been in production for a while, it is realized that showing additional data to the users would have been helpful. Using lookup techniques allows additional fields to be added without compromising the BAM data that has already been captured.
As an example, at AWO, the agent’s name, the order creation date, and the name of the engineer responsible for accepting or rejecting the order were not captured in the BAM activity. SQL Server Reporting Services are used to create reports that include additional details on both agents and customers.
Summary
This chapter has focused on consuming BAM data. There are two built-in presentation tools for BAM data: an ASP.NET application called the BAM Portal and live data Excel workbooks. The chapter described both these tools and provided exercises. An additional exercise described the process for building a scheduled view.
BAM data is stored in SQL Server and may be queried by using SQL Server views that are created when the observation model is loaded using bm.exe. The chapter described the BAM databases and the SQL Server views they contain. Finally, the chapter also covered the concept of lookups.
Chapter 11 will show more examples of reading data directly from the SQL Server views, including an exercise that uses SQL Server Reporting Services.
Part 2 of the book has covered the complete process for implementing BAM to capture data from BizTalk. Part 3, which starts with the next chapter, focuses on other data sources: Windows Communication Foundation, Windows Workflow Foundation, and the BAM API.