
7
Introducing Project Cost Management
CERTIFICATION OBJECTIVES
7.01 Estimating the Project Costs
7.02 Analyzing Cost Estimating Results
7.03 Creating a Project Budget
7.04 Implementing Cost Control
7.05 Measuring Project Performance
Projects cost money. Ever worked with a client who had a huge vision for a project, but little capital to invest in that vision? Or worked with a client who gasped when you revealed how much it would cost to complete their desired scope of work? Or have you been fortunate and had a customer who accepted the costs for the project at face value, made certain the funds were available, and sent you on your way to complete the work? As a general rule, management and customers are always concerned with how much a project is going to cost in relation to how much a project is going to earn.
Most likely, there is more negotiating, questioning, and evaluating for larger projects than for smaller ones. The relationship between the project cost and the project scope should be direct: You get what you pay for. Think it’s possible to buy a mansion at ranch home prices? Not likely. Think it’s possible to run a worldwide marketing campaign at the cost of a postcard mailer? Not likely. A realistic expectation of what a project will cost will give great weight to the project’s scope.
As the business need undergoes analysis, progressive elaboration and estimates are completed based on varying levels of detail, and eventually the cost of the project emerges. Often, however, predicted costs and actual costs vary. Poor planning, skewed assumptions, and overly optimistic estimates all contribute to this. A successful project manager must be able to plan, predict, budget, and control the costs of a project.
Costs associated with projects are not just the costs of goods procured to complete the project. The cost of the labor may be one of the biggest expenses of a project. The project manager must rely on time estimates to predict the cost of the labor to complete the project work. In addition, the cost of the equipment and materials needed to complete the project work must be factored into the project expenses. This chapter examines the management of project costs, how to predict them, account for them, and then, with plan in hand, to control them. We’ll examine exactly how costs are planned for and taken into consideration by the performing organization and how the size of the project affects the cost estimating process.
Estimating the Project Costs
Cost estimating is the process of calculating the costs of the identified resources needed to complete the project work. The person or group doing the estimating must consider the possible fluctuations, conditions, and other causes of variances that could affect the total cost of the estimate.
There is a distinct difference between cost estimating and pricing. A cost estimate is the cost of the resources required to complete the project work. Pricing, however, includes a profit margin. In other words, a company performing projects for other organizations may do a cost estimate to see how much the project is going to cost to complete. Then, with this cost information, they’ll factor a profit into the project work, as shown.


More and more companies are requiring that the project manager calculate the project costs and then factor the ROI and other benefit models into the project product. The goal is to see the value of the project once its deliverables are in operation.
Considering the Cost Estimating Inputs
Cost estimating relies on several project components from the initiation and planning process groups. This process also relies on enterprise environmental factors, the processes and procedures unique to your organization, and the organizational process assets, such as historical information and forms and templates.
Using the Scope Baseline
You’ll need the scope baseline, as it’s the goal of the project team and the stakeholders: to create all of the elements in the project scope to satisfy the requirements of the project. The project scope statement pretty much follows the project manager around throughout the entire project, and it’s useful to ensure that all of the requirements are being met.
At a deeper level, however, you’ll want to rely on the WBS. Of course, the WBS is included—it’s an input to seven major planning processes, all of which deal with costs.
![]() Developing the project management plan This is the overarching project management plan that includes not only the cost management plan but also the information about how the project may be financed, contracted, and what the expectations in the organization are for cost management.
Developing the project management plan This is the overarching project management plan that includes not only the cost management plan but also the information about how the project may be financed, contracted, and what the expectations in the organization are for cost management.
![]() Defining the project activities In some projects, the project has the cost of labor as part of its project expenses, but not in all projects. Any resources, such as equipment and material, will need to be paid for as part of the project budget.
Defining the project activities In some projects, the project has the cost of labor as part of its project expenses, but not in all projects. Any resources, such as equipment and material, will need to be paid for as part of the project budget.
![]() Estimating the project costs You’ll use the WBS to help you identify how much each work package will cost, and this can help you create a definitive estimate (details coming up).
Estimating the project costs You’ll use the WBS to help you identify how much each work package will cost, and this can help you create a definitive estimate (details coming up).
![]() Determining the project budget You can estimate all you want, but you never know how much a project costs until you’re done. The project budget is the cost aggregation and cost reconciliation for each thing, service, and expense the project needs.
Determining the project budget You can estimate all you want, but you never know how much a project costs until you’re done. The project budget is the cost aggregation and cost reconciliation for each thing, service, and expense the project needs.
![]() Planning the project quality There is a cost associated with achieving the expected quality in a project. I’ll discuss that more in Chapter 8.
Planning the project quality There is a cost associated with achieving the expected quality in a project. I’ll discuss that more in Chapter 8.
![]() Identifying the project risks Risks often have a cost element associated with them, and the project manager and organization may create a contingency reserve to offset the risk exposure.
Identifying the project risks Risks often have a cost element associated with them, and the project manager and organization may create a contingency reserve to offset the risk exposure.
![]() Planning the project procurement When the project needs to procure materials, labor, or services, there is a cost element and purchasing process the project manager must follow.
Planning the project procurement When the project needs to procure materials, labor, or services, there is a cost element and purchasing process the project manager must follow.
Along with the WBS, you’ll rely on the WBS dictionary as the third element of the scope baseline. The WBS dictionary provides information on each deliverable and the associated work needed to create the WBS component. In addition, the WBS may be referenced to an organization’s code of accounts. The code of accounts is a coding system used by the performing organization’s accounting system to account for the project work. Estimates within the project must be mapped to the correct code of accounts so that the organization’s ledger reflects the actual work performed, the cost of the work performed, and any billing (internal or external) that was charged to the customer for the completed work.
Referencing the Project Schedule
Resources are more than just people—though people are a primary expense on most projects. The schedule management plan identifies what resources are needed, when they’re needed, and the frequency of the need. Essentially, the schedule management plan is needed so that the project manager and the project team can estimate how much the resources will cost the project, when the funds will be used to employ or consume the resources, and the cost impact should the identified resources miss deadlines within the project.
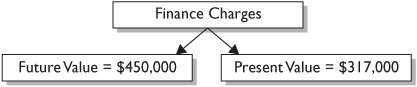
Estimates of the duration of the activities, which predict the length of the project, are needed for decisions on financing the project. The length of the activities will help the performing organization calculate what the total cost of the project will be, including the finance charges. Recall the formula for present value? It’s PV = FV / (1 + i)n; PV is the present value, FV is the future value, i is the interest rate, and n is the number of time periods. The future value of the monies the project will earn may need to be measured against the present value to determine if the project is worth financing, as shown next.
Calculations of the duration of activities are needed in order to extrapolate the total cost of the work packages. For example, if an activity is estimated to last 14 hours and Suzanne’s cost per hour is $80, then the cost of the work package is $1,120. The duration shows management how long the project is expected to last and which activities will cost the most. It also provides the opportunity to resequence activities to shorten the project duration—which consequently shortens the finance period for the project.
Straight-line depreciation allows the organization to write off the same amount each year. The formula for straight-line depreciation is purchase value minus salvage value divided by number of years in use. For example, if the purchase price of a photocopier is $7,000 and the salvage value of the photocopier in five years is $2,000, the formula would read ($7,000 − $2,000) / 5 = $1,000.
Resources can also cost the project if they miss deadlines with penalties, such as a schedule change in a union’s contract, the cost of materials based on seasonal demand, and fines and penalties for failing to adhere to scheduled regulations.
Referencing the Human Resource Plan
The estimator has to know how much each resource costs, and the human resource plan may include this information, depending on the organizational policies, application area, and the type of project being completed. The cost should be in some unit of time or measure—such as cost per hour, cost per metric ton, or cost per use. If the rates of the resources are not known, the rates themselves may also have to be estimated. Of course, skewed rates on the estimates will result in a skewed estimate for the project. There are four categories of cost.
![]() Direct costs These costs are attributed directly to the project work and cannot be shared among projects (airfare, hotels, long distance phone charges, and so on).
Direct costs These costs are attributed directly to the project work and cannot be shared among projects (airfare, hotels, long distance phone charges, and so on).
![]() Indirect costs These costs are representative of more than one project (utilities for the performing organization, access to a training room, project management software license, and so on).
Indirect costs These costs are representative of more than one project (utilities for the performing organization, access to a training room, project management software license, and so on).
![]() Variable costs These costs vary, depending on the conditions applied in the project (the number of meeting participants, the supply and demand of materials, and so on).
Variable costs These costs vary, depending on the conditions applied in the project (the number of meeting participants, the supply and demand of materials, and so on).
![]() Fixed costs These costs remain constant throughout the project (the cost of a piece of rented equipment for the project, the cost of a consultant brought onto the project, and so on).
Fixed costs These costs remain constant throughout the project (the cost of a piece of rented equipment for the project, the cost of a consultant brought onto the project, and so on).
![]()
Value engineering is a systematic approach to finding less costly ways to complete the same work. Project managers do this all the time: choosing the best resource to complete the work the fastest, with the highest quality, or with the appropriate materials while still keeping the overall project costs in check.
Using the Risk Register
I’ve not said much about the risk register in the project. It’s something that I’ll discuss in detail in Chapter 11 on project risk management. However, due to the integrated nature of projects, this is one of those examples where I’ll need to jump ahead just a bit. Risks, as you probably know from your project management experience, can have a positive or negative effect on the outcome of the project. All identified risks, their characteristics, status, and relevant notes are recorded in the risk register.
Most risks, especially the probable, high-impact, negative ones, need to pass through quantitative analysis to determine how much the risk may cost the project in time and cost. Based on risk analysis, the project manager creates a special budget just for the impact of project risks: the risk contingency reserve. You need the risk register here in cost estimating to determine how much cash you’ll need to offset the risk events as part of your cost estimates.
Contingency reserves can also be allotted to deal with those pesky “unknown unknowns” that practically every project has to deal with. The “unknown unknowns” are essentially risks that are lurking within the project but that haven’t been specifically identified by name, source, or probability.
Contingency reserves can be managed a number of different ways. The most common is to set aside an allotment of funds for the identified risks within the project. Another approach is to create a slush fund for the entire project for identified risks and “known unknowns.” The final approach is an allotment of funds for categories of components based on the WBS and the project schedule. You’ll see this again in much more detail later in this book. I hope you’ll be able to sleep between now and Chapter 11.
Using Organizational Process Assets
One of the preferred organizational process assets is historical information. After all, if the project’s been done before, why reinvent the wheel? Historical information is proven information and can come from several places:
![]() Project files Past projects within the performing organization can be used as a reference to predict costs and time. Caution must be taken that the records referenced are accurate, somewhat current, and reflective of what was actually experienced in the historical project.
Project files Past projects within the performing organization can be used as a reference to predict costs and time. Caution must be taken that the records referenced are accurate, somewhat current, and reflective of what was actually experienced in the historical project.
![]() Commercial cost-estimating databases These databases provide estimates of what the project should cost based on the variables of the project, resources, and other conditions.
Commercial cost-estimating databases These databases provide estimates of what the project should cost based on the variables of the project, resources, and other conditions.
![]() Team members Team members may have specific experience with the project costs or estimates. Recollections may be useful, but are highly unreliable when compared to documented results.
Team members Team members may have specific experience with the project costs or estimates. Recollections may be useful, but are highly unreliable when compared to documented results.
![]()
The project team members’ recollections of what things cost should not be trusted as fact. It’s advice and input, but documented information is always better.
![]() Lessons learned Lessons-learned documentation can help the project team estimate the current project if the lessons are from a similar project scope.
Lessons learned Lessons-learned documentation can help the project team estimate the current project if the lessons are from a similar project scope.
There are commercial estimating publications for different industries. These references can help the project estimator confirm and predict the accuracy of estimates. If a project manager elects to use one of these commercial databases, the estimate should include a pointer to this database for future reference and verification.
![]()
All of these inputs mentioned for estimating the project costs are logical; however, your company may have its own approach to cost estimating. That’s fine—the enterprise environmental factors are also an input to cost estimating. Enterprise environmental factors describe the processes and rules that are unique to your organization that you are required to follow.
Estimating Project Costs
Management, customers, and certain stakeholders are all going to be interested in what the project is going to cost to complete. Several approaches to cost estimating exist, which we’ll discuss in a moment. First, however, understand that cost estimates have a way of following the project manager around—especially the lowest initial cost estimate.
The estimates you’ll want to know for the PMP exam, and for your career, are reflective of the accuracy of the information the estimate is based upon. The more accurate the information, the better the cost estimate will be. If you’re steeped in experience in a particular industry, you’ll probably have a good idea of what a project should cost based on your experience. Sometimes you may hire a consultant or rely on experts within your organization to help you predict the cost of a project. That’s great! That’s an example of expert judgment.
Using Analogous Estimating
Analogous estimating relies on historical information to predict the cost of the current project. It is also known as top-down estimating. The process of analogous estimating takes the actual cost of a historical project as a basis for the current project. The cost of the historical project is applied to the cost of the current project, taking into account the scope and size of the current project as well as other known variables.
Analogous estimating is a form of expert judgment. This estimating approach takes less time to complete than other estimating models, but is also less accurate. This top-down approach is good for fast estimates to get a general idea of what the project may cost.
The following is an example of analogous estimating: The Carlton Park Project was to grade and pave a sidewalk around a pond in the community park. The sidewalk of Carlton Park was 1,048 feet by 6 feet, had a textured surface, had some curves around trees, and cost $25,287 to complete. The current project, King Park, will have a similar surface and will cover 4,500 feet by 6 feet. The analogous estimate for this project, based on the work in Carlton Park, is $108,500. This is based on the price per foot of material at $4.02.
As part of the planning process, the project manager must determine what resources are needed to complete the project. Resources include the people, equipment, and materials that will be utilized to complete the work. In addition, the project manager must identify the quantity of the needed resources and when the resources are needed for the project. The identification of the resources, the needed quantity, and the schedule of the resources are directly linked to the expected cost of the project work.
Using Parametric Estimating
Parametric modeling uses a mathematical model based on known parameters to predict the cost of a project. The parameters in the model can vary based on the type of work being completed and can be measured by cost per cubic yard, cost per unit, and so on. A complex parameter can be cost per unit, with adjustment factors based on the conditions of the project. The adjustment factors may have additional modifying factors, depending on additional conditions. For example, parametric estimating could say that the cost per square foot of construction is $28 using standard materials, and then could charge additional fees if the client varies the materials.
To use parametric modeling, the factors the model is based on must be accurate. The factors within the model are quantifiable and don’t vary much based on the effort applied to the activity. And finally, the model must be scalable between project sizes. The parametric model using a scalable cost-per-unit approach is depicted next.

There are two types of parametric estimating.
![]() Regression analysis This is a statistical approach to predict what future values may be, based on historical values. Regression analysis creates quantitative predictions based on variables within one value to predict variables in another. This form of estimating relies solely on pure statistical math to reveal relationships between variables and predict future values. In other words, it helps determine how much an organization needs to move backwards in order to go forwards. It also helps determine the cost of the regression and how long it may take to recoup the cost by the project’s solution.
Regression analysis This is a statistical approach to predict what future values may be, based on historical values. Regression analysis creates quantitative predictions based on variables within one value to predict variables in another. This form of estimating relies solely on pure statistical math to reveal relationships between variables and predict future values. In other words, it helps determine how much an organization needs to move backwards in order to go forwards. It also helps determine the cost of the regression and how long it may take to recoup the cost by the project’s solution.
![]() Learning curve This approach is simple: The cost per unit decreases the more units workers complete because workers learn as they complete the required work. The more an individual completes an activity, the easier it is to complete. The estimate is considered parametric, since the formula is based on repetitive activities, such as wiring telephone jacks, painting hotel rooms, or other activities that are completed over and over within a project. The cost per unit decreases as the experience increases because the time to complete the work is shortened.
Learning curve This approach is simple: The cost per unit decreases the more units workers complete because workers learn as they complete the required work. The more an individual completes an activity, the easier it is to complete. The estimate is considered parametric, since the formula is based on repetitive activities, such as wiring telephone jacks, painting hotel rooms, or other activities that are completed over and over within a project. The cost per unit decreases as the experience increases because the time to complete the work is shortened.
![]()
Don’t worry too much about regression analysis for the exam. Learning curve is the topic you’re more likely to have questions on.
Using Bottom-Up Estimating
Bottom-up estimating starts from zero, accounts for each component of the WBS, and arrives at a sum for the project. It is completed with the project team and can be one of the most time-consuming methods used to predict project costs. While this method is more expensive because of the time invested to create the estimate, it is also one of the most accurate. A fringe benefit of completing a bottom-up estimate is that the project team may buy into the project work since they see the cost and value of each cost within the project.
Creating a Three-Point Cost Estimate
It’s risky to sometimes use just one cost estimate for a project’s activity, especially when it’s work that hasn’t been completed before. And like any project work, you don’t know how much it’s really going to cost until you pay for it. Issues, errors, delays, and unknown risks can affect the project cost. A three-point cost estimate attempts to find the average of the cost of an activity using three factors.
![]() Optimistic cost estimate
Optimistic cost estimate
![]() Most likely cost estimate
Most likely cost estimate
![]() Pessimistic cost estimate
Pessimistic cost estimate
You can then simply sum up the three cost estimate values and divide by three. Or you can use the PERT approach, which is slightly different. PERT is a weighted average to the most likely cost estimate value. The PERT formula is the optimistic cost estimate, plus four times the most likely cost estimate, plus the pessimistic cost estimate. That sum is then divided by six. Figure 7-1 shows the slight difference between a true average of the costs and the PERT approach.
FIGURE 7-1 Costs can be averaged with PERT or three-point estimates.
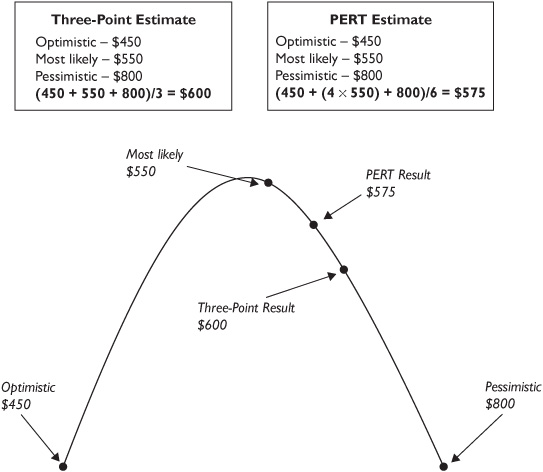
In either approach, the basic average or PERT, you have to create three cost estimates for each activity. This can get tiresome and overwhelming, especially on a larger project. And if you elect to use an average estimate, be certain to document the approach you took and record the actual costs of the project activities for future historical information.
Using Computer Software
While the PMP examination is vendor-neutral, a general knowledge of how computer software can assist the project manager is needed. Several different computer programs are available that can streamline project work estimates and increase their accuracy. These tools can include project management software, spreadsheet programs, and simulations.
Analyzing Vendor Bids
Sometimes it’s just more cost-effective to hire someone else to do the work. Other times, the project manager has no choice because the needed skill set doesn’t exist within the organization. In either condition, the vendors’ bids need to be analyzed to determine which vendor should be selected based on their ability to satisfy the project scope, the expected quality, and the cost of their services. We’ll talk all about procurement in Chapter 12.
Analyzing Cost Estimating Results
The output of cost estimating is the actual cost estimates of the resources required to complete the project work. The estimate is typically quantitative and can be presented in detail against the WBS components or summarized in terms of a grand total according to various phases of the project or its major deliverables. Each resource in the project must be accounted for and assigned to a cost category. Categories include the following:
![]() Labor costs
Labor costs
![]() Material costs
Material costs
![]() Travel costs
Travel costs
![]() Supplies costs
Supplies costs
![]() Hardware costs
Hardware costs
![]() Software costs
Software costs
![]() Special categories (inflation, cost reserve, and so on)
Special categories (inflation, cost reserve, and so on)
The cost of the project is expressed in monetary terms, such as dollars, euros, or yen, so management can compare projects based on costs. It may be acceptable, depending on the demands of the performing organization, to provide estimates in staffing hours or days of work to complete the project along with the estimated costs.
As projects have risks, the cost of the risks should be identified along with the cost of the risk responses. The project manager should list the risks, their expected risk event value, and the response to the risk should it come into play. We’ll cover risk management in detail in Chapter 11.
The project manager also has to consider changes to the project scope. Chances are that if the project scope increases in size, the project budget should reflect these changes. A failure to offset approved changes with an appropriate dollar amount will skew the project’s cost baselines and show a false variance.
Refining the Cost Estimates
Cost estimates can also pass through progressive elaboration. As more details are acquired as the project progresses, the estimates are refined. Industry guidelines and organizational policies may define how the estimates are refined, but there are three generally accepted categories of estimating accuracy.
![]() Rough order of magnitude This estimate is “rough” and is used during the initiating processes and in top-down estimates. The range of variance for the estimate can be from −25 percent to +75 percent.
Rough order of magnitude This estimate is “rough” and is used during the initiating processes and in top-down estimates. The range of variance for the estimate can be from −25 percent to +75 percent.
![]() Budget estimate This estimate is also somewhat broad and is used early in the planning processes and also in top-down estimates. The range of variance for the estimate can be from −10 percent to +25 percent.
Budget estimate This estimate is also somewhat broad and is used early in the planning processes and also in top-down estimates. The range of variance for the estimate can be from −10 percent to +25 percent.
![]() Definitive estimates This estimate type is one of the most accurate. It’s used late in the planning processes and is associated with bottom-up estimating. The range of variance for the estimate can be from −5 percent to +10 percent.
Definitive estimates This estimate type is one of the most accurate. It’s used late in the planning processes and is associated with bottom-up estimating. The range of variance for the estimate can be from −5 percent to +10 percent.
Considering the Supporting Detail
Once the estimates have been completed, the basis of the estimates must be organized and documented to show how the estimates were created. This material, even the notes that contributed to the estimates, may provide valuable information later in the project. Specifically, the supporting detail includes the following:
![]() Information on the project scope work This may be provided by referencing the WBS.
Information on the project scope work This may be provided by referencing the WBS.
![]() Information on the approach used in developing the cost estimates This can include how the estimate was accomplished and the parties involved with the estimate.
Information on the approach used in developing the cost estimates This can include how the estimate was accomplished and the parties involved with the estimate.
![]() Information on the assumptions and constraints made while developing the cost estimates Assumptions and constraints can be wrong and can change the entire cost estimate. The project manager must list what assumptions and constraints were made during the cost estimate in order to communicate with stakeholders how she arrived at the estimate.
Information on the assumptions and constraints made while developing the cost estimates Assumptions and constraints can be wrong and can change the entire cost estimate. The project manager must list what assumptions and constraints were made during the cost estimate in order to communicate with stakeholders how she arrived at the estimate.
![]() Information on the range of variance in the estimate For example, based on the estimating method used, the project cost may be $220,000 ± $15,000. This project cost may be as low as $205,000 or as high as $235,000.
Information on the range of variance in the estimate For example, based on the estimating method used, the project cost may be $220,000 ± $15,000. This project cost may be as low as $205,000 or as high as $235,000.
Developing the Cost Management Plan
The cost management plan details how variances from the project costs will be managed. The performing organization may have policies and procedures on the expected reactions to cost variances within the project. For example, variances over a set dollar amount may prompt the project manager to create a variance report, meet with management, or even initiate an audit.
Creating a Project Budget
Cost budgeting is the process of assigning a cost to an individual work package. The goal of this process is to assign costs to the work in the project so it can be measured for performance. This is the creation of the cost baseline, as shown.
Cost budgeting and cost estimates may go hand in hand, but estimating should be completed before a budget is requested—or assigned. Cost budgeting applies the cost estimates over time. This results in a time-phased estimate for cost, allowing an organization to predict cash flow needs. The difference between cost estimates and cost budgeting is that cost estimates show costs by category, whereas a cost budget shows costs across time.
Developing the Project Budget
Many of the tools and techniques used to create the project cost estimates are also used to create the project budget. The following is a quick listing of the tools you can expect to see on the PMP exam:
![]() Cost aggregation Costs are parallel to each WBS work package. The costs of each work package are aggregated to their corresponding control accounts. Each control account then is aggregated to the sum of the project costs.
Cost aggregation Costs are parallel to each WBS work package. The costs of each work package are aggregated to their corresponding control accounts. Each control account then is aggregated to the sum of the project costs.
![]() Reserve analysis You should be familiar with two reserves for your PMP exam. The first you’ve already learned about: the risk contingency reserve. The second cost reserve is for management reserve, and this chunk of cash is for unplanned changes to the project scope and cost. It’s a buffer of cash for fluctuations for cost, errors, or other increases in project cost. These reserves are not part of the cost baseline, but are part of the project budget. In other words, you don’t use these funds unless there’s a problem in the project.
Reserve analysis You should be familiar with two reserves for your PMP exam. The first you’ve already learned about: the risk contingency reserve. The second cost reserve is for management reserve, and this chunk of cash is for unplanned changes to the project scope and cost. It’s a buffer of cash for fluctuations for cost, errors, or other increases in project cost. These reserves are not part of the cost baseline, but are part of the project budget. In other words, you don’t use these funds unless there’s a problem in the project.
![]() Historical relationships This approach uses a parametric model to extrapolate what costs will be for a project (for example, cost per hour and cost per unit). It can include variables and points based on conditions. This approach might also use a top-down estimate type based on historical information. A top-down estimate is also known as an analogous estimate type.
Historical relationships This approach uses a parametric model to extrapolate what costs will be for a project (for example, cost per hour and cost per unit). It can include variables and points based on conditions. This approach might also use a top-down estimate type based on historical information. A top-down estimate is also known as an analogous estimate type.
![]() Funding limit reconciliation Organizations only have so much cash to allot to projects—and no, you can’t have all the monies right now. Funding limit reconciliation is an organization’s approach to managing cash flow against the project deliverables based on a schedule, milestone accomplishments, or data constraints. This helps an organization plan when monies will be devoted to a project rather than using all of the funds available at the start of a project. In other words, the monies for a project budget will become available based on dates and/or deliverables. If the project doesn’t hit predetermined dates and products that were set as milestones, the additional funding becomes questionable.
Funding limit reconciliation Organizations only have so much cash to allot to projects—and no, you can’t have all the monies right now. Funding limit reconciliation is an organization’s approach to managing cash flow against the project deliverables based on a schedule, milestone accomplishments, or data constraints. This helps an organization plan when monies will be devoted to a project rather than using all of the funds available at the start of a project. In other words, the monies for a project budget will become available based on dates and/or deliverables. If the project doesn’t hit predetermined dates and products that were set as milestones, the additional funding becomes questionable.
Creating the Cost Baseline
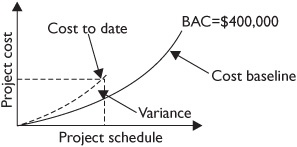
A project’s cost baseline shows what is expected to be spent on the project. It’s usually shown in an S-curve, as in Figure 7-2. The idea of the cost baseline allows the project manager and management to predict when the project will be spending monies and over what time period. The purpose of the cost baseline is to measure and predict project performance.
FIGURE 7-2 Cost baselines show predicted project and phase performance.

Large projects that have multiple deliverables may have multiple cost baselines to illustrate the costs within each phase. In addition, larger projects may have cost baselines to predict spending plans, cash flows of the project, and overall project performance.
The purpose of a cost baseline is to measure performance, and a baseline will predict the expenses over the life of the project. Any discrepancies early on between the predicted baseline and the actual costs serve as a signal that the project is slipping.
Establishing Project Funding Requirements
The project’s cost baseline can help the project manager and the organization determine when the project will need cash infusions. Based on phases, milestones, and capital expenses, the project funding requirements can be mapped to the project schedule and the organization can plan accordingly. This is where the concept of project step funding originates from. The curve of the project’s timeline is funded in steps, where “step” is an amount of funds allotted to the project to reach the next milestone in the project.
![]()
Recall from the project lifecycle that milestones are usually tied to the completion of project phases. Each phase creates a deliverable and usually allows the project to move on to the next phase of project execution. The pause for review and determination of additional funds for the project is called a phase gate.
Implementing Cost Control
Cost control focuses on the ability of costs to change and on the ways of allowing or preventing cost changes from happening. When a change does occur, the project manager must document the change and the reason why the change occurred and, if necessary, create a variance report. Cost control is concerned with understanding why the cost variances, both good and bad, have occurred. The “why” behind the variances allows the project manager to make appropriate decisions on future project actions.
Ignoring the project cost variances may cause the project to suffer from budget shortages, additional risks, or scheduling problems. When cost variances happen, they must be examined, recorded, and investigated. Cost control allows the project manager to confront the problem, find a solution, and then act accordingly. Specifically, cost control focuses on the following activities:
![]() Controlling causes of change to ensure the changes are actually needed
Controlling causes of change to ensure the changes are actually needed
![]() Controlling and documenting changes to the cost baseline as they happen
Controlling and documenting changes to the cost baseline as they happen
![]() Controlling changes in the project and their influence on cost
Controlling changes in the project and their influence on cost
![]() Performing cost monitoring to recognize and understand cost variances
Performing cost monitoring to recognize and understand cost variances
![]() Recording appropriate cost changes in the cost baseline
Recording appropriate cost changes in the cost baseline
![]() Preventing unauthorized changes to the cost baseline
Preventing unauthorized changes to the cost baseline
![]() Communicating the cost changes to the proper stakeholders
Communicating the cost changes to the proper stakeholders
![]() Working to bring and maintain costs within an acceptable range
Working to bring and maintain costs within an acceptable range
Considering Cost Control Inputs
To implement cost control, the project manager must rely on several documents and processes.
![]() Cost performance baseline The cost performance baseline is the expected cost the project will incur. This time-phased budget reflects the amount that will be spent throughout the project. Recall that the cost performance baseline is a tool used to measure project performance. And yes, it’s the same thing as the cost baseline.
Cost performance baseline The cost performance baseline is the expected cost the project will incur. This time-phased budget reflects the amount that will be spent throughout the project. Recall that the cost performance baseline is a tool used to measure project performance. And yes, it’s the same thing as the cost baseline.
![]() Cost management plan The cost management plan dictates how cost variances will be managed.
Cost management plan The cost management plan dictates how cost variances will be managed.
![]() Project funding requirements The funds for a project are not allotted all at once, but stair-stepped in alignment with project deliverables. Thus, as the project moves towards completion, additional funding is allotted. This allows for cash-flow forecasting. In other words, an organization doesn’t need to have all of the project’s budget allotted at the start of the project, but it can predict, based on expected income, that all of the project’s budget will be available in incremental steps.
Project funding requirements The funds for a project are not allotted all at once, but stair-stepped in alignment with project deliverables. Thus, as the project moves towards completion, additional funding is allotted. This allows for cash-flow forecasting. In other words, an organization doesn’t need to have all of the project’s budget allotted at the start of the project, but it can predict, based on expected income, that all of the project’s budget will be available in incremental steps.
![]() Performance reports These reports focus on project cost performance, project scope, and planned performance versus actual performance. The reports may vary according to stakeholder needs. We’ll discuss performance reporting in detail in Chapter 10.
Performance reports These reports focus on project cost performance, project scope, and planned performance versus actual performance. The reports may vary according to stakeholder needs. We’ll discuss performance reporting in detail in Chapter 10.
![]() Change requests When changes to the project scope are requested, an analysis of the associated costs to complete the proposed change is required. In some instances, such as removing a portion of the project deliverable, a change request may reduce the project cost.
Change requests When changes to the project scope are requested, an analysis of the associated costs to complete the proposed change is required. In some instances, such as removing a portion of the project deliverable, a change request may reduce the project cost.
Creating a Cost Change Control System
Sometimes a project manager must add or remove costs from a project. The cost change control system is part of the integrated change control system and documents the procedures to request, approve, and incorporate changes to project costs.
When a cost change enters the system, there is appropriate paperwork, a tracking system, and procedures the project manager must follow to obtain approval on the proposed change. Figure 7-3 demonstrates a typical workflow for cost change approval. If a change gets approved, the cost baseline is updated to reflect the approved changes. If a request gets denied, the denial must be documented for future potential reference.
FIGURE 7-3 A cost change control system tracks and documents cost changes.

Measuring Project Performance
Earned value management (EVM) is the process of measuring the performance of project work against a plan to identify variances. It can also be useful in predicting future variances and the final costs at completion. It is a system of mathematical formulas that compares work performed against work planned and measures the actual cost of the work performed. EVM is an important part of cost control since it allows a project manager to predict future variances from the expenses to date within the project.
![]()
See the video Earned Value Management.
In regard to cost management, EVM is concerned with the relationships between three formulas that reflect project performance. Figure 7-4 demonstrates the connection between the following EVM values:
FIGURE 7-4 Earned value management measures project performance.
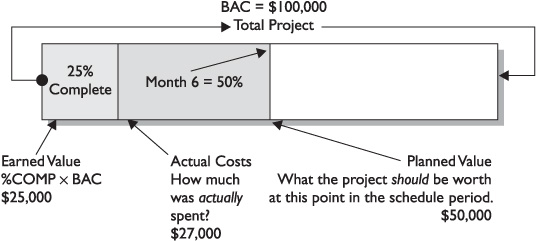
![]() Planned value (PV) Planned value is the work scheduled and the budget authorized to accomplish that work. For example, if a project has a budget of $100,000 and month six represents 50 percent of the project work, the PV for month six is $50,000. The entire project’s planned value—that is, what the project should be worth at completion—is known as the budget at completion. You might also see the sum of the planned value called the performance measurement baseline.
Planned value (PV) Planned value is the work scheduled and the budget authorized to accomplish that work. For example, if a project has a budget of $100,000 and month six represents 50 percent of the project work, the PV for month six is $50,000. The entire project’s planned value—that is, what the project should be worth at completion—is known as the budget at completion. You might also see the sum of the planned value called the performance measurement baseline.
![]() Earned value (EV) Earned value is the physical work completed to date and the authorized budget for that work. For example, if a project has a budget of $100,000 and the work completed to date represents 25 percent of the entire project work, its EV is $25,000.
Earned value (EV) Earned value is the physical work completed to date and the authorized budget for that work. For example, if a project has a budget of $100,000 and the work completed to date represents 25 percent of the entire project work, its EV is $25,000.
![]() Actual cost (AC) Actual cost is the actual amount of monies the project has required to date. For example, if a project has a budget of $100,000 and $35,000 has been spent on the project to date, the AC of the project would be $35,000.
Actual cost (AC) Actual cost is the actual amount of monies the project has required to date. For example, if a project has a budget of $100,000 and $35,000 has been spent on the project to date, the AC of the project would be $35,000.
These three values are key information about the worth of the project to date (EV), the cost of the project work to date (AC), and the planned value of the work to date (PV).
Finding the Variances
At the end of the project, will there be a budget variance (VAR)? Any variance at the end of the project is calculated by subtracting the actual costs (ACs) of the project work from the budget at completion (BAC). The term BAC refers to the estimated budget at completion—what you and the project customer agree the project will likely cost. Of course, you don’t actually know how much the project will cost until it’s completely finished. So throughout the project, a variance is any result that is different from what is planned or expected.
Cost Variances
The cost variance (CV) is the difference between the earned value and the actual costs (AC). For example, for a project that has a budget of $200,000 and has earned or completed 10 percent of the project value, the EV is $20,000. However, due to some unforeseen incidents, the project manager had to spend $25,000 to complete that $20,000 worth of work. The AC of the project, at this point, is $25,000 and the cost variance is −$5,000. Thus, the equation for cost variance is CV = EV − AC.
Schedule Variances
A schedule variance (SV) is the value that represents the difference between where the project was planned to be at a certain point in time and where the project actually is. For example, consider a project with a budget of $200,000 that’s expected to last two years. At the end of year one, the project team has planned that the project be 60 percent complete. Thus, the planned value (PV) for 60 percent completion equates to $120,000—the expected worth of the project work at the end of year one. But let’s say that at the end of year one the project is only 40 percent complete. The EV at the end of year one is, therefore, $80,000. The difference between the PV and the EV is the SV: −$40,000. The equation for schedule variance is SV = EV − PV.
![]()
When it comes to variances, don’t forget the negative signs.
Calculating the Cost Performance Index
The cost performance index (CPI) shows the amount of work the project is completing per dollar spent on the project. In other words, a CPI of 0.93 means it is costing $1.00 for every 93 cents’ worth of work. Or you could say the project is losing seven cents on every dollar spent on the project. Let’s say a project has an EV of $25,000 and an AC of $27,000. The CPI for this project is thus 0.93. The closer the number is to 1, the better the project is doing. The equation for cost performance index is CPI = EV / AC.

CPI is a value that shows how the project costs are performing to plan. It relates the work you’ve accomplished to the amount you’ve spent to accomplish it. A project with a CPI of 0.93 means you’re spending 1.00 for every 0.93 worth of work accomplished. Therefore, a CPI under 1.00 means the project is performing poorly against the plan. However, a CPI over 1.00 does not necessarily mean that the project is performing well either. It could mean that estimates were inflated or that an expenditure for equipment is late or sitting in accounts payable and has not yet been entered into the project accounting cycle.
Finding the Schedule Performance Index
The schedule performance index (SPI) is similar to the CPI. The SPI, however, reveals how closely the project is on schedule. Again, as with the CPI, the closer the quotient is to 1, the better. The formula is EV divided by the PV. In our example, the EV is $20,000, and let’s say the PV, where the project is supposed to be, is calculated as $30,000. The SPI for this project is then 0.67—way off target! The equation for schedule performance index is SPI = EV / PV.
Preparing for the Estimate at Completion
The estimate at completion (EAC) is a hypothesis of what the total cost of the project will be. Before the project begins, the project manager completes an estimate for the project deliverables based on the scope baseline. As the project progresses, there will be in most projects some variances between what the cost estimate was and what the actual cost is. The difference between these estimates is the variance for the deliverable.
![]()
Know this formula for calculating the EAC: EAC = BAC / CPI. It’s the most common of the formulas presented.
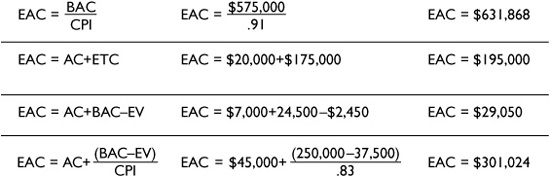
The estimate at completion (EAC) is a prediction of what the final project cost will be based on experiences in the project so far. There are several different formulas for calculating the EAC, as Figure 7-5 demonstrates. For now, and for the exam, here’s the EAC formula you’ll need to know: EAC = BAC / CPI. In our project, the BAC is $200,000. The CPI was calculated to be 0.80. The EAC for this project is $250,000.
FIGURE 7-5 There are many approaches to calculating the EAC.
Considering Project Performance
Another variation of the EAC is to consider the project performance beyond just the CPI. This approach looks at the project performance, good or bad, and considers the actual costs of the project to date, the budget at completion, and the project’s earned value. This EAC formula is: EAC = AC + BAC − EV.
For example, consider a project with a BAC of $350,000 that’s 45 percent complete though it’s supposed to be 60 percent complete. The earned value for this project is 45 percent of the $350,000, which is $157,500. In this scenario, the project has actually spent $185,000—considerably more than what the project should have spent. Let’s plug in this EAC formula. EAC = $185,000 + $350,000 − $157,500. The EAC for this project using this formula would be $377,500.
Consider Project Variances
Sometimes a project may have some wild swings on the project cost variances and the project schedule variances, and you want to take these variances into consideration when predicting the project’s estimate at completion. Usually, it’s the project schedule that’s affecting the project’s ability to meet its cost obligations because the planned value continues to slip, which wrecks the SPI. Add to that the concept that the longer a project takes to complete, the more likely that the project costs will increase.
Here’s this windy formula (get your slide rule out): EAC = AC + [(BAC − EV) / (CPI × SPI)]. I’ll try this one using the same values as the last example. Consider a project with a BAC of $350,000 that’s 45 complete, though it’s supposed to be 60 percent complete. The earned value for this project is 45 percent of $350,000, which is $157,500. In this scenario, the project has actually spent $185,000—considerably more than what the project should have. Here are the parts of our formula:
Actual cost = $185,000
Planned value = $210,000
Budget at completion = $350,000
Earned value = $157,500
Cost performance index = 0.85
Schedule performance index = 0.75
I’ll plug these values into the formula EAC = AC + [(BAC − EV) / (CPI × SPI)]:
EAC = $185,000 + [($350,000 − $157,500) / (0.85 × 0.75)]
EAC = $185,000 + (192,500 / 0.64)
EAC = $185,000 + 300,781.25
EAC = $485,781.25
Finding the Estimate to Complete
The estimate to complete (ETC) shows how much more money will be needed to complete the project. To calculate the ETC, you need to know another formula: the estimate at completion (EAC). Remember that the EAC is what you predict the project will cost based on current conditions. The estimate to complete is a pretty straightforward formula: EAC − AC. Let’s say our EAC was calculated to be $250,000 and that our AC is currently $25,000; our ETC would then be $225,000.
Accounting for Flawed Estimates
Imagine a project to install a new operating system on 1,000 workstations. One of the assumptions the project team made was that each workstation had the correct hardware to install the operating system automatically. As it turns out, this assumption was wrong, and now the project team must change their approach to installing the operating system.
Because the assumption to install the operating system was flawed, a new estimate to complete the project is needed. This is the most accurate approach in estimating how much more the project will cost, but it’s the hardest to do. This new estimate to complete the work is known as the estimate to complete (ETC). The ETC represents how much more money is needed to complete the project work, and its formula is simply a revised estimate of how much more the remaining work will cost to complete. Nothing tricky here.
Accounting for Anomalies
During a project, sometimes weird stuff happens. These anomalies, or weird stuff, can cause project costs to be skewed. For example, consider a project with a $10,000 budget to construct a wooden fence around a property line. One of the project team members makes a mistake while installing the wooden fence and reverses the face of the fencing material. In other words, the material for the outside of the fence faces the wrong direction.
The project now has to invest additional time to remove the fence material, correct the problem, and replace any wood that may have been damaged in the incorrect installation. The project, mistakes and all, is thus considered 20 percent done, so the earned value is $2,000. This anomaly likely won’t happen again, but it will add costs to the project.
For these instances, when events happen but the project manager doesn’t expect similar events to happen again, the following ETC formula should be used: ETC = (BAC − EV). Let’s try this out with our fencing project. The project’s EV is only $2,000 since the project has barely started. The formula would read ETC = $10,000 − $2,000.
![]()
Monies that have been spent on a project are called sunk costs. In evaluating whether a project should continue or not, the sunk costs should not be considered—they are gone forever.
Accounting for Typical Variances
This last ETC formula is used when existing variances in the project are expected to be typical of the remaining variances in the project. For example, a project manager has overestimated the competence of the workers to complete the project work. Because the project team is not performing at the level the project manager expected, work is completed late and in a faulty manner. Rework has been a common theme for this project.
The formula for these instances is ETC = (BAC − EV) / CPI. In our example, let’s say the AC is $45,000, the BAC is $250,000, the EV is $37,500, and our CPI is calculated to be 0.83. The ETC formula for this project is ETC = ($250,000 − $37,500) / 0.83. The result of the formula (following the order of operations) is thus $256,024.
Calculating the To-Complete Performance Index
Imagine a formula that would tell you if the project can meet the budget at completion based on current conditions. Or imagine a formula that can predict if the project can even achieve your new estimate at completion. Well, forget your imagination and just use the to-complete performance index (TCPI). This formula can forecast the likelihood of a project to achieve its goals based on what’s happening in the project right now. There are two different flavors for the TCPI, depending on what you want to accomplish.
![]() If you want to see if your project can meet the budget at completion, you’ll use this formula: TCPI = (BAC − EV) / (BAC − AC).
If you want to see if your project can meet the budget at completion, you’ll use this formula: TCPI = (BAC − EV) / (BAC − AC).
![]() If you want to see if your project can meet the newly created estimate at completion, you’ll use this version of the formula: TCPI = (BAC − EV) / (EAC − AC).
If you want to see if your project can meet the newly created estimate at completion, you’ll use this version of the formula: TCPI = (BAC − EV) / (EAC − AC).
Anything greater than 1 in either formula means that you’ll have to be more efficient than you planned to achieve the BAC or the EAC, depending on whichever formula you’ve used. Basically, the greater the number is over 1, the less likely it is that you’ll be able to meet your BAC or EAC. The lower the number is from 1, the more likely you are to reach your BAC or EAC (again, depending on which formula you’ve used).
Finding the Variance at Completion
Whenever you talk about variances, it’s the difference between what was expected and what was experienced. The formula for the variance at completion (VAC) is VAC = BAC − EAC. In our example, the BAC was $200,000 and the EAC was $250,000, so the VAC is predicted to be $50,000.
The Five EVM Formula Rules
For EVM formulas, the following five rules should be remembered:
1. Always start with EV.
2. Variance means subtraction.
3. Index means division.
4. Less than 1 is bad in an index.
5. Negative is bad in a variance.
The formulas for earned value analysis can be completed manually or through project management software. For the exam, you’ll want to memorize these formulas. Table 7-1 shows a summary of all the formulas, as well as a sample, albeit goofy, mnemonic device.
TABLE 7-1 A Summary of EVM Formulas


These aren’t much to memorize, I know, but you should. While you won’t have an overwhelming amount of EVM questions on your exam, these are free points if you know the formulas and can do the math.
![]()
On McGraw-Hill Professional's Media Center site (see Appendix A), I have a present for you. It's a Microsoft Excel spreadsheet called EV Worksheet. It has all of these formulas in action. I recommend you make up some numbers to test your ability to complete these formulas and then plug your values into Excel to confirm your math. Enjoy!
Additional Planning
Planning is an iterative process. Throughout the project, there will be demands for additional planning—and an output of cost control is one of those demands. Consider a project that must complete by a given date and that also has a set budget. The balance between the schedule and the cost must be kept. The project manager can’t assign a large crew to complete the project work if the budget won’t allow it. The project manager must, through planning, get as creative as possible to figure out an approach to accomplish the project without exceeding the budget.
The balance between cost and schedule is an ongoing battle. While it’s usually easier to get more time than money, this isn’t always the case. Consider deadlines that can’t be moved; or perhaps the company faces fines and penalties; or a deadline that centers on a tradeshow, an expo, or the start of the school year.
Using Computers
It’s hard to imagine a project, especially a large project, moving forward without the use of computers. Project managers can rely on project management software and spreadsheet programs to assist them in calculating actual costs, earned value, and planned value.
It’s not hard to create a spreadsheet with the appropriate earned value formulas. Once the spreadsheet has been created, you can save it as a template and use it on multiple projects. If you want, and if your software allows it, you can tie in multiple earned value spreadsheets to a master file to track all of your projects at a glance.
Considering the Cost Control Results
Cost control is an ongoing process throughout the project. The project manager must actively monitor the project for variances to costs. Specifically, the project manager should always do the following:
![]() Monitor cost variances and then understand why variances have occurred.
Monitor cost variances and then understand why variances have occurred.
![]() Update the cost baseline as needed based on approved changes.
Update the cost baseline as needed based on approved changes.
![]() Work with the conditions and stakeholders to prevent unnecessary changes to the cost baseline.
Work with the conditions and stakeholders to prevent unnecessary changes to the cost baseline.
![]() Communicate to the appropriate stakeholders cost changes as they occur.
Communicate to the appropriate stakeholders cost changes as they occur.
![]() Maintain costs within an acceptable and agreed-upon range.
Maintain costs within an acceptable and agreed-upon range.
Revising the Cost Estimates
As the project progresses and more detail becomes available, there may be a need to update the cost estimates. A revision to the cost estimates requires communication with the key stakeholders to share why the costs were revised. A revision to the cost estimates may have a ripple effect: Other parts of the project may need to be adjusted to account for the changes in cost, the sequence of events may need to be reordered, and resources may have to be changed. In some instances, the revision of the estimates may be expected, as with phased-gate estimating in a long project.
Updating the Budget
Updating the budget is slightly different from revising a cost estimate. Budget updates allow the cost baseline to be changed. The cost baseline is the “before project snapshot” of what the total project scope and the individual WBS components should cost. Should the project scope grow, as shown next, the cost will also likely change to be able to fulfill the new scope.
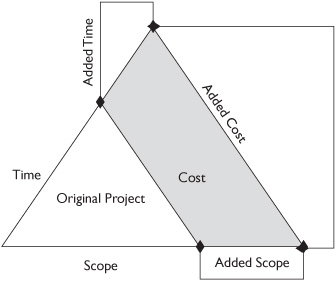
If a project undergoes drastic changes—due to large changes to the project scope, false assumptions, or new demands from the customer—it may be necessary to rebaseline the project cost. Rebaselining is done only in drastic changes, as it essentially resets the project.
Applying Corrective Actions
Throughout a project, the project manager will apply corrective actions. Corrective actions are any actions applied to project performance to bring the project back into alignment with the project plan. Corrective actions can be scheduling changes, a shift in resources, or a different approach to completing the project work—essentially any action, even nudges or shoves, designed to bring the project back to its expected level of performance.
Updating Lessons Learned
As part of cost control, the project manager should update the lessons-learned document to reflect the decisions behind the actions taken. For example, the project manager should identify the following:
![]() Any changes to the cost baseline and why they were approved
Any changes to the cost baseline and why they were approved
![]() Corrective actions and why they were implemented
Corrective actions and why they were implemented
![]() Cost control challenges and issues, and how they were resolved
Cost control challenges and issues, and how they were resolved
![]() Other cost control information that may be beneficial for other projects
Other cost control information that may be beneficial for other projects
CERTIFICATION SUMMARY
There are several contributing factors to cost on any project: the expense of the labor to complete the project, the expense of materials needed to complete the project, and the expense of the equipment needed to complete a project. These expenses must be estimated, planned for, and monitored for a project to finish on budget.
Management and customers will want to know how much a project is going to cost so that they can determine if the project is worth doing, if the project deliverable will be worth the cost, and if the project will be profitable. The estimates for project costs can come in several forms.
![]() Analogous estimating Uses similar historical information to predict the cost of the current project.
Analogous estimating Uses similar historical information to predict the cost of the current project.
![]() Top-down estimating Uses a similar project as a cost baseline and factors in current project conditions to predict costs. Note that analogous estimating is also top-down estimating.
Top-down estimating Uses a similar project as a cost baseline and factors in current project conditions to predict costs. Note that analogous estimating is also top-down estimating.
![]() Parametric estimating Uses a parameter, such as cost per metric ton, to predict project costs.
Parametric estimating Uses a parameter, such as cost per metric ton, to predict project costs.
![]() Bottom-up estimating Starts at zero and adds expenses from the bottom up.
Bottom-up estimating Starts at zero and adds expenses from the bottom up.
The resources needed to complete a project may be one of the biggest expenses in the project’s budget. The activities the resources complete must be worthy of the resources’ time. In other words, the project manager does not want to assign a $125-per-hour engineer to perform filing that a $15-per-hour administrative assistant is qualified to do. Accurate assignment of project resources to project activities helps prevent waste.
Projects also have four different kinds of cost.
![]() Direct costs These costs are attributed directly to the project and cannot be shared with operations or other projects.
Direct costs These costs are attributed directly to the project and cannot be shared with operations or other projects.
![]() Indirect costs These costs can be shared across multiple projects that use the same resources—such as for a training room or piece of equipment.
Indirect costs These costs can be shared across multiple projects that use the same resources—such as for a training room or piece of equipment.
![]() Variable costs Costs that vary depending on the conditions within the project.
Variable costs Costs that vary depending on the conditions within the project.
![]() Fixed costs Costs that remain the same throughout the project.
Fixed costs Costs that remain the same throughout the project.
There is one last cost, called opportunity cost. This is a special cost because it really doesn’t cost the organization anything out of pocket, but rather the cost of a lost opportunity. Opportunity costs are an expense that companies that complete projects for other organizations should realize. When an organization that completes projects for others must forgo one project in order to complete the other, the value of the forgone project is the opportunity cost. For example, let’s say a company has two projects it can complete, but it must choose only one of them. Project A is worth $75,000, while Project B is worth $50,000. If the company chooses Project A, the opportunity cost is thus $50,000 because the company misses out on the opportunity.
KEY TERMS
If you’re serious about passing the PMP exam, memorize these terms and their definitions. For maximum value, create your own flashcards based on these definitions and review them daily.
actual costs The amount of funds the project has spent to date. The difference between actual costs and the earned value will reveal the cost variance.
analogous estimating This relies on historical information to predict estimates for current projects. Analogous estimating is also known as top-down estimating and is a form of expert judgment.
bottom-up estimating A technique where an estimate for each component in the WBS is developed and then totaled for an overall project budget. This is the longest method to complete, but it provides the most accurate estimate.
budget at completion The predicted budget for the project; what the project should cost when it is completed. Budget at completion represents 100 percent of the planned value for the project’s completion.
chart of accounts A coding system used by the performing organization’s accounting system to account for the project work.
cost baseline This shows what the project is expected to spend. It’s usually shown in an S-curve and allows the project manager and management to predict when the project will be spending monies and over what duration. The purpose of the cost baseline is to measure and predict project performance.
cost budgeting A process of assigning a cost to an individual work package. This process shows costs over time. The cost budget results in an S-curve that becomes the cost baseline for the project.
cost change control This is part of the integrated change control system and documents the procedures to request, approve, and incorporate changes to project costs.
cost control An active process to control causes of cost change, to document cost changes, and to monitor cost fluctuations within the project. When changes occur, the cost baseline must be updated.
cost estimating The process of calculating the costs, by category, of the identified resources to complete the project work.
cost management plan A subsidiary plan of the overall project management plan that defines how costs will be estimated, budgeted, and controlled.
cost performance index The process of calculating the costs, by category, of the identified resources to complete the project work.
cost variance The difference between the earned value and the actual costs.
direct costs These costs are attributed directly to the project and cannot be shared with operations or other projects.
earned value The value of the work that has been completed and the budget for that work: EV = % Complete × BAC.
earned value management Earned value management integrates scope, schedule, and cost to give an objective, scalable, point-in-time assessment of the project. EVM calculates the performance of the project and compares current performance against plan. EVM can also be a harbinger of things to come. Results early in the project can predict the likelihood of the project’s success or failure.
estimate at completion A hypothesis of what the total cost of the project will be. Before the project begins, the project manager completes an estimate for the project deliverables based on the WBS. As the project progresses, there will likely be some variances between what the cost estimate was and what the actual cost is. The EAC is calculated to predict what the new estimate at completion will be.
estimate to complete Represents how much more money is needed to complete the project work: ETC = EAC − AC.
estimating publications Typically, a commercial reference to help the project estimator confirm and predict the accuracy of estimates. If a project manager elects to use one of these commercial databases, the estimate should include a pointer to this document for future reference and verification.
fixed costs Costs that remain the same throughout the project.
indirect costs These costs can be shared across multiple projects that use the same resources—such as for a training room or piece of equipment.
parametric modeling A mathematical model based on known parameters to predict the cost of a project. The parameters in the model can vary based on the type of work being done. A parameter can be cost per cubic yard, cost per unit, and so on.
planned value The worth of the work that should be completed by a specific time in the project schedule.
risk An uncertain event that can have a positive or negative influence on the project’s success. It can affect the project costs, project schedule, and often both. All risks and their status should be recorded in the risk register.
schedule performance index This reveals the efficiency of work. The closer the quotient is to 1, the better: SPI = EV / PV.
schedule variance The difference between the planned work and the earned work.
to-complete performance index An earned value management formula that can forecast the likelihood of a project to achieve its goals based on what’s currently happening in the project.
top-down estimating A technique that bases the current project’s estimate on the total of a similar project. A percentage of the similar project’s total cost may be added to or subtracted from the total, depending on the size of the current project.
variable costs Costs that vary, depending on the conditions within the project.
variance The time or cost difference between what was planned and what was actually experienced.
INSIDE THE EXAM
The PMP examination requires that the exam candidate know how to estimate, budget, and manage costs. The WBS is an input to estimating costs since it reflects the whole of the project. When creating the estimates, rely on documented historical information over team members’ recollections. There are three estimating approaches.
![]() Analogous A top-down approach that is less costly and less accurate than others and that offers an idea of what the project will cost.
Analogous A top-down approach that is less costly and less accurate than others and that offers an idea of what the project will cost.
![]() Bottom-up Starts with zero and adds up all the expenses. This is more costly and takes longer, but gains team buy-in to the project.
Bottom-up Starts with zero and adds up all the expenses. This is more costly and takes longer, but gains team buy-in to the project.
![]() Parametric modeling Uses a parameter for labor and goods to calculate the cost of the project.
Parametric modeling Uses a parameter for labor and goods to calculate the cost of the project.
The accuracy of the estimates is based on available information. As the project manager and the project team progressively elaborate on the project plan, more details become available. The more details a project has, the more accurate the estimate. Know the following facts on estimating:
![]() Rough order of magnitude The accuracy of the estimate ranges from −25 percent to +75 percent, and is used in both the initiation process and in top-down estimating.
Rough order of magnitude The accuracy of the estimate ranges from −25 percent to +75 percent, and is used in both the initiation process and in top-down estimating.
![]() Budget estimate The accuracy of the estimate ranges from −10 percent to +25 percent. This is used early in the planning process and also in top-down estimating.
Budget estimate The accuracy of the estimate ranges from −10 percent to +25 percent. This is used early in the planning process and also in top-down estimating.
![]() Definitive estimate The accuracy of the estimate ranges from −5 percent to +10 percent. This is used late in the planning process and in bottom-up estimating.
Definitive estimate The accuracy of the estimate ranges from −5 percent to +10 percent. This is used late in the planning process and in bottom-up estimating.
The resources on a project can include people, materials, and equipment. If the people on a project do not have the necessary skill set to complete the work, hire an SME to guide the project implementation, outsource the project work, or train the current people in the needed skills.
Earned value management is a tool to measure project performance. It is the budget at completion multiplied by the percentage of the project work that has been completed. The cost performance index shows how well the project is performing financially, and is calculated by dividing EV by the actual costs spent on the project. Use the most common formula for finding the estimate at completion: EAC = BAC / CPI.
 TWO-MINUTE DRILL
Estimating the Project Costs
![]() The project manager must know what resources are needed to complete the project work. How will the project ever be completed without the resources? The project manager must know the people, the equipment, materials, and other resources needed to make the vision of the project a reality. Once the resources are identified, the costs of the resources can be calculated.
The project manager must know what resources are needed to complete the project work. How will the project ever be completed without the resources? The project manager must know the people, the equipment, materials, and other resources needed to make the vision of the project a reality. Once the resources are identified, the costs of the resources can be calculated.
![]() The resources also must be known so the project manager can predict, monitor, and control what the project costs are expected to be. The relationship between the project vision and the needed resources can help the project manager work within the predicted costs.
The resources also must be known so the project manager can predict, monitor, and control what the project costs are expected to be. The relationship between the project vision and the needed resources can help the project manager work within the predicted costs.
![]() Resources to complete a project also include services, leases, real estate, and other components that contribute to the project work being completed.
Resources to complete a project also include services, leases, real estate, and other components that contribute to the project work being completed.
Analyzing Cost Estimating Results
![]() Rough order of magnitude estimate This estimate is “rough” and is used during the initiating processes and in top-down estimates. The range of variance for the estimate can be from −25 percent to +75 percent.
Rough order of magnitude estimate This estimate is “rough” and is used during the initiating processes and in top-down estimates. The range of variance for the estimate can be from −25 percent to +75 percent.
![]() Budget estimate This estimate is also somewhat broad and is used early in the planning processes and in top-down estimates. The range of variance for the estimate can be from −10 percent to +25 percent.
Budget estimate This estimate is also somewhat broad and is used early in the planning processes and in top-down estimates. The range of variance for the estimate can be from −10 percent to +25 percent.
![]() Definitive estimate This estimate type is one of the most accurate. It’s used late in the planning processes and is associated with bottom-up estimating. The range of variance for the estimate can be from −5 percent to +10 percent.
Definitive estimate This estimate type is one of the most accurate. It’s used late in the planning processes and is associated with bottom-up estimating. The range of variance for the estimate can be from −5 percent to +10 percent.
![]() Analogous estimating uses a similar project to predict what the costs of the current project should be. It is less accurate, but easier and faster to complete than other methods.
Analogous estimating uses a similar project to predict what the costs of the current project should be. It is less accurate, but easier and faster to complete than other methods.
![]() Parametric estimating uses a parameter for units of goods and time to calculate what the project will cost, for example, cost per hour, cost per metric ton, or cost per cubic yard.
Parametric estimating uses a parameter for units of goods and time to calculate what the project will cost, for example, cost per hour, cost per metric ton, or cost per cubic yard.
Creating a Project Budget
![]() Cost aggregation maps the overall costs to each WBS work package. The costs of each work package are aggregated to their corresponding control accounts. Each control account then is aggregated to the sum of the project costs.
Cost aggregation maps the overall costs to each WBS work package. The costs of each work package are aggregated to their corresponding control accounts. Each control account then is aggregated to the sum of the project costs.
![]() Funding limit reconciliation is an organization’s approach to managing cash flow against the project deliverables based on a schedule, milestone accomplishment, or data constraints. This helps an organization plan when monies will be devoted to a project rather than using all of the funds available at the start of a project. In other words, the monies for a project budget will become available based on dates and/or deliverables.
Funding limit reconciliation is an organization’s approach to managing cash flow against the project deliverables based on a schedule, milestone accomplishment, or data constraints. This helps an organization plan when monies will be devoted to a project rather than using all of the funds available at the start of a project. In other words, the monies for a project budget will become available based on dates and/or deliverables.
Implementing Cost Control
![]() The cost management plan documents how the project manager will react to cost variances within the project. The performing organization will likely have policies and procedures on unacceptable variances.
The cost management plan documents how the project manager will react to cost variances within the project. The performing organization will likely have policies and procedures on unacceptable variances.
![]() Variances that cross a given threshold may require the project manager to create a variance report to explain the variance, why it has happened, and what corrective action has been applied to prevent the variance from recurring.
Variances that cross a given threshold may require the project manager to create a variance report to explain the variance, why it has happened, and what corrective action has been applied to prevent the variance from recurring.
![]() Cost control is the process of monitoring and documenting cost changes, whether they are allowed to occur or are prevented from occurring. The project manager studies the cost changes to understand why the change has happened and then makes corrective actions to the project if needed.
Cost control is the process of monitoring and documenting cost changes, whether they are allowed to occur or are prevented from occurring. The project manager studies the cost changes to understand why the change has happened and then makes corrective actions to the project if needed.
Measuring Project Performance
![]() Planned value is the work scheduled and the budget authorized to accomplish that work. The entire project’s planned value—that is, what the project should be worth at completion—is known as the budget at completion. You might also see the sum of the planned value called the performance measurement baseline.
Planned value is the work scheduled and the budget authorized to accomplish that work. The entire project’s planned value—that is, what the project should be worth at completion—is known as the budget at completion. You might also see the sum of the planned value called the performance measurement baseline.
![]() Earned value is the physical work completed to date and the authorized budget for that work.
Earned value is the physical work completed to date and the authorized budget for that work.
![]() Actual cost is the actual amount of monies the project has required to date.
Actual cost is the actual amount of monies the project has required to date.
![]() The cost variance is the difference between the earned value and the actual costs.
The cost variance is the difference between the earned value and the actual costs.
![]() A schedule variance (SV) is the value that represents the difference between where the project was planned to be at a certain point in time and where the project actually is.
A schedule variance (SV) is the value that represents the difference between where the project was planned to be at a certain point in time and where the project actually is.
![]() The cost performance index (CPI) shows the amount of work the project is completing per dollar spent on the project.
The cost performance index (CPI) shows the amount of work the project is completing per dollar spent on the project.
![]() The schedule performance index (SPI), however, reveals how closely the project is on schedule.
The schedule performance index (SPI), however, reveals how closely the project is on schedule.
![]() The estimate at completion (EAC) is a hypothesis of what the total cost of the project will be.
The estimate at completion (EAC) is a hypothesis of what the total cost of the project will be.
![]() The estimate to complete (ETC) shows how much more money will be needed to complete the project.
The estimate to complete (ETC) shows how much more money will be needed to complete the project.
![]() The to-complete performance index can forecast the likelihood of a project to achieve its goals based on what’s happening in the project right now.
The to-complete performance index can forecast the likelihood of a project to achieve its goals based on what’s happening in the project right now.
Considering the Cost Control Results
![]() Cost control can cause changes and updates within the project for the project scope, schedule, or overall costs. If the cost of material increases, there may be tradeoffs in the project scope to afford the existing materials. The stakeholders or project manager could elect to use a lower grade of material or remove the deliverable from scope, if that’s feasible, to keep the costs in check. Either way, if the cost of materials increases, there’ll be ripples throughout the project.
Cost control can cause changes and updates within the project for the project scope, schedule, or overall costs. If the cost of material increases, there may be tradeoffs in the project scope to afford the existing materials. The stakeholders or project manager could elect to use a lower grade of material or remove the deliverable from scope, if that’s feasible, to keep the costs in check. Either way, if the cost of materials increases, there’ll be ripples throughout the project.
![]() Updating the budget is slightly different from revising a cost estimate. Budget updates allow the cost baseline to be changed. The cost baseline is the “before project snapshot” of what the total project scope and the individual WBS components should cost.
Updating the budget is slightly different from revising a cost estimate. Budget updates allow the cost baseline to be changed. The cost baseline is the “before project snapshot” of what the total project scope and the individual WBS components should cost.
![]() Errors in the project can cause costs to increase. Corrective actions are an effort, technically a change request, to bring the project back into alignment with the cost baseline and what was planned.
Errors in the project can cause costs to increase. Corrective actions are an effort, technically a change request, to bring the project back into alignment with the cost baseline and what was planned.
SELF TEST
1. Which of the following best describes analogous estimating?
A. Regression analysis
B. Bottom-up estimating
C. Less accurate
D. More accurate
2. You are the project manager for the GHG Project. You are about to create the cost estimates for the project. Which input to this process will help you the most?
A. Parametric modeling
B. WBS
C. Project scope
D. Requirements document
3. You are the project manager for the JKH Project. You have elected to use parametric estimating in your cost estimating for the project. Which of the following is an example of parametric estimating?
A. $750 per ton
B. Historical information from a similar project
C. Estimates built bottom-up based on the WBS
D. Estimates based on top-down budgeting
4. You are the project manager for a new technology implementation project. Management has requested that your estimates be as exact as possible. Which one of the following methods of estimating will provide the most accurate estimate?
A. Top-down estimating
B. Top-down budgeting
C. Bottom-up estimating
D. Parametric estimating
5. Your company has been hired to install the tile in 1,000 hotel rooms. All rooms will be identical in nature and will require the same amount of materials. You calculate the time to install the tile in each hotel room at six hours. The cost of labor for each room is calculated at $700. Your project sponsor disagrees with your labor estimate. Why?
A. You haven’t completed one hotel room yet, so you don’t know how long the work will actually take.
B. You have not factored in all of the effort applied to the work.
C. You have not considered the law of diminishing returns.
D. You have not considered the learning curve.
6. You are the project manager for a construction project to build 17 cabins. All of the cabins will be identical in nature. The contract for the project is set at a fixed cost, the incentive being that the faster the project work is completed, the more profitable the job. Management has requested that you study the work method to determine a faster, less costly, and better method of completing the project. This is an example of which one of the following?
A. Time constraint
B. Schedule constraint
C. Value engineering
D. Learning curve
7. You are the project manager for a technical implementation project. The customer has requested that you factor in the after-the-project costs, such as maintenance and service. This is an example of which one of the following?
A. Life-cycle costs
B. Scope creep
C. Project spin-off
D. Operations
8. Which one of the following provides the least accuracy in estimating?
A. Rough order of magnitude
B. Budget estimate
C. Definitive estimate
D. WBS estimate
9. Which one of the following is true?
A. The cost management plan controls how change management affects the BAC.
B. The cost management plan controls how cost variances will be managed.
C. The cost management plan controls how the project manager may update the cost estimates.
D. The cost management plan controls how the BAC may be adjusted.
10. You have just started a project for a manufacturer. Project team members report they are 30 percent complete with the project. You have spent $25,000 out of the project’s $250,000 budget. What is the earned value for this project?
A. 10 percent
B. $75,000
C. $25,000
D. Not enough information to know
11. You and your project team are about to enter a meeting to determine project costs. You have elected to use bottom-up estimating and will base your estimates on the WBS. Which one of the following is not an attribute of bottom-up estimating?
A. People doing the work create the estimates.
B. It creates a more accurate estimate.
C. It’s more expensive to do than other methods.
D. It’s less expensive to do than other methods.
12. What is the present value if an organization expects to make $100,000 four years from now and the annual interest rate is 6 percent?
A. $100,000
B. $79,000
C. $25,000
D. Zero
13. You are the project manager for the construction of a new hotel. Before you begin the cost budgeting process, what is needed?
A. Cost estimates and project schedule
B. Cost estimates and supporting detail
C. EAC and BAC
D. A parametric model to arrive at the costs submitted
14. You are the project manager of the MNJ Project. Your project is falling behind schedule, and you have already spent $130,000 of your $150,000 budget. What do you call the $130,000?
A. Planned value
B. Present value
C. Sunk costs
D. Capital expenditure
15. You are the project manager of the JHD Project. Your project will cost your organization $250,000 to complete over the next eight months. Once the project is completed, the deliverables will begin earning the company $3,500 per month. Which of the following represents the time to recover the costs of the project?
A. Not enough information to know
B. 8 months
C. 72 months
D. 5 years
16. You are the project manager for a consulting company. Your company has two possible projects to manage, but they can only choose one. Project KJH is worth $17,000, while Project ADS is worth $22,000. Management elects to choose Project ADS. The opportunity cost of this choice is which one of the following?
A. $5,000
B. $17,000
C. $22,000
D. Zero, as project ADS is worth more than Project KJH
17. You are the project manager for the CSR Training Project, and 21,000 customer service reps are invited to attend the training session. Attendance is optional. You have calculated the costs of the training facility, but the workbook expense depends on how many students register for the class. For every 5,000 workbooks created, the cost is reduced by a percentage of the original printing cost. The workbook expense is an example of which one of the following?
A. Fixed costs
B. Parametric costs
C. Variable costs
D. Indirect costs
18. You are the project manager of a construction project scheduled to last 24 months. You have elected to rent a piece of equipment for the duration of a project, even though you will need the equipment only periodically throughout the project. The costs of the equipment rental per month are $890. This is an example of which of the following?
A. Fixed costs
B. Parametric costs
C. Variable costs
D. Indirect costs
19. You are the project manager for the Hardware Inventory Project. You have a piece of equipment that was purchased recently for $10,000 and is expected to last five years in production. At the end of the five years, the expected worth of the equipment will be $1,000. Using straight-line depreciation, what is the amount that can be written off each year?
A. Zero
B. $1,000
C. $1,800
D. $2,000
20. You are the project manager of the LKG Project. The project has a budget of $290,000 and is expected to last three years. The project is now 10 percent complete and is on schedule. What is the BAC?
A. $29,000
B. $290,000
C. $96,666
D. $9,666
21. Your project has a budget of $130,000 and is expected to last ten months, with the work and budget spread evenly across all months. The project is now in month three, the work is on schedule, but you have spent $65,000 of the project budget. What is your variance?
A. $65,000
B. $39,000
C. $26,000
D. $64,999
22. You are the project manager of the Carpet Installation Project for a new building. Your BAC is $600,000. You are now 40 percent complete with the project, though your plan called for you to be 45 percent complete with the work by this time. What is your earned value?
A. $240,000
B. $270,000
C. $30,000
D. −$30,000
23. You are the project manager of the Carpet Installation Project for a new building. Your BAC is $600,000. You have spent $270,000 of your budget. You are now 40 percent done with the project, though your plan called for you to be 45 percent done with the work by this time. What is your CPI?
A. 100
B. 89
C. 0.89
D. 0.79
24. You are the project manager for the Facility Installation Project. The project calls for 1,500 units to be installed in a new baseball stadium. Your team wants to know why you have not assigned the same amount of time for the last 800 units as you had for the first 500 units. You tell them it is because of the learning curve. Which one of the following best describes this theory?
A. Production increases as workers become more efficient with the installation procedure.
B. Efficiency increases as workers become more familiar with the installation procedure.
C. Costs decrease as workers complete more of the installation procedure.
D. Time decreases as workers complete more of the installation procedure in the final phases of a project.
25. Of the following, which one is the most reliable source of information for estimating project costs?
A. Historical information from a recently completed project
B. An SME’s opinion
C. Recollections of team members that have worked on similar projects
D. Vendors’ whitepapers
SELF TEST ANSWERS
1. Which of the following best describes analogous estimating?
A. Regression analysis
B. Bottom-up estimating
C. Less accurate
D. More accurate
![]() C. Analogous estimating is less accurate than other estimating methods.
C. Analogous estimating is less accurate than other estimating methods.
![]() A is incorrect, since regression analysis is a type of parametric modeling. B is incorrect, as bottom-up estimating starts with zero and adds up the project costs. D is incorrect, since analogous estimating is not more accurate.
A is incorrect, since regression analysis is a type of parametric modeling. B is incorrect, as bottom-up estimating starts with zero and adds up the project costs. D is incorrect, since analogous estimating is not more accurate.
2. You are the project manager for the GHG Project. You are about to create the cost estimates for the project. Which input to this process will help you the most?
A. Parametric modeling
B. WBS
C. Project scope
D. Requirements document
![]() B. The WBS is the input that can help you the most with the cost estimates.
B. The WBS is the input that can help you the most with the cost estimates.
![]() A is incorrect, as parametric modeling is a form of estimating, not an input. C is incorrect, as the project scope is not an input to the estimating process. D is incorrect, as the requirements document is also not an input to the estimating process.
A is incorrect, as parametric modeling is a form of estimating, not an input. C is incorrect, as the project scope is not an input to the estimating process. D is incorrect, as the requirements document is also not an input to the estimating process.
3. You are the project manager for the JKH Project. You have elected to use parametric estimating in your cost estimating for the project. Which of the following is an example of parametric estimating?
A. $750 per ton
B. Historical information from a similar project
C. Estimates built bottom-up based on the WBS
D. Estimates based on top-down budgeting
![]() A is correct. $750 per ton is an example of parametric estimating.
A is correct. $750 per ton is an example of parametric estimating.
![]() B is incorrect, since historical information is analogous, not parametric. C and D are incorrect, since these do not describe parametric modeling.
B is incorrect, since historical information is analogous, not parametric. C and D are incorrect, since these do not describe parametric modeling.
4. You are the project manager for a new technology implementation project. Management has requested that your estimates be as exact as possible. Which one of the following methods of estimating will provide the most accurate estimate?
A. Top-down estimating
B. Top-down budgeting
C. Bottom-up estimating
D. Parametric estimating
![]() C. Bottom-up estimating provides the most accurate estimates. The project manager starts at zero, the bottom, and accounts for each cost within the project.
C. Bottom-up estimating provides the most accurate estimates. The project manager starts at zero, the bottom, and accounts for each cost within the project.
![]() A, B, and D are all incorrect, since they do not reflect the most accurate method to create an estimate.
A, B, and D are all incorrect, since they do not reflect the most accurate method to create an estimate.
5. Your company has been hired to install the tile in 1,000 hotel rooms. All rooms will be identical in nature and will require the same amount of materials. You calculate the time to install the tile in each hotel room at six hours. The cost of labor for each room is calculated at $700. Your project sponsor disagrees with your labor estimate. Why?
A. You haven’t completed one hotel room yet, so you don’t know how long the work will actually take.
B. You have not factored in all of the effort applied to the work.
C. You have not considered the law of diminishing returns.
D. You have not considered the learning curve.
![]() D is the best choice. As the project team completes more and more units, the time to complete a hotel room should take less and less time.
D is the best choice. As the project team completes more and more units, the time to complete a hotel room should take less and less time.
![]() Choices A, B, and C are incorrect, since they do not answer the question as fully as answer D.
Choices A, B, and C are incorrect, since they do not answer the question as fully as answer D.
6. You are the project manager for a construction project to build 17 cabins. All of the cabins will be identical in nature. The contract for the project is set at a fixed cost, the incentive being that the faster the project work is completed, the more profitable the job. Management has requested that you study the work method to determine a faster, less costly, and better method of completing the project. This is an example of which one of the following?
A. Time constraint
B. Schedule constraint
C. Value engineering
D. Learning curve
![]() C. Value engineering is a systematic approach to finding less costly ways to complete the same work.
C. Value engineering is a systematic approach to finding less costly ways to complete the same work.
![]() A and B are not correct, since this situation does not describe a specific time or cost constraint. D is incorrect, since the learning curve happens as the project team completes the work. Value analysis is the study of a process in order to complete the work faster and more affordably.
A and B are not correct, since this situation does not describe a specific time or cost constraint. D is incorrect, since the learning curve happens as the project team completes the work. Value analysis is the study of a process in order to complete the work faster and more affordably.
7. You are the project manager for a technical implementation project. The customer has requested that you factor in the after-the-project costs, such as maintenance and service. This is an example of which one of the following?
A. Life-cycle costs
B. Scope creep
C. Project spin-off
D. Operations
![]() A. The after-project costs are known as the life-cycle costs.
A. The after-project costs are known as the life-cycle costs.
![]() Though tempting, choices B and C are incorrect because they do not describe the process of calculating the ongoing expenses of the product the project is creating. D is incorrect. Operations do not fully describe the expenses unique to the product.
Though tempting, choices B and C are incorrect because they do not describe the process of calculating the ongoing expenses of the product the project is creating. D is incorrect. Operations do not fully describe the expenses unique to the product.
8. Which one of the following provides the least accuracy in estimating?
A. Rough order of magnitude
B. Budget estimate
C. Definitive estimate
D. WBS estimate
![]() A. The rough order of magnitude is the least accurate approach, since it may vary from −25 percent to +75 percent.
A. The rough order of magnitude is the least accurate approach, since it may vary from −25 percent to +75 percent.
![]() Choices B and C are more accurate estimates than the rough order of magnitude. D is not a valid answer for this question.
Choices B and C are more accurate estimates than the rough order of magnitude. D is not a valid answer for this question.
9. Which one of the following is true?
A. The cost management plan controls how change management affects the BAC.
B. The cost management plan controls how cost variances will be managed.
C. The cost management plan controls how the project manager may update the cost estimates.
D. The cost management plan controls how the BAC may be adjusted.
![]() B. The cost management plan controls how cost variances will be managed.
B. The cost management plan controls how cost variances will be managed.
![]() Choices A, C, and D are incorrect descriptions of the cost management plan.
Choices A, C, and D are incorrect descriptions of the cost management plan.
10. You have just started a project for a manufacturer. Project team members report they are 30 percent complete with the project. You have spent $25,000 out of the project’s $250,000 budget. What is the earned value for this project?
A. 10 percent
B. $75,000
C. $25,000
D. Not enough information to know
![]() B. The earned value is 30 percent of the project’s budget.
B. The earned value is 30 percent of the project’s budget.
![]() Choice A is not a valid answer for the question. C and D are incorrect responses, since they do not answer the question either.
Choice A is not a valid answer for the question. C and D are incorrect responses, since they do not answer the question either.
11. You and your project team are about to enter a meeting to determine project costs. You have elected to use bottom-up estimating and will base your estimates on the WBS. Which one of the following is not an attribute of bottom-up estimating?
A. People doing the work create the estimates.
B. It creates a more accurate estimate.
C. It’s more expensive to do than other methods.
D. It’s less expensive to do than other methods.
![]() D. Using bottom-up estimating is not less expensive to do.
D. Using bottom-up estimating is not less expensive to do.
![]() A, B, and C are not correct choices, since these are attributes of a bottom-up estimating process.
A, B, and C are not correct choices, since these are attributes of a bottom-up estimating process.
12. What is the present value if an organization expects to make $100,000 four years from now and the annual interest rate is 6 percent?
A. $100,000
B. $79,000
C. $25,000
D. Zero
![]() B. The present value of $100,000 four years from now can be calculated by using this formula: present value = FV / (1 + i)n. FV is the future value, i is the interest rate, and n is the number of time periods.
B. The present value of $100,000 four years from now can be calculated by using this formula: present value = FV / (1 + i)n. FV is the future value, i is the interest rate, and n is the number of time periods.
![]() Choices A, C, and D are all incorrect answers because they don’t reflect the present value.
Choices A, C, and D are all incorrect answers because they don’t reflect the present value.
13. You are the project manager for the construction of a new hotel. Before you begin the cost budgeting process, what is needed?
A. Cost estimates and project schedule
B. Cost estimates and supporting detail
C. EAC and BAC
D. A parametric model used to arrive at the costs submitted
![]() A. Cost estimates and the project schedule are inputs to the cost budgeting process.
A. Cost estimates and the project schedule are inputs to the cost budgeting process.
![]() Choices B, C, and D are all incorrect because they are not inputs to cost budgeting.
Choices B, C, and D are all incorrect because they are not inputs to cost budgeting.
14. You are the project manager of the MNJ Project. Your project is falling behind schedule, and you have already spent $130,000 of your $150,000 budget. What do you call the $130,000?
A. Planned value
B. Present value
C. Sunk costs
D. Capital expenditure
![]() C. Sunk costs are monies that have been spent.
C. Sunk costs are monies that have been spent.
![]() A is incorrect because planned value is the amount the project should be worth at this point in the schedule. B is also incorrect; present value is the current value of future monies. D is incorrect because a capital expenditure is money spent to purchase a long-term asset, such as a building.
A is incorrect because planned value is the amount the project should be worth at this point in the schedule. B is also incorrect; present value is the current value of future monies. D is incorrect because a capital expenditure is money spent to purchase a long-term asset, such as a building.
15. You are the project manager of the JHD Project. Your project will cost your organization $250,000 to complete over the next eight months. Once the project is completed, the deliverables will begin earning the company $3,500 per month. Which of the following represents the time to recover the costs of the project?
A. Not enough information to know
B. 8 months
C. 72 months
D. 5 years
![]() C. The time to recoup the monies from the project is 72 months. This is calculated by dividing the ROI of $3,500 per month into the project cost.
C. The time to recoup the monies from the project is 72 months. This is calculated by dividing the ROI of $3,500 per month into the project cost.
![]() A is an incorrect answer. B is incorrect; eight months is the amount of time left in the project schedule. D, five years, is also incorrect.
A is an incorrect answer. B is incorrect; eight months is the amount of time left in the project schedule. D, five years, is also incorrect.
16. You are the project manager for a consulting company. Your company has two possible projects to manage, but they can only choose one. Project KJH is worth $17,000, while Project ADS is worth $22,000. Management elects to choose Project ADS. The opportunity cost of this choice is which one of the following?
A. $5,000
B. $17,000
C. $22,000
D. Zero, as project ADS is worth more than Project KJH
![]() B. The opportunity cost is the amount of the project that was not chosen.
B. The opportunity cost is the amount of the project that was not chosen.
![]() A is incorrect. $5,000 is the difference between the two projects. It is not the opportunity cost. C is incorrect, since $22,000 is the amount of the project that was selected. D is also an incorrect answer.
A is incorrect. $5,000 is the difference between the two projects. It is not the opportunity cost. C is incorrect, since $22,000 is the amount of the project that was selected. D is also an incorrect answer.
17. You are the project manager for the CSR Training Project, and 21,000 customer service reps are invited to attend the training session. Attendance is optional. You have calculated the costs of the training facility, but the workbook expense depends on how many students register for the class. For every 5,000 workbooks created, the cost is reduced by a percentage of the original printing cost. The workbook expense is an example of which one of the following?
A. Fixed costs
B. Parametric costs
C. Variable costs
D. Indirect costs
![]() C. This is an example of variable costs. The more students that register to take the class, the more the cost of the books will be.
C. This is an example of variable costs. The more students that register to take the class, the more the cost of the books will be.
![]() A is incorrect, since the cost of the book varies, depending on the number of students that register for the class. B is incorrect because the cost of each book diminishes as more books are created. A parametric cost would remain the same, regardless of how many books were created. D is not correct, since this is not an example of an indirect cost.
A is incorrect, since the cost of the book varies, depending on the number of students that register for the class. B is incorrect because the cost of each book diminishes as more books are created. A parametric cost would remain the same, regardless of how many books were created. D is not correct, since this is not an example of an indirect cost.
18. You are the project manager of a construction project scheduled to last 24 months. You have elected to rent a piece of equipment for the duration of a project, even though you will need the equipment only periodically throughout the project. The costs of the equipment rental per month are $890. This is an example of which of the following?
A. Fixed costs
B. Parametric costs
D. Indirect costs
![]() A. This is a fixed-cost expense of $890 per month—regardless of how often the piece of equipment is used.
A. This is a fixed-cost expense of $890 per month—regardless of how often the piece of equipment is used.
![]() B is incorrect because a parametric cost is a value used to calculate cost per use, cost per metric ton, or cost per unit. While it may at first appear that B is the correct choice, there is no historical information mentioned upon which to base the parametric model. C is incorrect, since the cost does not vary within the project. D is also incorrect; this is a cost attributed directly to the project work.
B is incorrect because a parametric cost is a value used to calculate cost per use, cost per metric ton, or cost per unit. While it may at first appear that B is the correct choice, there is no historical information mentioned upon which to base the parametric model. C is incorrect, since the cost does not vary within the project. D is also incorrect; this is a cost attributed directly to the project work.
19. You are the project manager for the Hardware Inventory Project. You have a piece of equipment that was purchased recently for $10,000 and is expected to last five years in production. At the end of the five years, the expected worth of the equipment will be $1,000. Using straight-line depreciation, what is the amount that can be written off each year?
A. Zero
B. $1,000
C. $1,800
D. $2,000
![]() C. The straight-line depreciation takes the purchase value of the item, minus the salvage price of the item, divided by the number of time periods. In this instance, it would be $10,000 minus $1,000, or $9,000. The $9,000 is divided by five years and equates to $1,800 per year.
C. The straight-line depreciation takes the purchase value of the item, minus the salvage price of the item, divided by the number of time periods. In this instance, it would be $10,000 minus $1,000, or $9,000. The $9,000 is divided by five years and equates to $1,800 per year.
![]() A, C, and D are all incorrect, since they do not reflect the correct calculation.
A, C, and D are all incorrect, since they do not reflect the correct calculation.
20. You are the project manager of the LKG Project. The project has a budget of $290,000 and is expected to last three years. The project is now 10 percent complete and is on schedule. What is the BAC?
A. $29,000
B. $290,000
C. $96,666
D. $9,666
![]() B. The BAC is the budget at completion, which is $290,000.
B. The BAC is the budget at completion, which is $290,000.
![]() A is incorrect because it describes the earned value for the project. C and D are both incorrect values.
A is incorrect because it describes the earned value for the project. C and D are both incorrect values.
21. Your project has a budget of $130,000 and is expected to last 10 months, with the work and budget spread evenly across all months. The project is now in month three, the work is on schedule, but you have spent $65,000 of the project budget. What is your variance?
A. $65,000
B. $39,000
C. $26,000
D. $64,999
![]() C. $26,000 is the variance. This is calculated by subtracting the actual costs of $65,000 from the earned value of $39,000. EV is calculated by taking the 30 percent completion of the project against the BAC. The project is considered to be 30 percent complete because it’s slated for 10 months, is currently in month three, and is on schedule.
C. $26,000 is the variance. This is calculated by subtracting the actual costs of $65,000 from the earned value of $39,000. EV is calculated by taking the 30 percent completion of the project against the BAC. The project is considered to be 30 percent complete because it’s slated for 10 months, is currently in month three, and is on schedule.
![]() A, B, and D are all incorrect calculations for the problem.
A, B, and D are all incorrect calculations for the problem.
22. You are the project manager of the Carpet Installation Project for a new building. Your BAC is $600,000. You are now 40 percent complete with the project, though your plan called for you to be 45 percent complete with the work by this time. What is your earned value?
A. $240,000
B. $270,000
C. $30,000
D. −$30,000
![]() A. The earned value is calculated by multiplying the percentage of completion, 40 percent, by the BAC, which is $600,000, for a value of $240,000.
A. The earned value is calculated by multiplying the percentage of completion, 40 percent, by the BAC, which is $600,000, for a value of $240,000.
![]() B, C, and D are incorrect calculations of the earned value formula.
B, C, and D are incorrect calculations of the earned value formula.
23. You are the project manager of the Carpet Installation Project for a new building. Your BAC is $600,000. You have spent $270,000 of your budget. You are now 40 percent done with the project, though your plan called for you to be 45 percent done with the work by this time. What is your CPI?
A. 100
B. 89
C. 0.89
D. 0.79
![]() C is the correct answer. The EV of $240,000 is divided by the AC of $270,000 for a value of 0.89.
C is the correct answer. The EV of $240,000 is divided by the AC of $270,000 for a value of 0.89.
![]() A and D are incorrect calculations. B is incorrect because the value needs a decimal.
A and D are incorrect calculations. B is incorrect because the value needs a decimal.
24. You are the project manager for the Facility Installation Project. The project calls for 1,500 units to be installed in a new baseball stadium. Your team wants to know why you have not assigned the same amount of time for the last 800 units as you had for the first 500 units. You tell them it is because of the learning curve. Which one of the following best describes this theory?
A. Production increases as workers become more efficient with the installation procedure.
B. Efficiency increases as workers become more familiar with the installation procedure.
C. Costs decrease as workers complete more of the installation procedure.
D. Time decreases as workers complete more of the installation procedure in the final phases of a project.
![]() B. The learning curve allows the cost to decrease as a result of decreased installation time because workers will complete more of the installation procedure.
B. The learning curve allows the cost to decrease as a result of decreased installation time because workers will complete more of the installation procedure.
![]() Choices A, C, and D are all incorrect choices, since they do not correctly describe the learning curve in relation to time and cost.
Choices A, C, and D are all incorrect choices, since they do not correctly describe the learning curve in relation to time and cost.
25. Of the following, which one is the most reliable source of information for estimating project costs?
A. Historical information from a recently completed project
B. An SME’s opinion
C. Recollections of team members that have worked on similar projects
D. Vendors’ whitepapers
![]() A. Of the choices presented, historical information from a recently completed project is the most reliable source of information.
A. Of the choices presented, historical information from a recently completed project is the most reliable source of information.
![]() B, while valuable, is not as proven as historical information. C is incorrect, since recollections are the least reliable source of information. D is also incorrect, though it may prove valuable in the planning process.
B, while valuable, is not as proven as historical information. C is incorrect, since recollections are the least reliable source of information. D is also incorrect, though it may prove valuable in the planning process.