
11
Introducing Project Risk Management
CERTIFICATION OBJECTIVES
11.01 Planning for Risk Management
11.02 Creating the Risk Management Plan
11.04 Using Qualitative Risk Analysis
11.05 Preparing for Quantitative Risk Analysis
11.06 Planning for Risk Responses
Risk is everywhere. From driving a car to parachuting, it’s inherent in the activities we choose. Within a project, risks are unplanned events or conditions that can have a positive or negative effect on its success. Not all risks are bad, but almost all are seen as a threat.
The risks that activities bring are an exchange for the benefits we get from accepting that risk. If a person chooses to jump out of a perfectly good airplane for the thrill of the fall, the exhilaration of the parachute opening, and the view of Earth rushing up, there is still a risk that the chute may not open—a risk that thrill seekers are willing to accept.
Project managers, to some extent, are like these thrill seekers. Parachutists complete training, pack their chutes, check and double-check their equipment, and make certain there’s an emergency chute for those “just-in-case” scenarios. Project managers—good project managers—take a similar approach.
![]()
Positive risks are called opportunities.
Risks in a project, should they come to fruition, can mean total project failure, increased costs, and extended project duration, among other things. Risk often has a negative connotation, but like it does for the parachutist, the acceptance of the risk can also offer a reward. For the parachutist, the risk is certain death—but the reward is the thrill of the activity. For project managers, risk can mean failure, but the reward can mean a time or cost savings, as well as other benefits.
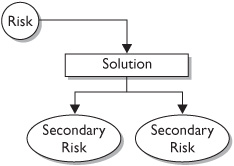
Risk management is the process in which the project manager and project team identify project risks, analyze and rank them, and determine what actions, if any, need to be taken to avert these threats. Associated with this process are the costs, time, and quality concerns of the project brought about by the solutions to those risks. In addition, the reactions to risks are analyzed for any secondary risks the solutions may have created.
In this chapter, we’ll discuss risk management planning, risk identification, analysis, response planning, and monitoring and controlling the identified risks. For the PMP exam, you’ll need a firm grasp on these concepts. You’ll be taking a real risk if you don’t know them well.
Planning for Risk Management
Risk management planning is about making decisions. The project manager, the project team, and other key stakeholders are involved to determine the risk management processes. The risk management processes are related to the scope of the project, the priority of the project within the performing organization, and the impact of the project deliverables. In other words, a simple, low-impact project won’t have the same level of risk planning as a high-priority, complex project. It’s important to complete risk management planning in order to successfully manage, plan for, analyze, and react to identified risks.

Examining Stakeholder Tolerance
Depending on the project, the conditions, and the potential for loss or reward, stakeholders will have differing tolerances for risk. Stakeholders’ risk tolerance may be known at the launch of the project, through written policy statements, or by their actions during the project.
Consider a project to install new medical equipment in a hospital: There’s little room for acceptance of errors because life and death are on the line. No shortcuts or quick fixes are allowed. Now, consider a project to create a community garden. Not only are life and death not on the line in the garden project, but the acceptance of risk is different as well.
![]()
You won’t find the term “utility function” in the PMBOK—they just call it risk tolerance.
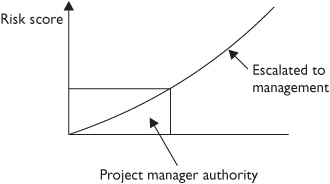
A person’s willingness to accept risk is known as the utility function. The time and money costs required to eliminate the chance of failure is in proportion to the stakeholders’ tolerance of risk on the project. The cost of assuring there are no threats must be balanced with the confidence that the project can be completed without extraordinary costs. Figure 11-1 demonstrates the utility function.
FIGURE 11-1 The priority of the project is relevant to the risk tolerance.

Relying on Risk Management Policies
Organizations often have a predefined approach to risk management. The policies can define the activities to initiate, plan, and respond to risk. The project manager must map the project risk management to these policies to conform to the organization’s requirements. Within the confines of the risk management policy, the project manager must identify any component that can hinder the success of the project. Risk management policies are considered part of the organizational process assets.
Creating the Risk Management Plan
Through planning meetings, the risk management plan is created. Risk management plan templates, performing organization policies, and the risk tolerance level of the stakeholders aid the creation of the risk management plan. Attendees should include:
![]() The project manager
The project manager
![]() Project team leaders
Project team leaders
![]() Key stakeholders
Key stakeholders
![]() Personnel specific to risk management
Personnel specific to risk management
![]() Any other persons of authority involved or who have input required for the risk management processes
Any other persons of authority involved or who have input required for the risk management processes
The goals of the meeting include defining:
![]() The project’s risk management activities
The project’s risk management activities
![]() The costs of risk elements
The costs of risk elements
![]() Risk schedule activities
Risk schedule activities
![]() The assignment of risk responsibilities
The assignment of risk responsibilities
![]() The reliance on templates for risk categories
The reliance on templates for risk categories
![]() Definitions for the level of risk
Definitions for the level of risk
![]() The relevant risk probability and impact matrix definitions for the project type
The relevant risk probability and impact matrix definitions for the project type
The risk management meetings are iterative processes that guide the identification, ranking, and responses to the identified risks. Risk management meetings will be held throughout the project duration to assess risk, risk responses, and the overall status of risks within the project.
Examining the Risk Management Plan
The risk management plan does not detail the planned responses to individual risks within the project—this is the purpose of the risk response plan. The risk management plan is responsible for determining:
![]() How risks will be identified
How risks will be identified
![]() How quantitative analysis will be completed
How quantitative analysis will be completed
![]() How qualitative analysis will be completed
How qualitative analysis will be completed
![]() How risk response planning will happen
How risk response planning will happen
![]() How risks will be monitored
How risks will be monitored
![]() How ongoing risk management activities will happen throughout the project life cycle
How ongoing risk management activities will happen throughout the project life cycle
Methodology
The methodology is concerned with how the risk management processes will take place. The methodology asks the following:
![]() What tools are available to use for risk management?
What tools are available to use for risk management?
![]() What approaches are acceptable within the performing organization?
What approaches are acceptable within the performing organization?
![]() What data sources can be accessed and used for risk management?
What data sources can be accessed and used for risk management?
![]() Which approach is best for the project type and the phase of the project, and which is most appropriate given the conditions of the project?
Which approach is best for the project type and the phase of the project, and which is most appropriate given the conditions of the project?
![]() How much flexibility is available for the project given the conditions, the time frame, and the project budget?
How much flexibility is available for the project given the conditions, the time frame, and the project budget?
Roles and Responsibilities
The roles and responsibilities identify the groups and individuals who will participate in the leadership and support of each of the risk management activities within the project plan. In some instances, risk management teams outside of the project team may have a more realistic, unbiased approach to the risk identification, impact, and overall risk management needs than the actual project team.
Budgeting
Based on the size, impact, and priority of the project, a budget may need to be established for the project’s risk management activities. A project with high priority and no budget allotment for risk management activities may face uncertain times ahead. A realistic dollar amount is needed for risk management activities if the project is to be successful.
Scheduling
The risk management process needs a schedule to determine how often and when risk management activities should happen throughout the project. If risk management happens too late in the project, the project could be delayed because of the time needed to identify, assess, and respond to the risks. A realistic schedule should be developed early in the project to accommodate risks, risk analysis, and risk reaction.
Risk Analysis Scoring
Prior to beginning quantitative and qualitative analysis, a clearly defined scoring system and interpretation of it must be in place. Altering the scoring process during risk analysis—or from analysis to analysis—can skew the seriousness of a risk, its impact, and the effect of the risk on the project. The project manager and the project team must have clearly defined scores that will be applied to the analysis to ensure consistency throughout the project.
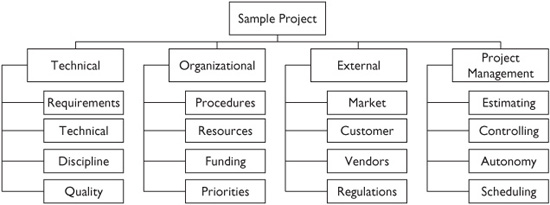
Risk Categories
Based on the nature of the work, there should be identified categories of risks within the project. Figure 11-2 is one approach to identifying risk categories by using a risk breakdown structure (RBS). Throughout the project, the risk categories should be revisited to update and reflect the current status of the project. If a previous, similar project’s risk management plan is available, the project team may elect to use this plan as a template and tailor the risk categories to the specific project.
FIGURE 11-2 A risk breakdown structure categorizes project risks.
Creating Risk Categories
As risks are identified within the project, they should be categorized. Risk categories should be identified before risk identification begins—and should include common risks that are typical in the industry where the project is occurring. Risk categories help organize, rank, and isolate risks within the project. There are four major categories of risks.
![]() Technical, quality, or performance risks Technical risks are associated with new, unproven, or complex technologies being used on the project. Changes to the technology during the project implementation can also be a risk. Quality risks are the levels set for expectations of impractical quality and performance. Changes to industry standards during the project can also be lumped into this category of risks.
Technical, quality, or performance risks Technical risks are associated with new, unproven, or complex technologies being used on the project. Changes to the technology during the project implementation can also be a risk. Quality risks are the levels set for expectations of impractical quality and performance. Changes to industry standards during the project can also be lumped into this category of risks.
![]() Project management risks These risks deal with faults in the management of the project: the unsuccessful allocation of time, resources, and scheduling; unacceptable work results (low-quality work); and lousy project management as a whole.
Project management risks These risks deal with faults in the management of the project: the unsuccessful allocation of time, resources, and scheduling; unacceptable work results (low-quality work); and lousy project management as a whole.
![]() Organizational risks The performing organization can contribute to the project’s risks through unreasonable cost, time, and scope expectations; poor project prioritization; inadequate funding or the disruption of funding; and competition with other projects for internal resources.
Organizational risks The performing organization can contribute to the project’s risks through unreasonable cost, time, and scope expectations; poor project prioritization; inadequate funding or the disruption of funding; and competition with other projects for internal resources.
![]() External risks These risks are outside of the project but directly affect it: legal issues, labor issues, a shift in project priorities, and weather. “Force majeure” risks can be scary and usually call for disaster recovery rather than project management. These are risks caused by earthquakes, tornados, floods, civil unrest, and other disasters.
External risks These risks are outside of the project but directly affect it: legal issues, labor issues, a shift in project priorities, and weather. “Force majeure” risks can be scary and usually call for disaster recovery rather than project management. These are risks caused by earthquakes, tornados, floods, civil unrest, and other disasters.
Using a Risk Management Plan Template
The performing organization may rely on templates for the risk management plan. The template can guide the project manager and the project team through the planning processes, the risk identification, and the values that may trigger additional planning. Hopefully, the organization allows the template to be modified or appended based on the nature of the project. Since most projects resemble other historical projects, the template may need only minor changes to be adapted to the current project.
A risk management plan may grant the project manager decision-making abilities on risks below a certain threshold. Risks above a preset threshold will have to be escalated to a change control board for a determination of their cost and impact on the project’s success.
Identifying Risks
After completing the risk management plan, it’s time to get to work identifying risks that can hinder the project’s success. Risk identification is the process of identifying the risks and then documenting how their presence can affect the project. Risk identification is an iterative process and can be completed by the project manager, the project team, a risk management team, and even SMEs. In some instances, stakeholders and even people outside of the project can complete additional waves of risk identification.
Preparing for Risk Identification
The risk management plan is one of the key inputs to the risk identification process. It describes how the risks will be identified, the requirements for risk analysis, and the overall management of the risk response process. The risk management plan does not include the actual responses to the risks, but rather the approach to the management of the process. In addition to the risk management plan, there are several other inputs to the risk identification process. The risk management plan components that are referenced here specifically include:
![]() The roles and responsibilities for risk management activities
The roles and responsibilities for risk management activities
![]() The budget for risk management activities
The budget for risk management activities
![]() The schedule for risk management activities
The schedule for risk management activities
![]() Categories of risk
Categories of risk
Relying on Project Planning
Effective risk identification requires an understanding of why the project exists. The people doing the risk identification have to understand the project’s purpose in order to recognize risks that could affect the project. These risk identifiers should understand the customer’s objectives, expectations, and intent.
While all areas of project documentation should be referenced for consistency, the specific project plan components referenced here include:
![]() Risk management plan
Risk management plan
![]() Project documents, including the assumptions log, performance reports, EVM information, and baselines
Project documents, including the assumptions log, performance reports, EVM information, and baselines
![]() Scope baseline
Scope baseline
![]() Duration estimates
Duration estimates
![]() Cost estimates
Cost estimates
![]() Schedule management plan
Schedule management plan
![]() Cost management plan
Cost management plan
![]() Stakeholder register
Stakeholder register
![]() Quality management plan
Quality management plan
![]() Resource requirements
Resource requirements
![]() Enterprise environmental factors
Enterprise environmental factors
![]() Organizational process assets
Organizational process assets
Identifying the Project Risks
Armed with the inputs to risk identification, the project manager and the project team are prepared to begin identifying risks. Risk identification should be a methodical, planned approach. Should risk identification move in several different directions at once, some risks may be overlooked. A systematic, scientific approach is best.
Reviewing Project Documents
One of the first steps the project team can take is to review the project documentation. The project plan, scope, and other project files should be reviewed. Constraints and assumptions should be reviewed, considered, and analyzed for risks. This structured review takes a broad look at the project plan, the scope, and the activities defined within the project.
Testing the Assumptions
All projects have assumptions. Assumption analysis is the process of examining assumptions to see what risks may stem from false assumptions. Examining assumptions is about finding their validity. For example, consider a project to install a new piece of software on every computer within an organization. The project team has made the assumption that all of the computers within the organization meet the minimum requirements to install the software. If this assumption were wrong, cost increases and schedule delays would occur.
This examination also requires a review of assumptions across the whole project for consistency. For example, consider a project with an assumption that a senior employee will be needed throughout the entire project; the cost estimate, however, has been billed at the rate of a junior employee. All assumptions and their conditions should be recorded in the assumptions log. You’ll update this log based on the accuracy of the assumptions and the outcome of assumptions testing.
False assumptions can ruin a project. They can wreck time, cost, and even the quality of a project deliverable. For this reason, assumptions are treated as risks and must be tested and weighed to truncate the possibility of an assumption turning against the project. Assumptions are weighed using two factors.
![]() Assumption stability How reliable is the information that led to this assumption?
Assumption stability How reliable is the information that led to this assumption?
![]() Assumption consequence What is the effect on the project if this assumption is false?
Assumption consequence What is the effect on the project if this assumption is false?
The answers to these two questions will help the project team deliver the project with more confidence. Should an assumption prove to be false, the weight of the assumption consequence may be low to high—depending on the nature of the assumption.
Brainstorming the Project
Brainstorming is likely the most common approach to risk identification. It’s usually completed together as a project team to identify the risks within the project. The risks are identified in broad terms and posted, and then the risks’ characteristics are detailed. The identified risks are categorized and will pass through qualitative and quantitative risk analyses later.
A multidisciplinary team, hosted by a project facilitator, can also complete brainstorming. This approach can include subject matter experts, project team members, customers, and other stakeholders who contribute to the risk identification process.
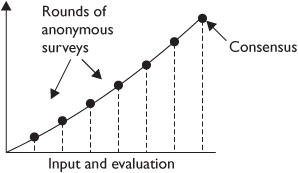
Using the Delphi Technique
The Delphi Technique is an anonymous method to query experts about foreseeable risks within a project, phase, or component of a project. The results of the survey are analyzed by a third party, organized, and then circulated to the experts. There can be several rounds of anonymous discussion with the Delphi Technique—without fear of backlash or offending other participants in the process.
The Delphi Technique is completely anonymous, and the goal is to gain consensus on risks within the project. The anonymous nature of the process ensures that no one expert’s advice overtly influences the opinion of another participant.
Identifying Risks Through Interviews
Interviewing subject matter experts and project stakeholders is an excellent approach to identifying risks on the current project based on the interviewees’ experience. The people responsible for risk identifications share the overall purpose of the project, the project’s WBS, and likely the same assumptions as the interviewee.
The interviewee, through questions and discussion, shares his insight on what risks he perceives within the project. The goal of the process is to learn from the expert what risks may be hidden within the project, what risks this person has encountered on similar work, and what insight the person has into the project work.
Analyzing SWOT
SWOT means strengths, weaknesses, opportunities, and threats. SWOT analysis is the process of examining the project from the perspective of each characteristic. For example, a technology project may identify SWOT as:
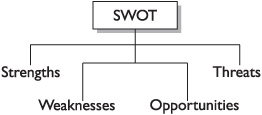
![]() Strengths The technology to be installed in the project has been installed by other large companies in our industry.
Strengths The technology to be installed in the project has been installed by other large companies in our industry.
![]() Weaknesses We have never installed this technology before.
Weaknesses We have never installed this technology before.
![]() Opportunities The new technology will allow us to reduce our cycle time for time-to-market on new products. Opportunities are things, conditions, or events that allow an organization to differentiate itself from competitors and improve its standing in the marketplace.
Opportunities The new technology will allow us to reduce our cycle time for time-to-market on new products. Opportunities are things, conditions, or events that allow an organization to differentiate itself from competitors and improve its standing in the marketplace.
![]() Threats The time to complete the training and simulation may overlap with product updates, new versions, and external changes to our technology portfolio.
Threats The time to complete the training and simulation may overlap with product updates, new versions, and external changes to our technology portfolio.

You can use SWOT analysis as you prepare to pass your PMP exam. Review your end-of-chapter exam scores to see which chapters you’re strong or weak in and which chapters represent your opportunities and threats.
Utilizing Diagramming Techniques
The project team can utilize several diagramming techniques to identify risks.
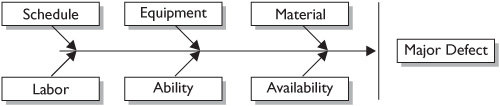
![]() Ishikawa These cause-and-effect diagrams are also called fishbone diagrams. They are great for the root-cause analysis of what factors are causing risks within the project. The goal is to identify and treat the root of the problem, not the symptom.
Ishikawa These cause-and-effect diagrams are also called fishbone diagrams. They are great for the root-cause analysis of what factors are causing risks within the project. The goal is to identify and treat the root of the problem, not the symptom.
![]() Flow charts System or process flow charts show the relationship between components and how the overall process works. These are useful for identifying risks between system components.
Flow charts System or process flow charts show the relationship between components and how the overall process works. These are useful for identifying risks between system components.
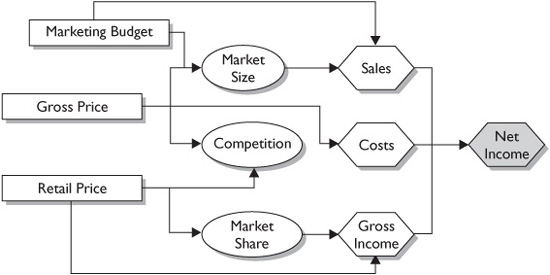
![]() Influence diagrams An influence diagram charts out a decision problem. It identifies all of the elements, variables, decisions, and objectives—and how each factor may influence another.
Influence diagrams An influence diagram charts out a decision problem. It identifies all of the elements, variables, decisions, and objectives—and how each factor may influence another.
Creating a Risk Register
The risk register is a project plan component that contains all of the information related to the risk management activities. It’s updated as risk management activities are conducted to reflect the status, progress, and nature of the project risks. The risk register includes the following:
![]() Risks Of course, the most obvious output of risk identification is the risk that has been successfully identified. Recall that a risk is an uncertain event or condition that could potentially have a positive or negative effect on the project’s success.
Risks Of course, the most obvious output of risk identification is the risk that has been successfully identified. Recall that a risk is an uncertain event or condition that could potentially have a positive or negative effect on the project’s success.
![]() Potential responses During the initial risk identification process, there may be solutions and responses to identified risks. This is fine as long as the responses are documented here. Along with the risk responses, the identification of risk triggers may occur. Triggers are warning signs or symptoms that a risk has occurred or is about to occur. For example, should a vendor fail to complete her portion of the project as scheduled, the project completion may be delayed.
Potential responses During the initial risk identification process, there may be solutions and responses to identified risks. This is fine as long as the responses are documented here. Along with the risk responses, the identification of risk triggers may occur. Triggers are warning signs or symptoms that a risk has occurred or is about to occur. For example, should a vendor fail to complete her portion of the project as scheduled, the project completion may be delayed.
![]() The root causes of risk Risk identification can identify why risk conditions exist.
The root causes of risk Risk identification can identify why risk conditions exist.
![]() Updated risk categories Risk identification may prompt the project team to identify new categories of risks. These new categories should be documented in the risk register, and if a risk breakdown structure is utilized, it will need to be updated as well.
Updated risk categories Risk identification may prompt the project team to identify new categories of risks. These new categories should be documented in the risk register, and if a risk breakdown structure is utilized, it will need to be updated as well.
![]()
When you think of “qualitative,” think of qualifying. You are qualifying, or justifying, the seriousness of the risk for further analysis. When you think of quantitative, think of quantifying the risk’s financial effect on the project.
Using Qualitative Risk Analysis
Qualitative risk “qualifies” the risks that have been identified in the project. Specifically, qualitative risk analysis examines and prioritizes the risks based on their probability of occurring and the impact on the project if they did occur. Qualitative risk analysis is a broad approach to ranking risks by priority, which then guides the risk reaction process.
The end result of qualitative risk analysis (once risks have been identified and prioritized) can lead to more in-depth quantitative risk analysis or move directly into risk response planning. Qualitative is subjective, as it’s really a fast human judgment based on experience, a gut feeling, or a best guess about the risk’s impact and probability.
![]()
See the video Using Quantitative Risk Analysis.
Preparing for Qualitative Risk Analysis
The risk management plan is the key input to qualitative risk analysis. The plan will dictate the process, the methodologies to be used, and the scoring model for identified risks. In addition to the risk management plan, the identified risks from the risk register, obviously, will be needed to perform an analysis. These are the risks that will be scored and ranked based on their probability and impact.
The status of the project will also affect the process of qualitative risk analysis. Early in the project, there may be several risks that have not yet surfaced. Later in the project, new risks may become evident and need to pass through qualitative analysis. The status of the project is linked to the available time needed to analyze and study the risks. There may be more time early in the project, while a looming deadline near the project’s end may create a sense of urgency to find a solution for the newly identified risks.
The project type also has some bearing on the process. A project that has never been done before, such as the installation of a new technology, has more uncertainty than a project that has been done repeatedly within an organization. Recurring projects have historical information to rely on, while first-time projects have limited resources to build a risk hypothesis upon.

All risks are based upon some belief, proof, and data. The accuracy and source of the data must be evaluated to determine the level of confidence in the identified risks. A hunch that an element is a risk is not as reliable as measured statistics, historical information, or expert knowledge that an element is a risk. The data precision needed is in proportion to the reality of the risk.
Prior to the risk analysis, a predetermined scale of probability and impact must be in place. There are multiple scales a project manager can elect to use, but generally these should be in alignment with the risk management plan. If the performing organization has a risk management model, the scale identified by the performing organization should be used. (We’ll discuss the scale values in the next section.)
Finally, the assumptions used in the project must be revisited. During the risk identification process, the project team identified and documented the assumptions used within the project. These assumptions will be evaluated as risks to the project’s success.
Completing Qualitative Analysis
Not all risks are worth responding to, while others demand attention. Qualitative analysis is a subjective approach to organizing and prioritizing risks. Through a methodical and logical approach, the identified risks are rated according to probability and potential impact.
The outcome of the ranking determines four things.
![]() It identifies the risks that require additional analysis through quantitative risk analysis.
It identifies the risks that require additional analysis through quantitative risk analysis.
![]() It identifies the risks that may proceed directly to risk response planning.
It identifies the risks that may proceed directly to risk response planning.
![]() It identifies risks that are not critical, project-stopping risks, but that still must be documented.
It identifies risks that are not critical, project-stopping risks, but that still must be documented.
![]() It prioritizes risks.
It prioritizes risks.
Applying Probability and Impact
The project risks are rated according to their probability and impact. Risk probability is the likelihood that a risk event may happen, while risk impact is the consequence that the result of the event will have on the project objectives. Each risk is measured based on its likelihood and its impact. Two approaches exist to ranking risks.
![]() Cardinal scales identify the probability and impact on a numerical value from .01 (very low) to 1.0 (certain).
Cardinal scales identify the probability and impact on a numerical value from .01 (very low) to 1.0 (certain).
![]() Ordinal scales identify and rank the risks with common terms, such as very high to very unlikely, or using a RAG Rating (red, amber, green) to signify the risk score.
Ordinal scales identify and rank the risks with common terms, such as very high to very unlikely, or using a RAG Rating (red, amber, green) to signify the risk score.
Creating a Probability-Impact Matrix
Each identified risk is fed into a probability-impact matrix, as seen in Figure 11-3. The matrix maps out the risk, its probability, and its possible impact. The risks with higher probability and impact are a more serious threat to the project objectives than the risks with lower impact and consequences. The risks that are threats to the project require quantitative analysis to determine the root of the risks, the methods to control the risks, and effective risk management. We’ll discuss quantitative risk management later in this chapter.
FIGURE 11-3 A probability-impact matrix measures the identified risks within the project.

The project is best served when the probability scale and the impact scale are predefined prior to qualitative analysis. For example, the probability scale rates the likelihood of an individual risk happening and can be on a linear scale (.1, .3, .5, .7, .9) or on an ordinal scale. The scale, however, should be defined and agreed upon in the risk management plan. The impact scale, which measures the severity of the risk on the project’s objectives, can also be ordinal or cardinal.
The value of identifying and assigning the scales to use prior to the process of qualitative analysis allows all risks to be ranked by the system and allows for future identified risks to be measured and ranked by the same system. A shift in risk rating methodologies mid-project can cause disagreements in the method of handling the project risks.
A probability-impact matrix multiplies the value for the risk probability by the risk impact for a total risk score. The risk’s scores can be cardinal, as seen in Figure 11-4, and then preset values can qualify the risk for a risk response. For example, an identified risk in a project is the possibility that the vendor may be late in delivering the hardware. The probability is rated at .9, but the impact of the risk on the project is rated at .10. The risk score is calculated by multiplying the probability times the impact—in this case, resulting in a score of .09.
FIGURE 11-4 The results of a probability-impact matrix create a risk score.
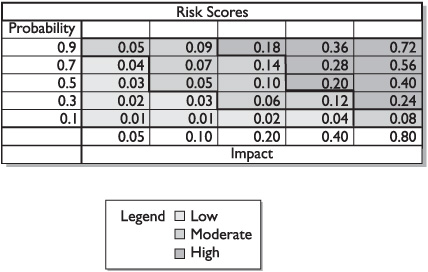
The scores within the probability-impact matrix can be referenced against the performing organization’s policies for risk reaction. Based on the risk score, the performing organization can place the risk in differing categories to guide risk reaction. There are three common categories based on risk score.
![]() Red condition High risk; these risk scores are high in impact and probability.
Red condition High risk; these risk scores are high in impact and probability.
![]() Amber condition (also called yellow condition) These risks are somewhat high in impact and probability.
Amber condition (also called yellow condition) These risks are somewhat high in impact and probability.
![]() Green condition Risks with a green label are generally fairly low in impact, probability, or both.
Green condition Risks with a green label are generally fairly low in impact, probability, or both.

Your organization may not have a classification of risks of red, amber, and green—called RAG Rating. Your project risks should map to the methodology your organization uses to identify and classify project risks. If there is no classification of risks, take the initiative and create one for your project. Be certain to document your classification for historical information and include this information in your lessons-learned documentation.
Relying on Data Precision
One of the toughest parts of qualitative risk analysis is the biased, subjective nature of the process. A project manager and the project team must question the reliability and reality of the data that lead to the ranking of the risks. For example, Susan may have great confidence in herself when it comes to working with new, unproven technologies. Based on this opinion, she petitions for the risk probability of the work to be a very low score.
However, because she has no experience with the technology due to its newness, the probability of the risk of failure is actually very high. The biased opinion that Susan can complete the work with zero defects and problems is slightly skewed because she has never worked with the technology before. Obviously, a low-ranked score on a risk that should be ranked high can have detrimental effects on the project’s success.
Data precision ranking takes into consideration the biased nature of the ranking, the accuracy of the data submitted, and the reliability of the biased ranking submitted to examine the risk scores. Data precision ranking is concerned with the following:
![]() The level of understanding of the project risk
The level of understanding of the project risk
![]() The available data and information about the identified risk
The available data and information about the identified risk
![]() The quality of the data and information of the identified risk
The quality of the data and information of the identified risk
![]() The reliability of the data about the identified risk
The reliability of the data about the identified risk
![]()
Imminent risks are usually considered of higher urgency than distant risks. Consider the risk ranking, the time needed for the risk response, and the conditions that indicate the risk is coming to fruition.
Examining the Results of Qualitative Risk Analysis
Qualitative risk analysis happens throughout the project. As new risks become evident and identified, the project manager should route the risks through the qualitative risk analysis process. The end results of qualitative risk analysis, as shown in the following, are all updated in the risk register:
![]() Overall risk ranking of the project The overall risk ranking of the project allows the project manager, management, customers, and other interested stakeholders to comprehend the risk, the nature of the risks, and the condition between the risk score and the likelihood of success for a project. The risk score can be compared to other projects to determine project selection, the placement of talent in a project, prioritization, the creation of a benefit/cost ratio, or even the cancellation of a project because it is deemed too risky.
Overall risk ranking of the project The overall risk ranking of the project allows the project manager, management, customers, and other interested stakeholders to comprehend the risk, the nature of the risks, and the condition between the risk score and the likelihood of success for a project. The risk score can be compared to other projects to determine project selection, the placement of talent in a project, prioritization, the creation of a benefit/cost ratio, or even the cancellation of a project because it is deemed too risky.
![]() Risk categories Within the risk register, categories of risks should be created. The idea is that not only will related risks be lumped together, but there may also be some trend identification and root-cause analysis of identified risks. As risks are categorized, it should make it easier to create risk responses as well.
Risk categories Within the risk register, categories of risks should be created. The idea is that not only will related risks be lumped together, but there may also be some trend identification and root-cause analysis of identified risks. As risks are categorized, it should make it easier to create risk responses as well.
![]() Near-term risks Qualitative analysis should also help the project team identify which risks require immediate or near-term risk responses. Risks that are likely to happen later in the project can be acknowledged, allowing imminent risks to be managed first. Urgent risks can go right to quantitative analysis and risk response planning.
Near-term risks Qualitative analysis should also help the project team identify which risks require immediate or near-term risk responses. Risks that are likely to happen later in the project can be acknowledged, allowing imminent risks to be managed first. Urgent risks can go right to quantitative analysis and risk response planning.
![]() The identification of risks requiring additional analysis The risks categorized as high will likely need additional analysis, such as quantitative analysis. Some risks may demand immediate risk management based on the nature of the risks and the status of the project.
The identification of risks requiring additional analysis The risks categorized as high will likely need additional analysis, such as quantitative analysis. Some risks may demand immediate risk management based on the nature of the risks and the status of the project.
![]() Low-priority risk watchlist Let’s face it: Not all risks need additional analysis. However, these low-priority risks should be identified and assigned to a watchlist for periodic monitoring.
Low-priority risk watchlist Let’s face it: Not all risks need additional analysis. However, these low-priority risks should be identified and assigned to a watchlist for periodic monitoring.
![]() Trends in qualitative analysis As the project progresses and risk analysis is repeated, trends in the ranking and analysis of the risk may become apparent. These trends can allow the project manager and other risk experts to respond to the root cause, predict trends to eliminate, or respond to the risks within the project.
Trends in qualitative analysis As the project progresses and risk analysis is repeated, trends in the ranking and analysis of the risk may become apparent. These trends can allow the project manager and other risk experts to respond to the root cause, predict trends to eliminate, or respond to the risks within the project.
Preparing for Quantitative Risk Analysis
Quantitative risk analysis attempts to numerically assess the probability and impact of the identified risks. It also creates an overall risk score for the project. This method is more in-depth than qualitative risk analysis and relies on several different tools to accomplish its goal.
Qualitative risk analysis typically precedes quantitative analysis. All or a portion of the identified risks in qualitative risk analysis can be examined in the quantitative analysis. The performing organization may have policies on the risk scores in qualitative analysis that require the risks to advance to the quantitative analysis. Time and budget constraints may also be factors in the determination of which risks should pass through quantitative analysis. Quantitative analysis is a more time-consuming process and is, therefore, also more expensive. There are several goals of quantitative risk analysis.
![]() To ascertain the likelihood of reaching project success
To ascertain the likelihood of reaching project success
![]() To ascertain the likelihood of reaching a particular project objective
To ascertain the likelihood of reaching a particular project objective
![]() To determine the risk exposure for the project
To determine the risk exposure for the project
![]() To determine the likely amount of the contingency reserve needed for the project
To determine the likely amount of the contingency reserve needed for the project
![]() To determine the risks with the largest impact on the project
To determine the risks with the largest impact on the project
![]() To determine realistic time, cost, and scope targets
To determine realistic time, cost, and scope targets
Considering the Inputs for Quantitative Analysis
Based on the time and budget allotments for quantitative analysis, as defined in the risk management plan, the project manager can move into quantitative analysis. There are, however, five inputs to quantitative risk analysis that the project manager should rely on.
![]() Risk register The risks that have been identified and promoted to quantitative analysis are needed. The project team will also need their ranking and risk categories—all of which are documented in the risk register.
Risk register The risks that have been identified and promoted to quantitative analysis are needed. The project team will also need their ranking and risk categories—all of which are documented in the risk register.
![]() Risk management plan The risk management plan identifies the risk management methodology, the allotted budget for risk analysis, the schedule, and the risk scoring mechanics—among other attributes.
Risk management plan The risk management plan identifies the risk management methodology, the allotted budget for risk analysis, the schedule, and the risk scoring mechanics—among other attributes.
![]() Cost management plan The cost management plan is needed for the budgeting of the risk management activities. Risk impacts and the predicted risk reserve can affect the cost estimates and budget for the entire project.
Cost management plan The cost management plan is needed for the budgeting of the risk management activities. Risk impacts and the predicted risk reserve can affect the cost estimates and budget for the entire project.
![]() Schedule management plan The schedule management plan is needed to evaluate the timing of risk events, risk planning, and risk distributions. Network analysis, schedule delays, and project interruptions should be evaluated for risk.
Schedule management plan The schedule management plan is needed to evaluate the timing of risk events, risk planning, and risk distributions. Network analysis, schedule delays, and project interruptions should be evaluated for risk.
![]() Organizational process assets Historical information is one of the best inputs for risk analysis, as it is proven information for the project. An examination of the project risks from past experiences can help the project team complete quantitative risk analysis activities.
Organizational process assets Historical information is one of the best inputs for risk analysis, as it is proven information for the project. An examination of the project risks from past experiences can help the project team complete quantitative risk analysis activities.
Interviewing Stakeholders and Experts
Interviews with stakeholders and subject-matter experts can be one of the first tools to quantify the identified risks. These interviews can focus on worst-case, best-case, and most-likely scenarios if the goal of the quantitative analysis is to create a triangular distribution; most quantitative analysis, however, uses continuous probability distributions. Figure 11-5 shows five sample distributions: normal, triangular, uniform, beta, and lognormal.
FIGURE 11-5 Risk distributions illustrate the likelihood and impact of an event within a project.

Continuous probability distribution is an examination of the probability of all possibilities within a given range. For each variable, the probability of a risk event and the corresponding consequence for the event, may vary. In other words, dependent on whether the risk event occurs and how it happens, a reaction to the event may also occur. The distribution of the probabilities and impact include:
![]() Uniform
Uniform
![]() Normal
Normal
![]() Triangular
Triangular
![]() Beta
Beta
![]() Lognormal
Lognormal
![]()
It’s doubtful that you’ll be tested on these risk distributions for the exam. The PMBOK mentions them only briefly, so you just need to be topically aware of them. Don’t invest hours memorizing the subject.
Applying Sensitivity Analysis
Sensitivity analysis examines each project risk on its own merit. It is an analysis process to determine which risks could affect the project the most. All other risks in the project are set at a baseline value. The individual risk then is examined to see how it may affect the success of the project. The goal of sensitivity analysis is to determine which individual risks have the greatest impact on the project’s success and then escalate the risk management processes on these risk events.
Finding the Expected Monetary Value
The expected monetary value of a project or event is based on the probability of outcomes that are uncertain. For example, one risk may cost the project an additional $10,000 if it occurs, but there’s only a 20 percent chance of the event occurring. In the simplest form, the expected monetary value of this individual risk is thus $2,000. Project managers can also find the expected monetary value of a decision by creating a decision tree.
Using a Decision Tree
A decision tree is a method to determine which of two or more decisions is the best to make. For example, it can be used to determine buy-versus-build scenarios, lease-or-purchase equations, or whether to use in-house resources rather than outsourcing project work. The decision tree model examines the cost and benefits of each decision’s outcomes and weighs the probability of success for each of the decisions.
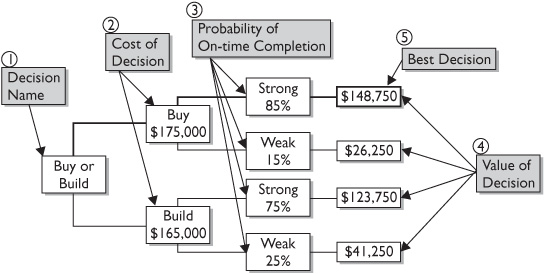
The purpose of the decision tree is to make a decision, calculate the value of that decision, or determine which decision costs the least. Follow Figure 11-6 through the various steps of the decision tree process.
FIGURE 11-6 Decision trees analyze the probability of events and calculate decision values.
Completing a Decision Tree
As the project manager of the new GFB Project, you have to decide whether to create a new web application in-house or send the project out to a developer. The developer you would use (if you were to outsource the work) quotes the project cost at $175,000. Based on previous work with this company, you are 85 percent certain they will finish the work on time.
Your in-house development team quotes the cost of the work as $165,000. Again, based on previous experience with your in-house developers, you feel 75 percent certain they can complete the work on time. Now let’s apply what we know to a decision tree.
![]() Buy or build is simply the decision name.
Buy or build is simply the decision name.
![]() The cost of the decision if you “buy” the work outside of your company is $175,000. If you build the software in-house, the cost of the decision is $165,000.
The cost of the decision if you “buy” the work outside of your company is $175,000. If you build the software in-house, the cost of the decision is $165,000.
![]() Based on your probability of completion by a given date, you apply the 85 percent certainty to the “strong” finish for the buy branch of the tree. Because you’re 85 percent certain, you’re also 15 percent uncertain; this value is assigned to the “weak” value on the buy branch. You complete the same process for the build branch of the tree.
Based on your probability of completion by a given date, you apply the 85 percent certainty to the “strong” finish for the buy branch of the tree. Because you’re 85 percent certain, you’re also 15 percent uncertain; this value is assigned to the “weak” value on the buy branch. You complete the same process for the build branch of the tree.
![]() The value of the decision is the percentage of strong and weak applied to each branch of the tree.
The value of the decision is the percentage of strong and weak applied to each branch of the tree.
![]() The best decision is based solely on the largest value of all possible decisions identified in the decision tree.
The best decision is based solely on the largest value of all possible decisions identified in the decision tree.
Using a Project Simulation
Project simulations allow the project team to play “what-if” games without affecting any areas of production. The Monte Carlo technique is the most common simulation. This technique got its name from Monte Carlo, Monaco (world-renowned for its slot machines, roulette wheels, and other games of pure chance). Monte Carlo, typically completed through a computer software program, completely simulates a project with values for all possible variables to predict the most likely model.
Examining the Results of Quantitative Risk Analysis
Quantitative risk analysis is completed throughout the project as risks are identified and passed through qualitative analysis, as project conditions change, or on a preset schedule. The end result of quantitative risk analysis should be reflected in the risk register and should include the following:
![]() Probabilistic analysis The risks within the project allow the project manager or other experts to predict the likelihood of the project’s success. The project may be altered by the response to certain risks; this response can increase cost and push back the project’s completion date.
Probabilistic analysis The risks within the project allow the project manager or other experts to predict the likelihood of the project’s success. The project may be altered by the response to certain risks; this response can increase cost and push back the project’s completion date.
![]() Probability of costs and schedule objectives Based on the identified risks, their impact, and the probability of occurrence, forecasts for the project schedule and the project costs are created. The more negative the risks that occur within a project, the greater the chance of delays and increased costs.
Probability of costs and schedule objectives Based on the identified risks, their impact, and the probability of occurrence, forecasts for the project schedule and the project costs are created. The more negative the risks that occur within a project, the greater the chance of delays and increased costs.
![]() A prioritized list of risks This list of quantified risks demonstrates those risks with the highest potential for endangering the project’s success. This list includes the risks that have the greatest opportunity for the project. Each risk is identified with its probability and impact.
A prioritized list of risks This list of quantified risks demonstrates those risks with the highest potential for endangering the project’s success. This list includes the risks that have the greatest opportunity for the project. Each risk is identified with its probability and impact.
![]() Trends As the project moves towards completion, quantitative risk analysis may be repeated. In each round of analysis, trends in the identified risks may become visible. The trends in the risk can help the project team eliminate the root cause of the risk, reduce their probability, or control their impact.
Trends As the project moves towards completion, quantitative risk analysis may be repeated. In each round of analysis, trends in the identified risks may become visible. The trends in the risk can help the project team eliminate the root cause of the risk, reduce their probability, or control their impact.
Planning for Risk Responses
Risk response planning is all about options and actions. It focuses on how to decrease the possibility of risks adversely affecting the project’s objectives and on how to increase the likelihood of positive risks that can aid the project. Risk response planning assigns responsibilities to people and groups close to the risk event. Risks will increase or decrease based on the effectiveness of risk response planning.
The responses to identified risks must be in balance with the risk itself. The cost and time invested in a risk must be met with the gains from reducing the risk’s impact and probability. In other words, a million-dollar solution for a hundred-dollar problem is unacceptable. The people or individuals who are assigned to the risk must have the authority to react to the project risk as planned. In most cases, several risk responses may be viable for the risk—the best choice for the identified risk must be documented, agreed upon, and then followed through should the risk come to fruition.
Preparing for Risk Response
To successfully prepare for risk response, the project manager, project team, and appropriate stakeholders rely on several inputs—many of which stem from qualitative and quantitative risk analyses. The risk management plan is needed during the risk response planning, but the risk register is also needed to provide the following:
![]() A list of prioritized risks
A list of prioritized risks
![]() A risk ranking
A risk ranking
![]() A prioritized list of quantified risks
A prioritized list of quantified risks
![]() A probabilistic analysis of the project
A probabilistic analysis of the project
![]() The probability of the project meeting the cost and schedule goals
The probability of the project meeting the cost and schedule goals
![]() The list of potential responses decided upon when risks were first identified
The list of potential responses decided upon when risks were first identified
![]() Any risk owners that have been identified
Any risk owners that have been identified
![]() A list of risks with common causal factors
A list of risks with common causal factors
![]() Trends from qualitative and quantitative analyses
Trends from qualitative and quantitative analyses
Creating Risk Responses
The project team can employ several tools and techniques to respond to risks. Each risk should be evaluated to determine which category of risk response is most appropriate. When a category of risk response has been selected, the response must then be developed, refined, documented, and readied for use, if needed. In addition, secondary responses may be selected for each risk. The purpose of risk response planning is to bring the overall risk of the project down to an acceptable level. In addition, risk response planning must address any risks that have unacceptably high scores.
Avoiding the Negative Risk and Threats
Avoidance is simply avoiding the risk. This can be accomplished in many different ways and generally happens early in the project, when any change will result in fewer consequences than it would later in the project plan. Examples of avoidance include the following:
![]() Changing the project plan to eliminate the risk
Changing the project plan to eliminate the risk
![]() Clarifying project requirements to avoid discrepancies
Clarifying project requirements to avoid discrepancies
![]() Hiring additional project team members who have experience with the technology that the project deals with
Hiring additional project team members who have experience with the technology that the project deals with
![]() Using a proven methodology rather than a new approach
Using a proven methodology rather than a new approach
Transferring the Negative Risk
Transference is the process of transferring the risk (and the ownership of the risk) to a third party. The risk doesn’t disappear; it’s just someone else’s problem. Transference of a risk usually costs a premium for the third party to own and manage that risk. Common examples of risk transference include:
![]() Insurance
Insurance
![]() Performance bonds
Performance bonds
![]() Warrantees
Warrantees
![]() Guarantees
Guarantees
![]() Fixed-price contracts
Fixed-price contracts
INSIDE THE EXAM
Risk management planning is the process of determining how risk management should be handled. The stakeholder analysis will reveal their willingness to accept risk—which is also known as their utility function. The performing organization may have standard practices for risk management, risk management templates, or guidance from historical information.
There are two types of risk: business risk, which is a gain or loss from a financial point of view, and pure risks, which only has a downside. Both types of risk must be assessed and managed. Remember, not all risks are bad. The risk impact may have a negative effect on the project, but often a risk may have a positive impact.
Risk identification happens early on in the project to allow time for risk response planning. It also happens throughout the project. The project manager, the project team, customers, and other stakeholders should be involved in the process. There are several methods to risk identification—interviews and the Delphi Technique are two of the most common approaches.
Qualitative analysis qualifies the list of risks in a matrix based on impact and probability. This subjective approach uses common very low, low, moderate, high, and very high rankings. The risks can be prioritized based on their score.
After qualitative analysis, some risks may be sent through quantitative analysis.
INSIDE THE EXAM
This approach attempts to quantify the risks with hard numbers, values, and data. Quantification of the risk can lead to time and cost contingencies for the project, a prioritization of the risks, and an overall risk score. Monte Carlo simulations are typically associated with quantitative risk analysis.
The three risk responses for negative risks are:
Avoidance The project plan is altered to avoid the identified risk.
Mitigation An effort is made to reduce the probability, impact, or both of an identified risk in the project before the risk event occurs.
Transference The risk is assigned to a third party, usually for a fee. The risk still exists, but the responsibility is deflected to the third party.
The three risk responses for positive risks include:
Exploit The organization wants to ensure that the identified risk does happen in order to realize the positive impact associated with the risk event.
Share Sharing is nice. When sharing, the risk ownership is transferred to the organization that can capitalize most on the risk opportunity.
Enhance To enhance a risk is to attempt to modify its probability of occurrence and/or its impacts on the project in order to realize the most gains from the identified risk.
The two responses for both positive and negative risks are:
Acceptance The risks are seen as nominal, so they are accepted. Risks, regardless of size, that have no other recourse may also be accepted.
Contingency response When it’s evident that some risks are occurring, or about to occur, a preplanned risk response can be put into play. This is part of the contingency response strategy.
As the project progresses, risk monitoring and control are implemented. Risks are monitored for signs that they may be coming to fruition. The project team and the project manager execute the risk response plan and document the results. Earned value analysis, which is typically used to measure project performance, can also be used to signal impending project risks.
Mitigating the Negative Risk
Mitigating risks is an effort to reduce the probability and/or impact of an identified risk in the project. Mitigation is done—based on the logic—before the risk happens. The cost and time to reduce or eliminate the risk is more cost effective than repairing the damage caused by the risk. The risk event may still happen, but hopefully the cost and impact will be low.
Mitigation plans can be created so that they are implemented should an identified risk cross a given threshold. For example, a manufacturing project may have a mitigation plan to reduce the number of units created per hour should the equipment’s temperature cross a given threshold. The reduction is the number of units per hour that it may cost the project in time. In addition, the cost of extra labor to run the equipment longer because the machine is now operating at a slower pace may be attributed to the project. However, should the equipment fail, the project would have to replace the equipment and be delayed for weeks while awaiting repairs.
Examples of mitigation include:
![]() Adding activities to the project to reduce the risk probability or impact
Adding activities to the project to reduce the risk probability or impact
![]() Simplifying the processes within the project
Simplifying the processes within the project
![]() Completing more tests on the project work before implementation
Completing more tests on the project work before implementation
![]() Developing prototypes, simulations, and limited releases
Developing prototypes, simulations, and limited releases
Managing the Positive Risk and Opportunities
While most risks have a negative connotation, not all risks are bad. There are instances when a risk may create an opportunity that can help the project, other projects, or the organization as a whole. The type of risk and the organization’s willingness to accept the risks will dictate the appropriate response.
Exploiting the Positive Risk or Opportunities
When an organization would like to ensure that a positive risk definitely happens, it can exploit the risk. Positive risk exploitation can be realized by adding resources to finish faster than what was originally planned, increasing quality to recognize sales and customer satisfaction, utilizing a better way of completing the project work, or any other method that creates the positive outcomes of the identified risk.
Sharing the Positive Risk
The idea of sharing a positive risk really means sharing a mutually beneficial opportunity between two organizations or projects, or creating a risk-sharing partnership. When a project team can share the positive risk, ownership of the risk is given to the organization that can best capture the benefits from the identified risk.
Enhancing the Positive Risks
This risk response seeks to modify the size of the identified opportunity. The goal is to strengthen the cause of the opportunity to ensure that the risk event does happen. Enhancing a project risk looks for solutions, triggers, or other drives to ensure that the risk does come to fruition so that the rewards of the risk can be realized by the performing organization.
Accepting the Risks
Risk acceptance is the process of simply accepting the risks because no other action is feasible, or the risks are deemed to be of small probability, impact, or both and that a formal response is not warranted. Passive acceptance requires no action; the project team deals with the risks as they happen. Active acceptance entails developing a contingency plan should the risk occur. Acceptance may be used for both positive and negative risks.
A contingency plan is a predefined set of actions the project team will take should certain events occur. Events that trigger the contingency plan should be tracked. A fallback plan is a reaction to a risk that has occurred when the primary response proves to be inadequate.
Most risk acceptance policies rely on a contingency allowance for the project. A contingency allowance is the amount of money the project will likely need in the contingency reserve based on the impact, probability, and expected monetary value of a risk event.
For example, Risk A has a 25 percent chance of happening and has a cost value of −$2,000. The probability times the impact equates to a −$2,000 expected monetary value (Ex$V). Another risk, Risk B, has a 40 percent chance of happening and has a benefit value of $4,000. The Ex$V for Risk B is $1,600. If these were the only risks in the project, an ideal contingency reserve would be $400. This is calculated by adding the positive and negative risk values to predict the amount that the project is likely to be underfunded by if the risks happen. Table 11-1 shows several risks and their Ex$V.
TABLE 11-1 Contingency Reserve Calculations

Examining the Results of Risk Response Planning
The major output of risk response planning is the risk register updates. These risk responses are documented in the risk register and guide the reaction to each identified risk. They include the following:
![]() A description of the risk, what area of the project it may affect, the causes of the risk, and its impact on project objectives
A description of the risk, what area of the project it may affect, the causes of the risk, and its impact on project objectives
![]() The identities of the risk owners and their assigned responsibilities
The identities of the risk owners and their assigned responsibilities
![]() The outputs of qualitative and quantitative analysis
The outputs of qualitative and quantitative analysis
![]() Risk strategies and the specific actions necessary to implement those strategies
Risk strategies and the specific actions necessary to implement those strategies
![]() Symptoms and warning signs, sometimes called triggers, of each risk event
Symptoms and warning signs, sometimes called triggers, of each risk event
![]() A description of the response to each risk, such as avoidance, transference, mitigation, or acceptance
A description of the response to each risk, such as avoidance, transference, mitigation, or acceptance
![]() The actions necessary to implement the responses
The actions necessary to implement the responses
![]() The budget and schedule for risk responses
The budget and schedule for risk responses
![]() The contingency and fallback plans
The contingency and fallback plans
Working with Residual Risks
The risk response plan also acknowledges any residual risks that may remain after planning, avoidance, transfer, or mitigation. Residual risks are typically minor and have been acknowledged and accepted. Management may elect to add both contingency costs and time to account for the residual risks within the project.
Accounting for Secondary Risks
Secondary risks stem from risk responses. For example, transference may elect to hire a third party to manage an identified risk. A secondary risk caused by the solution is the failure of the third party to complete their assignment as scheduled. Secondary risks must be identified, analyzed, and planned for, just as any another identified risk.
Creating Contracts for Risk Response
When multiple entities are involved in a project, contractual agreements may be necessary to identify the responsible parties for identified risks. The contract may be needed for insurance purposes, customer acceptance, or the acknowledgement of responsibilities between the entities completing the project. Transference is an example of contractual agreements for the responsibility of risks within a project.
A contingency reserve may also be called a management reserve. Often, a management reserve deals with time, while a contingency reserve deals with dollars. Some organizations lump time and money into the same reserve. You should know what nomenclature your organization uses and what they anticipate the meaning of the reserves to be.
Justifying Risk Reduction
To reduce risk, additional time or monies are typically needed. The process and logic behind the strategies to reduce the risk should be evaluated to determine if the solution is worth the tradeoffs. For example, a risk may be eliminated by adding $7,500 to a project’s budget. However, the likelihood of the risk occurring is relatively low. Should the risk happen, it would cost, at a minimum, $8,000 to correct and the project would be delayed by at least two weeks.
The cost of preventing the risk versus the cost of responding to it must be weighed and justified. If the risk is not eliminated with the $7,500 cost and the project moves forward as planned, it has, theoretically, saved $15,500 because the risk did not happen and the response to the risk did not need to happen.
However, if the risk does happen, the project will lose at least $8,000 and be delayed at least two weeks. The cost inherent in the project delay may be more expensive than the solution to the risk. The judgment of solving the risk to reduce the likelihood of delaying the project may be wiser than ignoring the risk and saving the cost by solving the risk problem.
Updating the Project Plan
The risk reactions, contingency plans, and fallback plans should all be documented and incorporated into the project plan—for example, updating the schedule, budget, and WBS to accommodate additional time, money, and activities for risk responses. The responses to the risks may change the original implementation of the project and should be updated to reflect the project plan and intent of the project team, management, and other stakeholders. A failure to update the project plan and the risk register may cause risk reactions to be missed and skew performance measurements.
Implementing Risk Monitoring and Control
Risks must be actively monitored and new risks must be responded to as they are discovered. Risk monitoring and control is the process of monitoring identified risks for signs that they may be occurring, controlling identified risks with the agreed-upon responses, and looking for new risks that may creep into the project. Risk monitoring and control also is concerned with the documentation of the success or failure of risk response plans and keeping records of metrics that signal risks are occurring, fading, or disappearing from the project.
Risk monitoring and control is an active process that requires participation from the project manager, the project team, key stakeholders, and, in particular, risk owners within the project. As the project progresses, risk conditions may change and require new responses, additional planning, or the implementation of a contingency plan.
There are several goals to risk monitoring and control.
![]() To confirm risk responses are implemented as planned
To confirm risk responses are implemented as planned
![]() To determine if risk responses are effective or if new responses are needed
To determine if risk responses are effective or if new responses are needed
![]() To determine the validity of the project assumptions
To determine the validity of the project assumptions
![]() To determine if risk exposure has changed, evolved, or declined due to trends in the project progression
To determine if risk exposure has changed, evolved, or declined due to trends in the project progression
![]() To monitor risk triggers
To monitor risk triggers
![]() To confirm that policies and procedures happen as planned
To confirm that policies and procedures happen as planned
![]() To monitor the project for new risks
To monitor the project for new risks
Preparing for Risk Monitoring and Control
Risk monitoring and control is an active process. The project team and the project manager must rely on several inputs to effectively monitor and control risks, such as:
![]() The risk register The risk register is the central repository for all project risk information. It includes the identified risks, the potential responses, the root causes of risks, and any identified categories of risk.
The risk register The risk register is the central repository for all project risk information. It includes the identified risks, the potential responses, the root causes of risks, and any identified categories of risk.
![]() The risk management plan The risk management plan defines the organization’s approach to risk management. It is not the strategy for specific risks within a project, but the overall strategy for risk analysis and planning.
The risk management plan The risk management plan defines the organization’s approach to risk management. It is not the strategy for specific risks within a project, but the overall strategy for risk analysis and planning.
![]() Work performance information The results of project work can inform the project manager and the project team of new and pending risks. In addition, project team members may create reports to monitor or document risks. These reports are known as issue logs, action-items, jeopardy warnings, and escalation notices. Project performance focuses on the balance of the project schedule, costs, and scope. Should the performance of time, cost, or scope suffer, new risks are likely to enter the project.
Work performance information The results of project work can inform the project manager and the project team of new and pending risks. In addition, project team members may create reports to monitor or document risks. These reports are known as issue logs, action-items, jeopardy warnings, and escalation notices. Project performance focuses on the balance of the project schedule, costs, and scope. Should the performance of time, cost, or scope suffer, new risks are likely to enter the project.
Completing Risk Monitoring and Control
Risk monitoring and risk control happens throughout the project—it is not a solitary activity that is completed once and never revisited. The project manager and the project team must actively monitor risks, respond with the agreed-upon actions, and scan the horizon for risks that have not been addressed. Risk monitoring and control is a recurring activity that requires input from all project participants. Several tools are available for implementing risk monitoring and control, and they are discussed in the following sections.
Completing Risk Response Audits
A risk response audit examines the planned risk response, how well the planned actions work, and the effectiveness of the risk owner in implementing the risk response. The audits happen throughout the project to measure the effectiveness of mitigating, transferring, and avoiding risks. The risk response audit should measure the effectiveness of the decision and its impact on time and cost.
Completing Periodic Risk Reviews
Project risk should be on the agenda at every project team meeting. The periodic risk review is a regularly scheduled discussion throughout the project to ascertain the level of foreseeable risks, the success of risk responses in the project to date, and a review of pending risks. Based on circumstances within the project, risk rankings and prioritization may fluctuate. Changes to the project scope, team, or conditions may require qualitative and quantitative analyses.
Using Earned Value Analysis
Earned value analysis measures project performance. When project performance is waning, the project is likely missing targeted costs and schedule goals. The results of earned value analysis can signal that risks are happening within the project or that new risks may be developing.
For example, a schedule performance index (SPI) of .93 means the project is off schedule by 7 percent. A risk based on this value could mean that the project team is having difficulty completing the project work as planned. Additional work will continue to be late, the project will finish late, and quality may suffer as the team attempts to rush to complete assigned tasks.
Measuring Technical Performance
Throughout the project, the project team’s technical competence with the technology being used in the project should increase. The level of technical achievement should be in proportion to the expected level of technical performance within the project. If the project team is not performing at a level of expected technical expertise, the project may suffer additional risks due to the discrepancy. Technical performance can be measured by the successful completion of activities throughout the project or project phases.
Completing Additional Risk Planning
Most likely, new risks will become evident during the project implementation. The project team, project manager, and key stakeholders who discover the risks should communicate them. The risks must then be acknowledged, documented, analyzed, and planned for. The project team must be encouraged to communicate the discovery of new risks.
Often, project team members don’t want to share discovered risks with the project manager because the presence of a risk can be seen as bad news. The project manager must stress to the project team members that identified risks should be communicated so that the risks can be planned for through avoidance, mitigation, transference, or even acceptance.
Examining the Results of Risk Monitoring and Control
Risk monitoring and control helps the project become more successful. It measures the planned responses to risks and creates reactions to unplanned risks. The outputs of risk monitoring and control also aim to help the project reach its objectives.
There are several outputs of the process.
![]() Risk register updates As the project moves along and the project manager and the project team complete the risk assessments, audits, and risk reviews, they’ll need to record their findings in the risk register. This update may include the reevaluation of the risk’s impact, probability, and expected monetary value. For those risks that have passed in the project, the risk register should record what actually happened with the risk event and its impact on the project.
Risk register updates As the project moves along and the project manager and the project team complete the risk assessments, audits, and risk reviews, they’ll need to record their findings in the risk register. This update may include the reevaluation of the risk’s impact, probability, and expected monetary value. For those risks that have passed in the project, the risk register should record what actually happened with the risk event and its impact on the project.
![]() Organizational process assets updates The risks from the current project can help other project managers in the future. Therefore, the project manager must work to ensure that the current risks, their anticipated impact, and their actual impact are recorded. The current risk matrix, for example, can become a risk template for other projects in the future. This is true for just about any risk document—from risk responses to the risk breakdown structure, lessons learned, and checklists.
Organizational process assets updates The risks from the current project can help other project managers in the future. Therefore, the project manager must work to ensure that the current risks, their anticipated impact, and their actual impact are recorded. The current risk matrix, for example, can become a risk template for other projects in the future. This is true for just about any risk document—from risk responses to the risk breakdown structure, lessons learned, and checklists.
![]() Change requests As workarounds and contingency plans are used, they require changes to the project plan. The changes to the project plan due to the risks are completed through integrated change control. The changes are documented, approved, and incorporated into the project plan. As risks come to fruition, corrective actions are needed to bypass the risk. The two types of corrective actions are workarounds and contingency plans. Corrective actions are actions taken to bring the project back into compliance with the project plan. Preventive actions are steps taken to bring the project back into alignment with the project management plan.
Change requests As workarounds and contingency plans are used, they require changes to the project plan. The changes to the project plan due to the risks are completed through integrated change control. The changes are documented, approved, and incorporated into the project plan. As risks come to fruition, corrective actions are needed to bypass the risk. The two types of corrective actions are workarounds and contingency plans. Corrective actions are actions taken to bring the project back into compliance with the project plan. Preventive actions are steps taken to bring the project back into alignment with the project management plan.
![]() Project management plan updates Some change requests and risk responses may require updating the project management plan. As risks occur, the responses to those risks should be documented and updated in the risk response plan. Should risk rankings change during the project, the change in ranking, the logic behind the change, and the results of the risk rank change should be documented in the risk response plan. For the risks that do not occur, the risks should be documented and considered closed in the risk response plan.
Project management plan updates Some change requests and risk responses may require updating the project management plan. As risks occur, the responses to those risks should be documented and updated in the risk response plan. Should risk rankings change during the project, the change in ranking, the logic behind the change, and the results of the risk rank change should be documented in the risk response plan. For the risks that do not occur, the risks should be documented and considered closed in the risk response plan.
CERTIFICATION SUMMARY
PMP candidates must have a firm grasp on how to plan for, monitor, and control projects’ risks. To effectively handle risks, the project manager needs to begin with risk management planning. A large, complex project will likely have more risks than a smaller project. In any situation, however, risks must be identified and planned for. The performing organization will often have risk management policies that dictate how the risk planning sessions are to be performed and what level of risks call for additional planning.
Some stakeholders—and organizations—will be more tolerant than others of accepting risks.
As risks are identified, the project manager can use the Delphi Technique to build a consensus on which risks have the highest impact on the project. This anonymous approach allows participants to speak freely about the risks, unhindered by the opinions of other stakeholders. The comments on the identified risks are distributed to all of the participants, allowing participants to comment, concur, or dismiss opinions on the identified risks. Through rounds of discussion, a consensus on the risks is reached.
Qualitative risk analysis qualifies identified risks and creates a prioritization of each. Every risk is considered for its impact and likelihood of occurring. Once the risks have passed through qualitative risk analysis, quantitative risk analysis is needed. Quantitative risk analysis assesses the probability and impact of the risks, and it determines a risk score based on further analysis, discussion, expert judgment, simulations, and interviews with stakeholders.
KEY TERMS
If you’re serious about passing the PMP exam, memorize the following terms and their definitions. For maximum value, create your own flashcards based on these definitions and review them daily. You can find additional information on these terms in the project glossary.
acceptance This is a response to a risk event, generally made when the probability of the event and/or its impact is small. It is used when mitigation, transference, and avoidance are not selected.
avoidance This is one response to a risk event. The risk is avoided by planning a different technique to remove the risk from the project.
brainstorming The most common approach to risk identification; it is performed by a project team to identify the risks within the project. A multidisciplinary team, hosted by a project facilitator, can also perform brainstorming.
cause-and-effect diagrams Used for root-cause analysis of what factors are creating the risks within the project. The goal is to identify and treat the root of the problem, not the symptom.
contingency reserve A time or dollar amount allotted as a response to risk events that may occur within a project.
decision tree analysis A type of analysis that determines which of two decisions is the best. The decision tree assists in calculating the value of the decision and determining which decision costs the least.
Delphi Technique A method to query experts anonymously on foreseeable risks within the project, phase, or component of the project. The results of the survey are analyzed and organized, and then circulated to the experts. There can be several rounds of anonymous discussions with the Delphi Technique The goal is to gain consensus on project risks, and the anonymous nature of the process ensures that no one expert’s advice overtly influences the opinion of another participant.
enhance To enhance a risk is to attempt to modify its probability and/or its impacts to realize the most gains from it.
exploit The organization wants to ensure that the identified risk does happen to realize the positive impact associated with the risk event.
influence diagram An influence diagram charts out a decision problem. It identifies all of the elements, variables, decisions, and objectives—and how each factor may influence another.
mitigation Reducing the probability or impact of a risk.
qualitative risk analysis An examination and prioritization of the risks based on their probability of occurring and the impact on the project if they do occur. Qualitative risk analysis guides the risk reaction process.
quantitative risk analysis A numerical assessment of the probability and impact of the identified risks. Quantitative risk analysis also creates an overall risk score for the project.
residual risks Risks that are left over after mitigation, transference, and avoidance. These are generally accepted risks. Management may elect to add contingency costs and time to account for the residual risks within the project.
risk An unplanned event that can have a positive or negative influence on the project’s success.
risk categories These help organize, rank, and isolate risks within the project.
risk management plan A subsidiary project plan for determining how risks will be identified, how quantitative and qualitative analyses will be completed, how risk response planning will happen, how risks will be monitored, and how ongoing risk management activities will occur throughout the project life cycle.
risk owners The individuals or groups responsible for a risk response.
risk register Documentation of all risk events and their conditions, impact, probability, and overall risk score.
scales of probability and impact Used in a risk matrix in both qualitative and quantitative risk analyses to score each risk’s probability and impact.
secondary risks Risks that stem from risk responses. For example, the response of transference may call for hiring a third party to manage an identified risk. A secondary risk caused by the solution is the failure of the third party to complete its assignment as scheduled. Secondary risks must be identified, analyzed, and planned for, just like any other identified risk.
sensitivity analysis This examines each project’s risk on its own merit to assess the impact on the project. All other risks in the project are set at a baseline value.
share Sharing is nice. When sharing, the risk ownership is transferred to the organization that can most capitalize on the risk opportunity.
simulation This allows the project team to play “what-if” games without affecting any areas of production.
system or process flow charts These show the relationship between components and how the overall process works. They are useful for identifying risks between system components.
transference A response to risks in which the responsibility and ownership of the risk are transferred to another party (for example, through insurance).
triggers Warning signs or symptoms that a risk has occurred or is about to occur (for example, a vendor failing to complete their portion of the project as scheduled).
utility function A person’s willingness to accept risk.
workarounds Workarounds are unplanned responses to risks that were not identified or expected.
 TWO-MINUTE DRILL
Planning for Risk Management
![]() Risk management planning is determining how the risk management activities within the project will take place. It is not the response or identification of risks, but the determination of how to manage project risks.
Risk management planning is determining how the risk management activities within the project will take place. It is not the response or identification of risks, but the determination of how to manage project risks.
![]() Risk management planning is accomplished through planning meetings with the project team, management, customers, and other key stakeholders.
Risk management planning is accomplished through planning meetings with the project team, management, customers, and other key stakeholders.
![]() A utility function is a person’s willingness to accept risks.
A utility function is a person’s willingness to accept risks.
![]() The output of risk management planning is the risk management plan.
The output of risk management planning is the risk management plan.
Creating the Risk Management Plan
![]() Risks are uncertain events that can affect a project’s objectives for good or bad.
Risks are uncertain events that can affect a project’s objectives for good or bad.
![]() Risks can be placed into four different categories: technical, quality, or performance risks; project management risks; organizational risks; and external risks.
Risks can be placed into four different categories: technical, quality, or performance risks; project management risks; organizational risks; and external risks.
![]() The risk management plan defines the process to identify, analyze, respond to, and monitor all project risk events.
The risk management plan defines the process to identify, analyze, respond to, and monitor all project risk events.
Identifying Risks
![]() Project records from published information and previous projects can serve as input to risk identification.
Project records from published information and previous projects can serve as input to risk identification.
![]() The Delphi Technique allows participants to identify risk anonymously without fear of embarrassment. A survey allows results to be shared with all participants for comments on each other’s anonymous input. Rounds of surveying and analysis can create consensus on the major project risks.
The Delphi Technique allows participants to identify risk anonymously without fear of embarrassment. A survey allows results to be shared with all participants for comments on each other’s anonymous input. Rounds of surveying and analysis can create consensus on the major project risks.
![]() Triggers are warning signs that a risk is about to happen or has happened.
Triggers are warning signs that a risk is about to happen or has happened.
Using Qualitative Risk Analysis
![]() Qualitative risk analysis is a high-level, fast analysis of the identified project risks.
Qualitative risk analysis is a high-level, fast analysis of the identified project risks.
![]() Risks are evaluated for their impact and likelihood.
Risks are evaluated for their impact and likelihood.
![]() Risks can be ranked in an ordinal fashion by using such indicators as very low, low, moderate, high, and very high.
Risks can be ranked in an ordinal fashion by using such indicators as very low, low, moderate, high, and very high.
![]() Risks can also be analyzed using a cardinal ranking system of numerical values that are assigned to each risk based on its impact and probability.
Risks can also be analyzed using a cardinal ranking system of numerical values that are assigned to each risk based on its impact and probability.
![]() An overall project risk ranking can be used to compare the current projects with other projects in the organization.
An overall project risk ranking can be used to compare the current projects with other projects in the organization.
![]() Risks that have a high score from qualitative analysis can be moved into quantitative analysis for further study.
Risks that have a high score from qualitative analysis can be moved into quantitative analysis for further study.
Preparing for Quantitative Risk Analysis
![]() Risks are assigned an expected monetary value, such as there is a 50 percent likelihood that the risk will occur, causing a $10,000 cost.
Risks are assigned an expected monetary value, such as there is a 50 percent likelihood that the risk will occur, causing a $10,000 cost.
![]() Quantitative analysis is an in-depth study of the risk’s probability and impact.
Quantitative analysis is an in-depth study of the risk’s probability and impact.
![]() Risks and their impact, status, responses, and updates are all recorded in the risk register.
Risks and their impact, status, responses, and updates are all recorded in the risk register.
Planning for Risk Responses
![]() Risk response planning focuses on reducing threats and increasing opportunities as a result of risks. Risk thresholds, defined in risk management planning, describe the acceptable level of risk within a company.
Risk response planning focuses on reducing threats and increasing opportunities as a result of risks. Risk thresholds, defined in risk management planning, describe the acceptable level of risk within a company.
![]() Risk owners are the individuals or groups that are responsible for a risk response and that should participate in the risk response planning.
Risk owners are the individuals or groups that are responsible for a risk response and that should participate in the risk response planning.
![]() Risk avoidance changes the project plan to avoid the risk (as well as conditions that promote the risk), or it attempts to reduce the risk’s impact on the project’s success.
Risk avoidance changes the project plan to avoid the risk (as well as conditions that promote the risk), or it attempts to reduce the risk’s impact on the project’s success.
![]() Risk transference moves the risk consequence to a third party. The risk doesn’t go away, just the responsibility of it. However, ultimately, the performing organization still retains the ultimate accountability and results of the risk event.
Risk transference moves the risk consequence to a third party. The risk doesn’t go away, just the responsibility of it. However, ultimately, the performing organization still retains the ultimate accountability and results of the risk event.
![]() Risk mitigation involves actions designed to reduce the likelihood of a risk occurring, the impact of a risk on the project objectives, or both.
Risk mitigation involves actions designed to reduce the likelihood of a risk occurring, the impact of a risk on the project objectives, or both.
![]() Risk acceptance acknowledges that the risk exists but that it isn’t worthy of a more in-depth response, or a more in-depth response isn’t available for the risk.
Risk acceptance acknowledges that the risk exists but that it isn’t worthy of a more in-depth response, or a more in-depth response isn’t available for the risk.
![]() Residual risks are risks that remain after avoidance, transference, mitigation, and acceptance. Secondary risks are new risks that arise from a risk response.
Residual risks are risks that remain after avoidance, transference, mitigation, and acceptance. Secondary risks are new risks that arise from a risk response.
![]() To exploit a risk requires that an organization implement measures to ensure that the positive risk definitely happens.
To exploit a risk requires that an organization implement measures to ensure that the positive risk definitely happens.
![]() Sharing a risk assigns ownership of the positive risk to an organization that is most likely to utilize the positive risks for the benefit of the project.
Sharing a risk assigns ownership of the positive risk to an organization that is most likely to utilize the positive risks for the benefit of the project.
![]() To enhance a risk requires that the organization take steps to increase the probability and/or impact of the positive risk.
To enhance a risk requires that the organization take steps to increase the probability and/or impact of the positive risk.
Implementing Risk Monitoring and Control
![]() Identified risks must be tracked, monitored for warning signs, and documented. The responses to the risks are monitored and documented as successful or less successful than expected.
Identified risks must be tracked, monitored for warning signs, and documented. The responses to the risks are monitored and documented as successful or less successful than expected.
![]() Issue logs, action-item lists, jeopardy warnings, and escalation notices are all types of communication reports that the project team and risk owners must use to document and track identified risks.
Issue logs, action-item lists, jeopardy warnings, and escalation notices are all types of communication reports that the project team and risk owners must use to document and track identified risks.
![]() Risk response audits measure the success of the responses and the effectiveness of the cost, scope, and quality values gained or lost by the risk responses.
Risk response audits measure the success of the responses and the effectiveness of the cost, scope, and quality values gained or lost by the risk responses.
![]() Earned value analysis can measure project performance, but it can also predict and signal pending risks within the project.
Earned value analysis can measure project performance, but it can also predict and signal pending risks within the project.
![]() As unexpected risks arise, the project team may elect to use workarounds to diminish the impact and probability of those risks. Workarounds, however, should be documented and incorporated into the project plan and risk response plan as they occur.
As unexpected risks arise, the project team may elect to use workarounds to diminish the impact and probability of those risks. Workarounds, however, should be documented and incorporated into the project plan and risk response plan as they occur.
SELF TEST
1. When is it appropriate to accept a project risk?
A. It is never appropriate to accept a project risk.
B. All risks must be mitigated or transferred.
C. It is appropriate to accept a risk if the project team has never completed this type of project work before.
D. If the risk is in balance with the reward.
2. Frances is the project manager of the LKJ Project. Which of the following techniques will she use to create the risk management plan?
A. Risk tolerance
B. Status meetings
C. Planning meetings
D. Variance meetings
3. Which of the following is not part of a risk management plan?
A. Roles and responsibilities
B. Methodology
C. Technical assessment board compliance
D. Risk categories
4. You are the project manager of the GHK Project. You and the manufacturer have agreed to substitute the type of plastic used in the product to a slightly thicker grade should there be more than a 7 percent error in production. The thicker plastic will cost more and require the production to slow down, but the errors should diminish. This is an example of which of the following?
A. Threshold
B. Tracking
C. Budgeting
D. JIT manufacturing
5. An organization’s risk tolerance is also known as what?
A. The utility function
B. Herzberg’s Theory of Motivation
C. Risk acceptance
D. The risk-reward ratio
6. A risk trigger is also called which of the following?
A. A warning sign
B. A delay
C. A cost increase
D. An incremental advancement of risk
7. The customers of the project have requested additions to the project scope. The project manager brings notice that additional risk planning will need to be added to the project schedule. Why?
A. The risk planning should always be the same amount of time as the activities required by the scope change.
B. Risk planning should always occur whenever the scope is adjusted.
C. Risk planning should only occur at the project manager’s discretion.
D. The project manager is incorrect. Risk planning does not need to happen at every change in the project.
8. Which one of the following best describes the risk register?
A. It documents all of the outcomes of the other risk management processes.
B. It’s a document that contains the initial risk identification entries.
C. It’s a system that tracks all negative risks within a project.
D. It’s part of the project’s PMIS for integrated change control
9. _______________ include(s) fire, theft, or injury, and offer(s) no chance for gain.
A. Business risks
B. Pure risks
C. Risk acceptance
D. Life risks
10. Complete this sentence: A project risk is a(n) _______________ occurrence that can affect the project for good or bad.
A. Known
B. Potential
C. Uncertain
D. Known-unknown
11. When should risk identification happen?
A. As early as possible in the initiation process
B. As early as possible in the planning process
C. Throughout the product management life cycle
D. Throughout the project life cycle
12. You are the project manager of the KLJH Project. This project will last two years and has 30 stakeholders. How often should risk identification take place?
A. Once at the beginning of the project
B. Throughout the execution processes
C. Throughout the project
D. Once per project phase
13. Which one of the following is an acceptable tool for risk identification?
A. Decision tree analysis
B. Decomposition of the project scope
C. The Delphi Technique
D. Pareto charting
14. You are the project manager for a project that will create a new and improved website for your company. Currently, your company has more than eight million users around the globe. You would like to poll experts within your organization with a simple, anonymous form asking about any foreseeable risks in the design, structure, and intent of the website. With the collected information, subsequent anonymous polls are submitted to the group of experts. This is an example of _______________.
A. Risk identification
B. A trigger
C. An anonymous trigger
D. The Delphi Technique
15. Which of the following describes SWOT?
A. An analysis of strengths, weakness, options, and timing
B. An analysis of strengths, weakness, opportunities, and threats
C. An elite project team that comes in and fixes project risks and threats
D. Ratings of 1 to 100
16. Which risk analysis provides the project manager with a risk ranking?
A. Quantifiable
B. Qualitative
C. The utility function
D. SWOT analysis
17. A table of risks, their probability, their impact, and a number representing the overall risk score is called a _______________.
A. Risk table
B. Probability and impact matrix
C. Quantitative matrix
D. Qualitative matrix
18. You are presented with the following table:

What is the EMV for Risk Event 3?
A. $135
B. −$300
C. $45
D. −$135
19. You are presented with the following table:

Based on the preceding numbers, what is the amount needed for the contingency fund?
A. Unknown with this information
B. 249,000
C. 117,150
D. 15,750
20. The water sanitation project manager has determined that the risks associated with handling certain chemicals are too high. He has decided to allow someone else to complete this portion of the project, so he has outsourced the handling and installation of the chemicals and filter equipment to an experienced contractor. This is an example of which of the following?
A. Avoidance
B. Acceptance
C. Mitigation
D. Transference
21. A project manager and the project team are actively monitoring the pressure gauge on a piece of equipment. Sarah, the engineer, recommends a series of steps to be implemented should the pressure rise above 80 percent. The 80 percent mark represents what?
A. An upper control limit
B. The threshold
C. Mitigation
D. A workaround
22. You are presented with the following table:
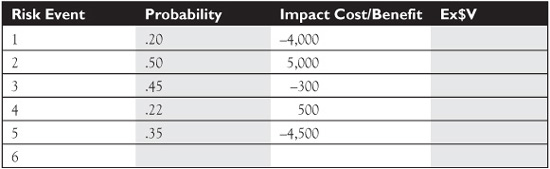
What would Risk 6 be based on the following information: Marty is 60 percent certain that he can get the facility needed for $45,000, which is $7,000 less than what was planned for?
A. .60, 45,000, 27,000
B. .60, 52,000, 31,200
C. .60, 7,000, 4,200
D. .60, −7,000, −4,200
23. What can a project manager use to determine whether it is better to make or buy a product?
A. A decision tree analysis
B. A fishbone model
D. An ROI analysis
24. Which of the following can determine multiple scenarios, given various risks and the probability of their impact?
A. Decision trees
B. Monte Carlo simulations
C. Pareto charts
D. Gantt charts
25. A project can have many risks with high-risk impact scores but have an overall low risk score. How is this possible?
A. The risk scores are graded on a bell curve.
B. The probability of each risk is low.
C. The impact of each risk is not accounted for until it comes to fruition.
D. The risks are rated high, medium, or low.
SELF TEST ANSWERS
1. When is it appropriate to accept a project risk?
A. It is never appropriate to accept a project risk.
B. All risks must be mitigated or transferred.
C. It is appropriate to accept a risk if the project team has never completed this type of project work before.
D. If the risk is in balance with the reward.
![]() D. Risks that are in balance with the reward are appropriate for acceptance.
D. Risks that are in balance with the reward are appropriate for acceptance.
![]() A, B, and C are all incorrect because these solutions are all false responses to risk management. It certainly is appropriate to accept a project risk in some instances. Consider the weather or the dangerous nature of some project work like construction. You don’t have to mitigate or transfer all risks, as some are worth accepting, exploiting, enhancing, or even sharing. Just because a project team has not done a particular type of work before does not equate to accepting risks.
A, B, and C are all incorrect because these solutions are all false responses to risk management. It certainly is appropriate to accept a project risk in some instances. Consider the weather or the dangerous nature of some project work like construction. You don’t have to mitigate or transfer all risks, as some are worth accepting, exploiting, enhancing, or even sharing. Just because a project team has not done a particular type of work before does not equate to accepting risks.
2. Frances is the project manager of the LKJ Project. Which of the following techniques will she use to create the risk management plan?
A. Risk tolerance
B. Status meetings
C. Planning meetings
D. Variance meetings
![]() C. Planning meetings are used to create the risk management plan. The project manager, project team leaders, key stakeholders, and other individuals with the power to make decisions regarding risk management attend the meetings.
C. Planning meetings are used to create the risk management plan. The project manager, project team leaders, key stakeholders, and other individuals with the power to make decisions regarding risk management attend the meetings.
![]() Choices A, B, and D are incorrect, since these choices do not fully answer the question.
Choices A, B, and D are incorrect, since these choices do not fully answer the question.
3. Which of the following is not part of a risk management plan?
A. Roles and responsibilities
B. Methodology
C. Technical assessment board compliance
D. Risk categories
![]() C. The technical assessment board may be used as part of the change control system. It is not relevant to risk management planning.
C. The technical assessment board may be used as part of the change control system. It is not relevant to risk management planning.
![]() A is incorrect. Roles and responsibilities are a part of the risk management plan. B, methodology, is part of the risk management plan because it identifies the approaches, tools, and data sources for risk management. D, risk categories, is part of the risk management plan.
A is incorrect. Roles and responsibilities are a part of the risk management plan. B, methodology, is part of the risk management plan because it identifies the approaches, tools, and data sources for risk management. D, risk categories, is part of the risk management plan.
4. You are the project manager of the GHK Project. You and the manufacturer have agreed to substitute the type of plastic used in the product to a slightly thicker grade should there be more than a 7 percent error in production. The thicker plastic will cost more and require the production to slow down, but the errors should diminish. This is an example of which of the following?
A. Threshold
B. Tracking
C. Budgeting
D. JIT manufacturing
![]() A. An error value of 7 percent represents the threshold the project is allowed to operate under. Should the number of errors increase beyond 7 percent, the current plastic will be substituted.
A. An error value of 7 percent represents the threshold the project is allowed to operate under. Should the number of errors increase beyond 7 percent, the current plastic will be substituted.
![]() B is incorrect, since tracking is the documentation of a process through a system or workflow, or the documentation of events through the process. C, budgeting, is also incorrect. D, JIT manufacturing, is a scheduling approach to ordering the materials only when they are needed in order to keep inventory costs down.
B is incorrect, since tracking is the documentation of a process through a system or workflow, or the documentation of events through the process. C, budgeting, is also incorrect. D, JIT manufacturing, is a scheduling approach to ordering the materials only when they are needed in order to keep inventory costs down.
5. An organization’s risk tolerance is also known as what?
A. The utility function
B. Herzberg’s Theory of Motivation
C. Risk acceptance
D. The risk-reward ratio
![]() A. The utility function describes a person’s willingness to tolerate risk.
A. The utility function describes a person’s willingness to tolerate risk.
![]() B is incorrect. Herzberg’s Theory of Motivation is an HR theory that describes motivating agents for workers. C is also incorrect. Risk acceptance describes the action of allowing a risk to exist because it is deemed low in impact, low in probability, or both. D, the risk-reward ratio, is incorrect. This describes the potential reward for taking a risk in the project.
B is incorrect. Herzberg’s Theory of Motivation is an HR theory that describes motivating agents for workers. C is also incorrect. Risk acceptance describes the action of allowing a risk to exist because it is deemed low in impact, low in probability, or both. D, the risk-reward ratio, is incorrect. This describes the potential reward for taking a risk in the project.
6. A risk trigger is also called which of the following?
A. A warning sign
B. A delay
C. A cost increase
D. An incremental advancement of risk
![]() A. Risk triggers can also be known as warning signs. Triggers signal that a risk is about to happen or has happened.
A. Risk triggers can also be known as warning signs. Triggers signal that a risk is about to happen or has happened.
![]() B, C, and D are all incorrect because these answers do not properly describe a risk trigger.
B, C, and D are all incorrect because these answers do not properly describe a risk trigger.
7. The customers of the project have requested additions to the project scope. The project manager brings notice that additional risk planning will need to be added to the project schedule. Why?
A. The risk planning should always be the same amount of time as the activities required by the scope change.
B. Risk planning should always occur whenever the scope is adjusted.
C. Risk planning should only occur at the project manager’s discretion.
D. The project manager is incorrect. Risk planning does not need to happen at every change in the project.
![]() B. When the scope has been changed, the project manager should require risk planning to analyze the additions for risks to the project’s success.
B. When the scope has been changed, the project manager should require risk planning to analyze the additions for risks to the project’s success.
![]() A is incorrect. The scope changes may not require the same amount of time as the activities needed to complete the project changes. C is incorrect because risk planning should not occur at the project manager’s discretion. Instead, it should be based on evidence within the project and the policies adopted in the risk management plan. D is also incorrect. When changes are added to the project scope, risk planning should occur.
A is incorrect. The scope changes may not require the same amount of time as the activities needed to complete the project changes. C is incorrect because risk planning should not occur at the project manager’s discretion. Instead, it should be based on evidence within the project and the policies adopted in the risk management plan. D is also incorrect. When changes are added to the project scope, risk planning should occur.
8. Which one of the following best describes the risk register?
A. It documents all of the outcomes of the other risk management processes.
B. It’s a document that contains the initial risk identification entries.
C. It’s a system that tracks all negative risks within a project.
D. It’s part of the project’s PMIS for integrated change control.
![]() A. The risk register documents all of the outcomes of the other risk management processes.
A. The risk register documents all of the outcomes of the other risk management processes.
![]() Choices B, C, and D are all incorrect definitions of the risk register.
Choices B, C, and D are all incorrect definitions of the risk register.
9. _______________ include(s) fire, theft, or injury, and offer(s) no chance for gain.
A. Business risks
B. Pure risks
C. Risk acceptance
D. Life risks
![]() B. Pure risks are the risks that could threaten the safety of the individuals on the project.
B. Pure risks are the risks that could threaten the safety of the individuals on the project.
![]() Choice A is incorrect because business risks affect the financial gains or loss of a project. C and D are incorrect, since these terms are not relevant.
Choice A is incorrect because business risks affect the financial gains or loss of a project. C and D are incorrect, since these terms are not relevant.
10. Complete this sentence: A project risk is a(n) _______________ occurrence that can affect the project for good or bad.
A. Known
B. Potential
C. Uncertain
D. Known-unknown
![]() C. Risks are not planned—they are left to chance. The accommodation and the reaction to a risk can be planned, but the event itself is not planned. If risks could be planned, Las Vegas would be out of business.
C. Risks are not planned—they are left to chance. The accommodation and the reaction to a risk can be planned, but the event itself is not planned. If risks could be planned, Las Vegas would be out of business.
![]() A, B, and D are all incorrect, since these terms do not accurately complete the sentence.
A, B, and D are all incorrect, since these terms do not accurately complete the sentence.
11. When should risk identification happen?
A. As early as possible in the initiation process
B. As early as possible in the planning process
C. Throughout the product management life cycle
D. Throughout the project life cycle
![]() D. Risk identification is an iterative process that happens throughout the project life cycle.
D. Risk identification is an iterative process that happens throughout the project life cycle.
![]() A and B are both incorrect because risk identification is not limited to any one process group. C is incorrect because risk identification happens, technically, throughout the project management life cycle, which is unique to each project, not the product management life cycle.
A and B are both incorrect because risk identification is not limited to any one process group. C is incorrect because risk identification happens, technically, throughout the project management life cycle, which is unique to each project, not the product management life cycle.
12. You are the project manager of the KLJH Project. This project will last two years and has 30 stakeholders. How often should risk identification take place?
A. Once at the beginning of the project
B. Throughout the execution processes
D. Once per project phase
![]() C. Risk identification happens throughout the project. Recall that planning is iterative—as the project moves towards completion, new risks may surface that call for identification and planned responses.
C. Risk identification happens throughout the project. Recall that planning is iterative—as the project moves towards completion, new risks may surface that call for identification and planned responses.
![]() A is incorrect. Risk identification should happen throughout the project, not just at the beginning. B is incorrect because risk identification is part of planning. D is incorrect because the nature of the project phase may require and reveal more than one opportunity for risk identification.
A is incorrect. Risk identification should happen throughout the project, not just at the beginning. B is incorrect because risk identification is part of planning. D is incorrect because the nature of the project phase may require and reveal more than one opportunity for risk identification.
13. Which one of the following is an acceptable tool for risk identification?
A. Decision tree analysis
B. Decomposition of the project scope
C. The Delphi Technique
D. Pareto charting
![]() C. The Delphi Technique, an anonymous risk identification method, is the correct answer.
C. The Delphi Technique, an anonymous risk identification method, is the correct answer.
![]() A is incorrect. Decision tree analysis is appropriate for calculating the expected monetary value of a decision, but not for risk identification. B is incorrect because the decomposition of the project scope will result in the WBS. D is incorrect. Creating a Pareto chart is part of quality control, not of risk identification.
A is incorrect. Decision tree analysis is appropriate for calculating the expected monetary value of a decision, but not for risk identification. B is incorrect because the decomposition of the project scope will result in the WBS. D is incorrect. Creating a Pareto chart is part of quality control, not of risk identification.
14. You are the project manager for a project that will create a new and improved website for your company. Currently, your company has more than eight million users around the globe. You would like to poll experts within your organization with a simple, anonymous form asking about any foreseeable risks in the design, structure, and intent of the website. With the collected information, subsequent anonymous polls are submitted to the group of experts. This is an example of _______________.
A. Risk identification
B. A trigger
C. An anonymous trigger
D. The Delphi Technique
![]() D. An anonymous poll allowing experts to freely submit their opinion without fear of backlash is an example of the Delphi Technique.
D. An anonymous poll allowing experts to freely submit their opinion without fear of backlash is an example of the Delphi Technique.
![]() A, B, and C are incorrect. These choices do not accurately answer the question.
A, B, and C are incorrect. These choices do not accurately answer the question.
15. Which of the following describes SWOT?
A. An analysis of strengths, weakness, options, and timing
B. An analysis of strengths, weakness, opportunities, and threats
C. An elite project team that comes in and fixes project risks and threats
D. Ratings of 1 to 100
![]() B. SWOT analysis is part of risk identification and examines the strengths, weakness, opportunities, and threats of the project to make certain all possibilities for risk identification are covered.
B. SWOT analysis is part of risk identification and examines the strengths, weakness, opportunities, and threats of the project to make certain all possibilities for risk identification are covered.
![]() A is incorrect because SWOT examines all four perspectives. C and D are incorrect because these ratings are part of quantitative-qualitative risk analysis.
A is incorrect because SWOT examines all four perspectives. C and D are incorrect because these ratings are part of quantitative-qualitative risk analysis.
16. Which risk analysis provides the project manager with a risk ranking?
A. Quantifiable
B. Qualitative
C. The utility function
D. SWOT analysis
![]() B. The risk ranking is based on the very high, high, medium, low, and very low attributes of the identified risks.
B. The risk ranking is based on the very high, high, medium, low, and very low attributes of the identified risks.
![]() A is incorrect because it is not relevant to the question. Look again—answer A is quantifiable, not quantitative. C is incorrect. Utility function describes an organization’s tolerance for risk. D, SWOT analysis, is part of risk identification.
A is incorrect because it is not relevant to the question. Look again—answer A is quantifiable, not quantitative. C is incorrect. Utility function describes an organization’s tolerance for risk. D, SWOT analysis, is part of risk identification.
17. A table of risks, their probability, their impact, and a number representing the overall risk score is called a _______________.
A. Risk table
B. Probability and impact matrix
C. Quantitative matrix
D. Qualitative matrix
![]() B. A table of risks, their probability, and their impact equate to a risk score in a risk matrix.
B. A table of risks, their probability, and their impact equate to a risk score in a risk matrix.
![]() A is incorrect, since it does not fully answer the question. C and D are incorrect because a risk matrix can be used in both quantitative and qualitative risk analyses.
A is incorrect, since it does not fully answer the question. C and D are incorrect because a risk matrix can be used in both quantitative and qualitative risk analyses.
18. You are presented with the following table:
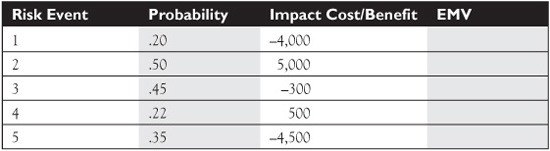
What is the EMV for Risk Event 3?
A. $135
B. −$300
C. $45
D. −$135
![]() D. Risk Event 3 has a probability of 45 percent and an impact cost of −$300, which equates to −$135.
D. Risk Event 3 has a probability of 45 percent and an impact cost of −$300, which equates to −$135.
![]() A, B, and C are all wrong because their values are incorrect answers for the formula.
A, B, and C are all wrong because their values are incorrect answers for the formula.
19. You are presented with the following table:

Based on the preceding numbers, what is the amount needed for the contingency fund?
A. Unknown with this information
B. 249,000
C. 117,150
D. 15,750
![]() C. The calculated amount for each of the risk events is shown in the following table:
C. The calculated amount for each of the risk events is shown in the following table:

![]() A, B, and D are incorrect answers because they do not reflect the contingency amount needed for the project based on the preceding table.
A, B, and D are incorrect answers because they do not reflect the contingency amount needed for the project based on the preceding table.
20. The water sanitation project manager has determined that the risks associated with handling certain chemicals are too high. He has decided to allow someone else to complete this portion of the project, so he has outsourced the handling and installation of the chemicals and filter equipment to an experienced contractor. This is an example of which of the following?
A. Avoidance
B. Acceptance
C. Mitigation
D. Transference
![]() D. Because the risk is not eliminated but transferred to someone else or another entity, it is considered transference.
D. Because the risk is not eliminated but transferred to someone else or another entity, it is considered transference.
![]() A is incorrect because the risk still exists, but it is handled by another entity. B is incorrect because the project manager has not accepted the risk, deciding instead to allow another entity to deal with it. C is incorrect. The risk has not been mitigated in the project.
A is incorrect because the risk still exists, but it is handled by another entity. B is incorrect because the project manager has not accepted the risk, deciding instead to allow another entity to deal with it. C is incorrect. The risk has not been mitigated in the project.
21. A project manager and the project team are actively monitoring the pressure gauge on a piece of equipment. Sarah, the engineer, recommends a series of steps to be implemented should the pressure rise above 80 percent. The 80 percent mark represents what?
A. An upper control limit
B. The threshold
C. Mitigation
D. A workaround
![]() B. The 80 percent mark is a threshold.
B. The 80 percent mark is a threshold.
![]() A is incorrect. An upper control limit is a boundary for quality in a control chart. C is incorrect. Mitigation is a planned response should a risk event happen. D is also incorrect. A workaround is an action to bypass the risk event.
A is incorrect. An upper control limit is a boundary for quality in a control chart. C is incorrect. Mitigation is a planned response should a risk event happen. D is also incorrect. A workaround is an action to bypass the risk event.
22. You are presented with the following table:
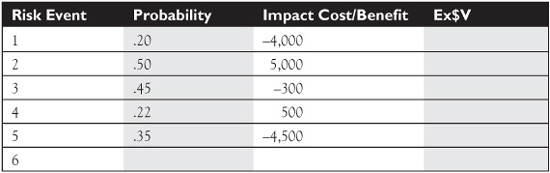
What would Risk 6 be based on the following information: Marty is 60 percent certain that he can get the facility needed for $45,000, which is $7,000 less than what was planned for?
A. .60, 45,000, 27,000
B. .60, 52,000, 31,200
C. .60, 7,000, 4,200
D. .60, −7,000, −4,200
![]() C. Marty is 60 percent certain he can save the project $7,000. The $4,200 represents the 60 percent certainty of the savings.
C. Marty is 60 percent certain he can save the project $7,000. The $4,200 represents the 60 percent certainty of the savings.
![]() A, B, and D are all incorrect since these values do not reflect the potential savings of the project.
A, B, and D are all incorrect since these values do not reflect the potential savings of the project.
23. What can a project manager use to determine whether it is better to make or buy a product?
A. A decision tree analysis
B. A fishbone model
C. An Ishikawa diagram
D. An ROI analysis
![]() A. A decision tree model can separate the pros and cons of buying versus building.
A. A decision tree model can separate the pros and cons of buying versus building.
![]() B and C are both incorrect. A fishbone diagram and an Ishikawa diagram show cause and effect. D is incorrect because ROI analysis does not answer the question as fully as decision tree analysis.
B and C are both incorrect. A fishbone diagram and an Ishikawa diagram show cause and effect. D is incorrect because ROI analysis does not answer the question as fully as decision tree analysis.
24. Which of the following can determine multiple scenarios, given various risks and the probability of their impact?
A. Decision trees
B. Monte Carlo simulations
C. Pareto charts
D. Gantt charts
![]() B. Monte Carlo simulations can reveal multiple scenarios and examine the risks and probability of impact.
B. Monte Carlo simulations can reveal multiple scenarios and examine the risks and probability of impact.
![]() A, decision trees, help guide the decision-making process. C, a Pareto chart, helps identify the leading problems in a situation. D, Gantt charts, compare the lengths of activities against a calendar in a bar chart format.
A, decision trees, help guide the decision-making process. C, a Pareto chart, helps identify the leading problems in a situation. D, Gantt charts, compare the lengths of activities against a calendar in a bar chart format.
25. A project can have many risks with high-risk impact scores but have an overall low risk score. How is this possible?
A. The risk scores are graded on a bell curve.
B. The probability of each risk is low.
C. The impact of each risk is not accounted for until it comes to fruition.
D. The risks are rated high, medium, or low.
![]() B. A risk can have a very high impact on the project, but inversely have an extremely low probability score.
B. A risk can have a very high impact on the project, but inversely have an extremely low probability score.
![]() A is incorrect and not relevant to the scenario. C is not a true statement. D is also incorrect. A model using high, medium, and low versus a numbering system would not alter the overall high- or low-risk score of the project.
A is incorrect and not relevant to the scenario. C is not a true statement. D is also incorrect. A model using high, medium, and low versus a numbering system would not alter the overall high- or low-risk score of the project.