

Performance management for IBM z/VM, Linux, and Oracle on IBM z Systems
For the last 10 years, server consolidation, virtualization, and workloads as services in the cloud environment have been the driving factors for the IT infrastructure industry. IBM z Systems is a platform that is designed for the consolidation of discrete servers that are running workloads, such as Oracle.
It also is designed for virtualizing physical hardware, such as processing units, memory, and I/O devices, and facilitating Oracle databases as services in the cloud environment. Virtualized environments are created on IBM z Systems by using a hardware hypervisor and a software hypervisor.
The physical machine can be divided into logical partitions (LPARs) and each LPAR can run one to thousands of Linux guests to host Oracle databases. Each Linux guest can also run one or many Oracle databases on them. Applications (such as Oracle) can be deployed to use simultaneous multithreading (SMT) to increase the processing efficiency and throughput. Single-instruction, multiple-data (SIMD) elevates performance enhancements in the analytics area.
These levels of sophistication and flexibility to run Oracle databases on IBM z Systems, along with the ability of the systems administrator to overcommit certain resources, such as CPU and memory, necessitate the need to monitor IBM z Systems vigorously for optimized usage and efficiency. Performance must be monitored on IBM z Systems at various levels, such as the hypervisor, hosting operating system, and work load levels.
In this chapter, we describe some of the more widely used tools that are used to monitor Oracle performance on IBM z Systems.
This chapter includes the following topics:
•zVPS
5.1 Oracle performance monitoring overview
One of the reasons for the popularity of Oracle workloads on IBM z Systems is the portability and transparency of the Oracle database operations across various platforms. Monitoring and tuning methodology at the Oracle database level and Linux OS level remains basic across all platforms.
However, IBM z Systems is often used as large hosting servers with multiple partitions in a virtualized shared environment for Oracle workloads, which are migrated from discrete servers with non-shared resources. The shared resources in a virtualized environment for Oracle databases require that the associated hypervisor should also be monitored and tuned. Conducting regular health checks on the system provides utilization and historical performance information that can be used for capacity planning and aid in performance analysis.
The powerful processors, memory, and exceptional I/O capabilities of IBM z Systems set great expectations for Oracle databases to perform at a higher level. Often, users complain about two common performance-related issues. The first complaint concerns degraded usage experiences in which users must spend more time on the day-to-day processes than usual. The other complaint concerns meeting scalability expectations. Before attempting to resolve any performance-related issues, it is vital to complete the following tasks:
1. Ensure that the Oracle workloads are sized accurately for CPU and memory requirements before they are migrated to IBM z Systems.
2. Identify the users and functionality that was added to the current databases and any new workloads.
3. Document any changes that were made to the databases and processor allocations, memory changes for SGA or pGA, changes to I/O structures and ASM, and Oracle parameter change.
4. Make note of any environmental changes to any of the computing resources (including network resources).
5. Make note of any database architectural changes, such as standalone, to RAC, or multitenant.
6. Look for any bugs that are related to Oracle releases, and ensure that the relevant patches are applied.
7. Look for any changes in the pattern of Oracle workloads executions. Previous workloads might have been sized to be run at different times, and might now be competing for the same resources or running at the same time.
8. Before starting a tuning exercise, ensure that you have the tools available to monitor and collect data at the following levels:
– Oracle database
– Hypervisor
– Linux OS
9. Ensure the processes to collect monitor data are established and repeatable.
Experience shows that Oracle databases performance issues are often the result of poorly written queries. The application developer’s accessibility and willingness to accommodate the changes to the identified queries are mandatory requirements.
It is important to know what tuning tools are available for IBM z Systems at various levels, what type of information they provide, and when to use them. In the following sections, we describe various sets of tools that are available at the Oracle database, hypervisor, and Linux levels.
5.2 Oracle database tools
Running the databases at optimal performance is a primary responsibility for an Oracle DBA. Achieving this goal requires familiarity with the available tools and the ability to choose the correct tool to use.
5.2.1 Oracle Diagnostics Pack
Oracle Diagnostics Pack is a comprehensive solution to manage the performance of Oracle database environments. This pack includes the following popular features:
•Automatic Workload Repository (AWR)
The AWR is a repository that collects statistics at predetermined intervals about the workloads within the database. The AWR provides a historical reference for performance changes over time, including establishment of performance baselines.
•Automatic Database Diagnostic Monitor (ADDM)
This feature is an automated tool that focuses on the Oracle database’s most intensive operations. It drills down proactively to determine the root cause of any performance problems.
•Active Session History (ASH)
The ASH samples session activity every second and stores the information in views. Many DBAs use the v$active_session_history view to isolate performance problems with individual database sessions.
5.2.2 Oracle Tuning Pack for Oracle Database
The Oracle Tuning Pack for Oracle Database automates the database tuning process and includes the following key features:
•SQL Tuning Advisor
One or more SQL statements can be entered that provide output in the form of specific advice or recommendations about how to optimize SQL for better performance, along with a rationale for each recommendation and its expected benefit. A recommendation might be to collect the statistics about objects, create indexes, restructure the SQL statements, or create SQL profiles.
An automatic mode facility is available that allows the database to automatically implement recommendations. The most frequent use of this feature often is real-time SQL monitoring. If a production environment experiences a performance issue, this method is the most efficient way for a DBA to determine what SQL statements are running while the problem is occurring.
•SQL Access Advisor
This feature enables you to optimize data access paths of SQL queries by recommending the proper set of materialized views and view logs, indexes, and partitions for a specific SQL workload. It gives advice about how to optimize schema design to maximize query performance.
This feature receives input from various sources, including AWR, to analyze a workload. It also provides recommendations about index creation and deletion, partition creation, and materialized views creation.
5.2.3 Oracle Enterprise Manager Cloud Control
Oracle Enterprise Manager Cloud Control is a popular tool for Oracle customers to manage databases and for provisioning. By using this tool, users can create or upgrade Oracle databases on Linux guests, and configure the network.
Cloud Control also provides an interface for performance advisors and for database utilities, such as SQL*Loader and Recovery Manager (RMAN). To manage Oracle databases, Database Control or Cloud Control can be used. These tools are intuitive, web-based tools from Oracle.
Database Control is included with every database installation and can be used to monitor a single database instance or a clustered database. Cloud Control can monitor many databases that are running on multiple environments from a single console. In addition to database monitoring, other applications, such as Siebel, PeopleSoft, and certain non-Oracle products (for example, IBM WebSphere Application Server) can also be monitored from a single Cloud Control console. Although the Cloud Control Server does not run on IBM z Systems, the agents run on the Linux guests and communicate with the Cloud Control.
5.2.4 STATSPACK
If the users are not licensed to use Oracle Diagnostics Pack and Database Tuning Pack, they can use the STATSPACK utility, with less functionality. Data is stored in tables that are owned by PERFSTAT.
5.2.5 Oracle Real Application Testing
In this section, we describe Oracle Real Application Testing, which includes the following features:
•Database Replay
This feature enables you to capture the database workload on a production system, and replay it on a test system with the same timing and concurrency as the production system on the same or later release of Oracle database.
•SQL Performance Analyzer
This feature enables you to assess the effect of system changes on SQL performance by identifying SQL statements that regressed, improved, or remained unchanged.
5.2.6 Oracle Orion tool
The Oracle Orion tool is used to predict the I/O performance of an Oracle database. The tool is part of Oracle database installation and simulates Oracle database I/O workloads by using the same I/O software stack as Oracle.
Orion can also simulate the effect of striping that is performed by Oracle Automatic Storage Management. It can run tests by using different I/O loads to measure performance metrics, such as MBPS, IOPS, and I/O latency.
If a database was created on a storage device, the storage alternatively can be calibrated by using the PL/SQL routine dbms_resource_manager.calibrate_io().
5.2.7 Downloadable tools from Oracle
The following downloadable tools are provided by Oracle in their support website. These tools also help to monitor and tune Oracle databases that are running on IBM z Systems:
•SQLTExplain (SQLT)
By using this powerful tool, users can diagnose SQL statements that are performing poorly. SQLT also helps to expedite SQL tuning process.
For more information, see MOS Note 215187.1.
•Light Onboard Monitor (LTOM)
LTOM provides real-time automatic problem detection and data collection. It proactively collects the necessary diagnostic traces in real time while the database or system performance problem is occurring.
For more information, see MOS Note 352363.1.
•Remote Diagnostic Agent (RDA)
The data that is captured provides Oracle Support with a comprehensive picture of the customer’s environment, which aids in problem diagnosis.
For more information, see MOS Note 414966.1.
•OSWatcher
This tool gathers system profile data, including vmstat, top, and iostat, and works similar to a “sar.”
For more information, see MOS Note 461053.1.
One of the deciding factors when considering the use of any of these tools is to ensure that the tool can collect usage metrics of the database. The tool also should identify specific database problems and solutions as they occur.
5.3 Hypervisor monitoring tools
For running Oracle databases on IBM z Systems, the certified hypervisor is IBM z/VM. Typically, IBM z Systems are divided into LPARs, and each LPAR can run one or thousands of Linux guests to host Oracle databases. Each Linux guest can also run one or many Oracle databases on them.
Oracle databases and the Linux system run multiple processes, and the operating system allocates resources to each of these processes. These multiple layers of virtualization can make it difficult for an operating system to find the best way to use the allocated resources.
Also, the Linux operating system was not originally designed to run in a shared environment, which makes the tuning environment complicated.
5.3.1 IBM Performance Toolkit for VM feature
The Performance Toolkit for VM provides enhanced capabilities for a z/VM systems programmer, system operator, or performance analyst to monitor and report performance data. Offered as a priced optional feature of z/VM, the Performance Toolkit for VM is derived from the FCON/ESA program (5788-LGA), which was not available in all countries.
The Performance Toolkit for VM provides the following functions:
•Operation of the system operator console in full-screen mode.
•Management of multiple z/VM systems (local or remote).
•Post-processing of Performance Toolkit for VM history files and VM monitor data that is captured by the MONWRITE utility.
•Viewing of performance monitor data that uses web browsers or PC-based 3270 emulator graphics.
•TCP/IP performance reporting.
For more information about Performance Toolkit for z/VM and performance on Linux, see the following resources:
•Linux on IBM System z: Performance Measurement and Tuning, SG24-6926
5.4 zVPS
zVPS, the Velocity Performance Suite from Velocity Software, provides the function for full performance management. The requirements for continuous performance management include having low overhead, a full performance database, and complete metrics. For data collection from z/VM, zVPS uses the CP Monitor. For data collection for Linux, network, and Oracle, zVPS is “agentless” and uses the snmp daemon for data collection.
For more information about the zVPS tool, see the following resources:
•Experiences with Oracle Database 12c Release 1 on Linux on System z, SG24-8159
5.5 IBM Wave for z/VM
In certain cases where the users are new to z/VM hypervisor environment, the IBM Wave for z/VM tool can be used to improve the productivity for the day-to-day operations of the z/VM systems. IBM Wave for z/VM simplifies virtualization management of z/VM and virtual Linux servers on IBM z Systems. It integrates seamlessly with z/VM and Linux environments to make VM auditing, storage, and reporting processes simple and cost-effective. The IBM Wave for z/VM tool includes the following features:
•Manage virtual Linux servers and processes from a single user interface.
•Support advanced z/VM capabilities by using only a few keystrokes.
•Simplify and automate common virtualization and administration tasks.
•Gain flexible reporting.
•Rapidly provision virtual Linux servers and z/VM resources.
•Reduce the learning curve to manage z/VM and virtual Linux servers.
•Easily identify, make available, and aggregate resources, which allows for fast deployments to a private cloud infrastructure.
For more information about IBM Wave for z/VM, see the IBM Wave for z/VM website.
5.6 OMEGAMON XE on z/VM and Linux
Bottleneck analysis and problem determination are facilitated by using sophisticated tools, such as IBM Tivoli® OMEGAMON® on z/VM and Linux. OMEGAMON detects performance problems and alerts before degraded response time becomes evident.
Information about your Linux instances that are running as z/VM guests and the Linux workloads reveals how they are performing and affecting z/VM and each other. OMEGAMON can perform the following functions:
•Compare Linux operations side by side with detailed performance metrics from other important systems.
•Data collection from the Performance Toolkit for VM (PTK is a prerequisite) complements data collection by the IBM Tivoli Monitoring for Linux on System z agent.
•View and monitor workloads for virtual machines, groups, response times, and LPAR reporting and view reports on z/VM and Linux usage of resources such as CPU utilization, storage, mini-disks, and TCP/IP.
•High-level views help executives understand how systems performance influences business and the bottom line.
•With granular views, IT staff can more easily track complex problems that span multiple systems and platforms and share related information.
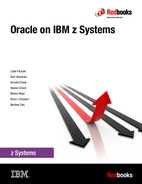
OMEGAMON includes a powerful agent to monitor the Oracle databases that are running on IBM z Systems. With its rich charting capabilities, it can provide the accurate information about how Oracle databases are performing by remote monitoring of the Linux servers with low overhead.
By monitoring Oracle system tables, it provides a wealth of information in a graphical way about the following key resources:
•Table spaces
•Cache Hit %
•Contention
•Archive Logs
•Rollback Segments
•Databases
•Instances
•Top SQL Statements
•Oracle Monitoring
•SGA
•pGA
•RAC
•ASM
Figure 5-1 shows an example of one of the OMEGAMON XE on z/VM and Linux screens.
Figure 5-1 Example screen of OMEGAMON XE on z/VM and Linux
The OMEGAMON agents are RAC aware. As an end-to-end solution for monitoring IBM z Systems, it provides the following benefits:
•Provides visibility into OS and Oracle metrics in-context. In Oracle environments, disk latency and other OS metrics, such as swap, memory, and CPU availability frequently affect Oracle.
•Easily navigates from the Oracle metrics to the underlying OS or hypervisor.
•Provides consistent metrics across personas (Dev, IT Ops, Lines of Business, Oracle SME, and so on).
•Has access to real-time and historical data.
•Use Analytics.
Figure 5-2 shows a sample window which displays the memory that is used by an Oracle relational database management system (RDBMS).

Figure 5-2 Memory used by an Oracle RDBMS
5.7 Linux monitoring tools
On IBM z Systems that are running Oracle databases, many tools are available from the Linux community.
The following standard tools are available for monitoring Linux guests that are running on IBM z Systems (this list is ever-growing):
•Pidstat : Per process statistics
•Slabtop : Kernel memory pool consumption
•Lsof: Check file flags of open files
•Blktrace: Low-level disk I/O analysis
•Hyptop: Cross guest CPU consumption monitor
•Iptraf: Network traffic monitor
•Dstat: Configurable live system overview
•Irqstats: Check IRQ amount and CPU distribution
•Smem: Per process/per mapping memory overview
•Jinsight: Java method call stack analysis
•Htop: Top on steroids
•Strace: System call statistics
•Ltrace : Library call statistics
•Kernel tracepoints: Get in-depth timing inside the kernel
•Vmstat: Virtual memory statistics
•Sysstat: Full system overview
•Iostat: I/O-related statistics
•Dasdstat: Disk statistics
•scsi statistics: Disk statistics
•Perf: Hardware counters, tracepoint-based evaluations, profiling to find hotspots
•Valgrind: In-depth memory/cache analysis and leak detection
•Java Health Center: High-level java overview and monitoring
•Java Garbage Collection and Memory visualizer: In-depth GC analysis
•Netstat: Network statistics and overview
•Socket Statistics: Extended socket statistics
•top/ps: Process overview
•Icastats/lszcrypt: Check usage of crypto-hardware support
•Lsluns/multipath: Check multipath setup
•Lsqeth: Check hardware, checksumming and buffer count
•Ethtool: Check offloading functions
•Collectl: Full system monitoring
•Ftrace: Kernel function tracing
•Lttng: Complex latency tracing infrastructure
•Ziomon: Analyze FCP setup and I/O
•Systemtap: Another kernel tracing infrastructure
•Wireshark/Tcpdump: Analyze network traffic in depth
•Iotop: Order processes by disk I/O
•Iftop: Per connection traffic overview
For more information about these tools, see the IBM developerWorks Resource Management and Analysis website.
For more information about how to use other tools and commands, see the following resources:
•Linux on IBM System z: Performance Measurement and Tuning, SG24-6926
5.8 Summary
Oracle databases are one of the popular workloads on IBM z Systems. Steps should be taken proactively to optimize the performance of Oracle databases on IBM z Systems by using the appropriate tools described in this chapter.
..................Content has been hidden....................
You can't read the all page of ebook, please click here login for view all page.