
Navigating U.S. Investment Markets
Tom Lydon
When you’re on the hunt for trends, one of the easiest ways to start is by looking at the major market indexes in the United States.
The Dow Jones Industrial Average (DJIA) is the barometer for the U.S. equity markets and is monitored daily by investors around the world. But the Dow is made up of only 30 stocks. While it’s the best-known index, it’s far from diversified. If you were looking for a better representation of U.S. stocks, you might pick the S&P 500, which is a large-cap value-weighted index, or the Russell 2000 index, which is a small-cap index.
There are many years when smaller companies perform better than large, established companies because they are more nimble and can better react to economic and market environments.
If you’re leery of small companies, bear in mind that some of them won’t always be small. Companies such as Microsoft (MSFT) and Home Depot (HD) were once small caps that were part of the Russell 2000 before they made it into the S&P 500 and eventually the DJIA.
But these indexes are only the beginning. Broad indexes are great barometers for gauging the overall health of the markets. But if you only base your investments on the performance of the Dow, S&P 500, or Russell 2000, you’re doing yourself and your portfolio a huge disservice.
If you need to invest in the stock market to reap growth, there are dozens of ways in which you can do it. The best place to start in this discussion is with the markets with which you are likely most familiar: the United States.
Choices Galore
Investors have been gravitating toward the most familiar benchmarks for decades. For the past 100 years, the most popular benchmarks by leaps and bounds have been the S&P 500 and the Dow. Investors tend to go with what makes them comfortable, what they know, and what they can easily check. The S&P, in particular, is the go-to index because of its diversity of holdings. The Dow, with only 30 holdings, is probably the most frequently talked about, but it’s not the best barometer. There are a few major U.S. indexes (see Table 1), and they’re all different in their construction.

The universe of indexes goes way beyond the S&P 500 and Dow, however, covering all different sectors, subsectors, and asset classes. One reason so many indexes exist is that they all have a different take on the market, giving them their own unique performance at any given time.
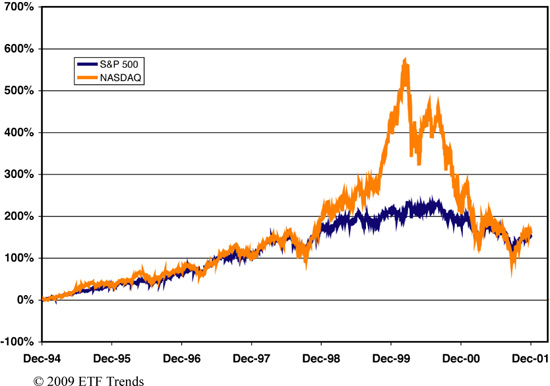
For example, the large-cap S&P 500 could be trending higher, while the tech-heavy NASDAQ is trending lower. Or the small-cap Russell 2000 might be all the rage, while the 30 monsters in the Dow Jones are faltering.
As you can see from Figure 1, the NASDAQ Composite far outperformed the S&P 500 in the technology boom in the late 1990s.
Figure 1 S&P 500 versus NASDAQ Composite, 1994–2001
Before talking more about certain periods of ups and downs for various indexes large and small, let’s take an in-depth look at some of the most popular ones.
Dow Jones Industrial Average
The blue-chip Dow Jones 30 Industrial Average Index, started by journalist Charles Dow in 1896 (although it looks much different today), is the oldest and the best-known of the indexes run by Dow Jones, Inc. Dow’s creation was born from a desire to create a window through which stock market outsiders could peer in. While those on Wall Street were welcome to have a look, too, Dow wasn’t as concerned with them. His index was for the common man—the Average Joe, if you will.
Today many other indexes exist, but the Dow is often considered the heartbeat of the American economy. Any given day after the markets close, we can hold up our stethoscopes and listen with bated breath as the business reporters on television and in newspapers give us a number. For many people, right or not, the Dow is the stock market.
In some ways, the Dow doesn’t look much like it did in those early days. In the beginning, it had an unweighted average of 11 companies. In 1928, it was finally expanded to 30 large-cap stocks—companies with a market capitalization of at least $10 billion, although this can change over time—representing every major sector in the stock market.
Whatever path a company is taking to get to the upper echelon, one thing is for certain: As long as the stock price continues to rise, so does the company’s market cap. Most large-caps are in the energy, technology, financial, and healthcare sectors, reflecting those sectors’ growing importance and relevance in our economy. The financial and healthcare sectors are particularly catering to baby boomers, as their generation ages.
Large-caps are generally best suited for a long-term investment because these big companies aren’t growing at a rate as fast as small-caps and mid-caps. After all, when you’re at the top, you don’t have as much room to grow. But in exchange for the slower but steady growth, your money buys you a measure of security.
The current components of the DJIA are some of the most common, best-known, and largest companies operating in the United States today (see Table 2).
Table 2 The Current Dow 30*

The S&P 500
Introduced in 1957, the Standard & Poor’s 500 is a compendium of the 500 largest publicly owned corporations, most of which are American. The companies in this index are chosen by committee and are broadly representative of the various industries in the U.S. economy.
The S&P 500 isn’t as simple as it looks, though. This index isn’t merely a list of the 500 largest corporations. It is a market-weighted index, and companies gain entrance based on a variety of factors: market size, liquidity (the ability to buy or sell an asset in large quantities without doing a number on the asset’s price), and how well they represent their sector overall.
Russell Mid-Cap Index
Mid-cap stocks are those with a market cap between $1 billion and $8 billion. Although the companies that make up the large-caps in the United States are mostly household names, mid-caps aren’t firmly defined. According to Morningstar, “The best way to get a handle on the mid-cap universe is to view it as a collection of the most successful small-cap stocks and the least successful large-cap stocks.”
An added bonus of mid-caps is greater transparency: Small and medium-sized companies tend to have financial statements that read much simpler than those of large-caps. Before you write off mid-caps as too “middle,” consider this: Home Depot (HD), the world’s largest home improvement retailer, was once a mid-cap. Most of the big companies we know today had to start somewhere. Today Home Depot operates more than 2,000 stores in the United States, Canada, Mexico, and China, and enjoys a position in the DJIA. When you invest in today’s mid-caps, you just might be sitting on tomorrow’s large-caps.
The Russell 2000
The Russell 2000 Index measures the performance of the small-cap segment of the U.S. equity universe. It includes approximately 2,000 of the smallest securities, based on a combination of market cap and current index membership.
Small-caps are companies with a market capitalization between $250 million and $2 billion. Small-caps have a number of pros and cons: First, they have tremendous growth potential. Everyone has to start somewhere, right? Most companies don’t burst onto the scene, brimming with assets. These types of companies help fuel the Russell 2000 to outperform the large-cap index during the long-term uptrends.
Large-caps might be the squeaky wheels that get the grease, but don’t be so quick to dismiss the lesser-known entities. Small-caps and mid-caps outperformed large-caps between 1998 and 2007. In all but one year, from 1926 to 2006, small-company stocks outperformed the largest stocks, according to a study by Ibbotson Associates. The study also revealed that $1 invested each in small-cap and large-cap equities in 1926 would be valued at $15,921 and $3,077, respectively, as of December 31, 2006.
In fact, after the 15 bear markets since 1932, small-caps outperformed large-caps 12 times, according to research from The Leuthold Group, a Minneapolis-based firm. For example, in the 12 months following the 2000–2002 bear market, small-cap performance nearly doubled that of large-caps, 46% versus 24%. Another illustration of this wide gap came a year following the 1982 crash, when small-caps surged 96% compared to 59% for their large-cap counterparts.