
If out-of-the-box views and charts don't meet your requirements, then Microsoft Dynamics CRM 2013 also provides the option to create powerful reports using the marketing data you have captured with the help of Report Wizard. You can use the wizard to create a report that can render data from various marketing-related entities in a simple tabular format. It also provides features that allow you to group, summarize, and aggregate information. In addition, you will also have the option to embed charts and graphs as needed.
Microsoft Dynamics CRM 2013 provides a Report Wizard option that can be used to create new marketing reports within the CRM application. We will now see the steps involved in creating a simple tabular report to display the leads qualified monthly:
- Start the Report Wizard to create a new report under the Reports section. You will have two options: you can create a new report from the ground up, or you can use an existing report as a template, as shown in the following screenshot:
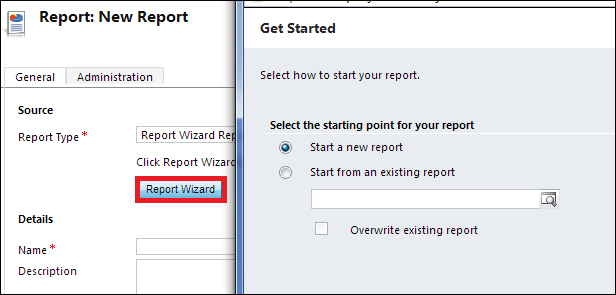
Create a new marketing report
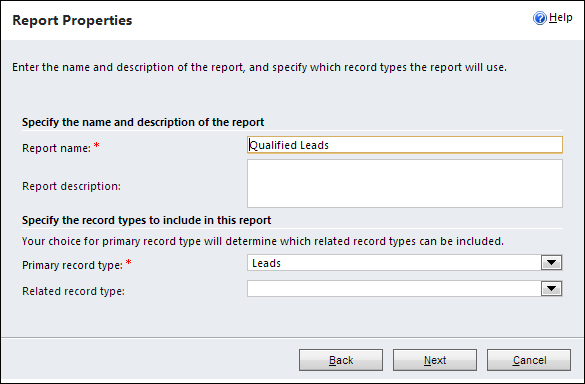
- Next, specify the properties such as Report name and Report description. You need to also specify Primary record type for the report, as shown in the following screenshot:
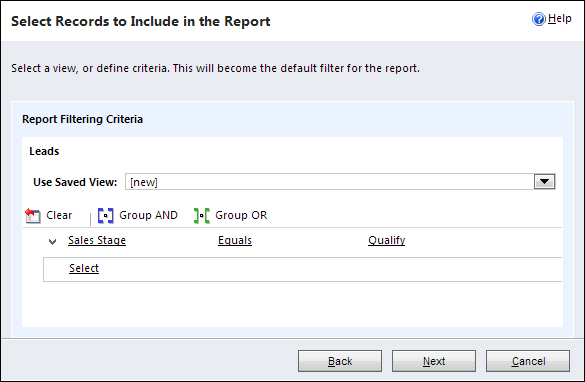
- Next, specify the filtering criteria for the report, identifying conditions using an expression tree, as shown in the following screenshot:
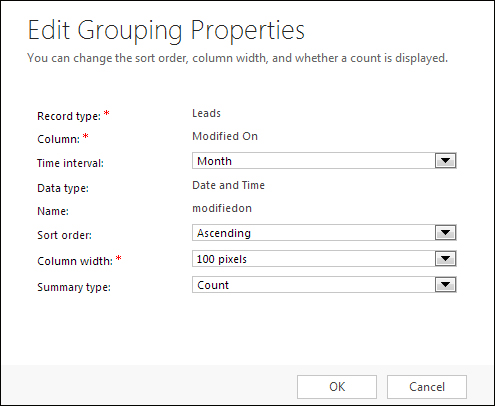
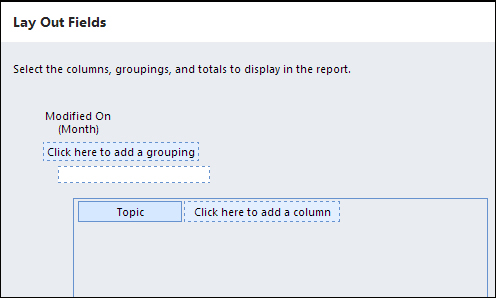
- Specify the report grouping properties according to how you want the information to be grouped as shown in the following screenshot:
- In the final step, specify the entity columns to be displayed in the report. In the following screenshot, the Topic column is selected for display:
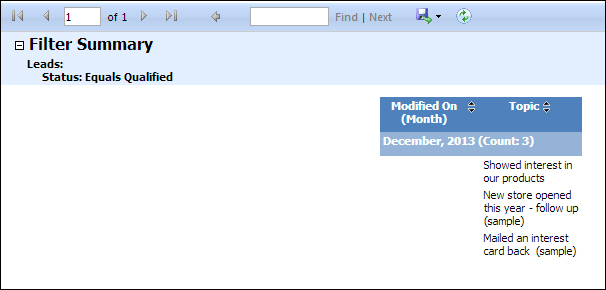
- Select the Table only report and click on Finish to create the new report that shows Leads qualified and grouped by month.
Microsoft Dynamics CRM provides a list of out-of-the-box marketing reports that can be directly used by marketers to analyze campaigns as shown in the following screenshot:
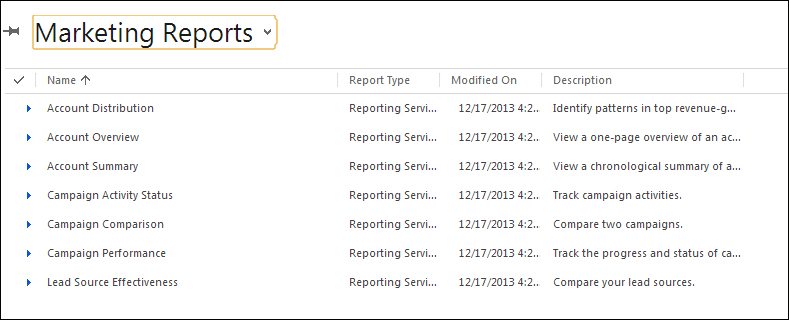
The marketing reports are fairly self-explanatory, and you can explore them as an exercise. For example, you can use the Campaign Comparison report to track the progress and status of your campaigns, and so on.
Reports in CRM have been extensively used to identify complex patterns in data and to provide business intelligence to support the decision making and strategic planning for organizations. Reports also provide the flexibility of being able to integrate them into the dashboard without the need for users to explicitly run the reports, making the most critical information instantly available to the users.