Both the Office Communications Server and Office Communicator use the Windows Software Trace Pre-processor (WPP) utility that is part of the operating system. The client manages this itself and dumps logs based on a check box in the UI (which drives one of several registry keys). The server dumps logs based on the tracing tool provided in the MMC snap-in. Though these logs are extremely useful, they also contain a great deal of very detailed information—much of which might not pertain to any problem or issue that is being investigated or analyzed. This section introduces the subject of tracing and offers some basic insights into looking through logs. Other sections on debugging and diagnostics delve into the more technical details included in tracing log files.
As of this release, Communicator logging can now be controlled via the General menu inside Tools | Options. Two check boxes on the dialog box control logging and event log messages. Refer to Figure 16-1 earlier in this chapter for a view of the dialog box. All protocol messages for the remainder of this section were captured by enabling logging in Communicator and gathering protocol messages from the log.
Values under the registry key HKCUSoftwareMicrosoftTracingUccpCommunicator are used for Communicator log configuration. The value EnableFileTracing can be turned on or off by setting it to 0 or 1, respectively. MaxFiles is set to 2 by default, but you can specify that only one file should be created or that many should exist to maintain more history when the log file is recycled. MaxFileSize is set to 0 x 800000 (~8.3 MB) by default and determines how large the log file can get before it is cleared and starts over. FileDirectory determines the directory where log files will be stored and is set to %USERPROFILE%Tracing by default.
Default settings create the log in %USERPROFILE% racingCommunicator-uccp-0.uccplog, which is generally in C:Documents and Settings<username> racingCommunicator-uccp-0.uccplog.
As previously mentioned, default settings create two log files with up to approximately 8.3 MB of logs for each. Once the first file (mentioned earlier) fills up, the second file, Communicator-uccp-1.uccplog is used. Once the second file fills up, its content overwrites the first log file, and the second file will clear itself and add new content until it runs out of space and overwrites the first log file again.
Note
Be aware of your logging settings. If logging is run for too long, it can be difficult to find the data of interest, and (if there was a lot of network activity) interesting data might eventually be overwritten. It is important to limit the time when logging is enabled and to avoid logging during actions that create large amounts of traffic (such as an initial login) unless absolutely necessary. For ease of use during an investigative session, increasing the MaxFileSize value (0 x 2000000 allows for ~33.5 MB) and setting MaxFiles to 1 allows larger amounts of data to be analyzed in a single file.
Your first few attempts at viewing trace files can be an involved process as you learn what to look for and what can be safely ignored. Trace files contain protocol data as well as internal programmer logs that make it more difficult to decipher at first. Using tools such as findstr.exe (or grep.exe/qgrep.exe) makes it easier to scan through trace files if you know what you are looking for. Refer to the "Using ClientLogReader" and "Using Snooper" sections later in this chapter to learn about more advanced tools that can make quick work of these log files. Generally speaking, only very detailed problems require wading through the raw logs, and use of Snooper or ClientLogReader is a much faster way to gather diagnostic information.
Note
If logging configuration has been changed to allow it, log files can grow upward of 20MB for an active client. Be aware that logs of this size won't load easily in Notepad and that other editors should be used such as WordPad, Emacs, or VI. Tools like ClientLogReader and Snooper are discussed in later sections of this chapter and are specifically built to interpret and quickly display information from these log files.
The first thing to understand is the structure of the log. An example of one line from the log file follows.
07/13/2007|11:13:51.203 A38:82C TRACE ::
CUccSubscriptionEventInfo::GetOperationInfo - enter [0x04356808]
The first 10 characters always contain the date, with a "|" character separating it from the next 12 characters that contain the time. A space separates the time and the next field, which is always 7 characters and represents the thread that logged this message (normally a single thread). A space separates the thread ID from the next 5 characters that identify the type of log (TRACE, INFO, WARN, ERROR). A space, two colons ('::'), and a space then separate the log type from the content of the log. In the previous example, CUccSubscriptionEventInfo::GetOperationInfo - enter [0x04356808] is the content. Because of this rigid formatting, it is much easier to write scripts and tools to parse the log files.
The TRACE log type is generally only of interest to the product development team and product support. INFO logs are informational and can be of interest, but can also provide more detail than necessary and create confusion. WARN logs highlight warnings where a problem might exist, or the issue might be handled by other components. ERROR logs highlight errors, although some of these errors should really be warnings. Therefore, if the ERROR logs don't make much sense, you can probably ignore them. Most problematic errors eventually show up as INFO or ERROR logs that are at least somewhat meaningful and understandable.
Note
On the CD Protocol messages show up as INFO logs. Examples can be seen in the Communicator log files included in the Appendices,Scripts,ResourcesChapter 04 folder.
All protocol logs have a similar format. An INFO log always precedes the message data, which helps identify it. The following examples for sending and receiving a protocol message are shown for clarity.
... 07/13/2007|11:13:51.687 A38:82C INFO ::Sending Packet- 192.168.1.100:443 (From Local Address: 192.168.1.103:2780) 1719 bytes: 07/13/2007|11:13:51.687 A38:82C INFO ::<MESSAGE DATA HERE>... 07/13/2007|11:13:51.828 A38:82C INFO ::Data Received- 192.168.1.100:443 (To Local Address: 192.168.1.103:2780) 903 bytes: 07/13/2007|11:13:51.828 A38:82C INFO ::<MESSAGE DATA HERE>...
Looking for the leading INFO trace for Sending Packet or Data Received makes it easier to work through the voluminous data at a protocol level.
Note
Please keep in mind that INVITE and MESSAGE messages do not log the body of the message for privacy reasons. Obtaining a full view of the message logging will need to be done on the server. Refer to Chapter 4 for more details on enabling full-message body logging from the server side.
Ignoring Misleading Logs Many logs appear regularly and can be misleading during the first few investigations with client logs. Some of these logs are presented here to make reading them for the first time faster and more effective. Logs that might be confusing are listed in the examples that follow.
...
07/13/2007|13:27:53.750 A38:82C ERROR :: SIP_STACK::MapDestAddressToNatInternalAddress
m_pDirectPlayNATHelp is NULL.
Setting *pIsDestExternalToNat to FALSE
...
07/13/2007|11:13:51.203 A38:82C ERROR :: Condition failed with 80ee0058: 'm_lContainerID
!= INVALID_CONTAINER_ID'
...
07/13/2007|11:13:51.687 A38:82C ERROR :: HRESULT failed: 800cce05 = hr. spMimePropSet-
>GetProp
...
07/13/2007|11:33:56.250 A38:82C ERROR :: CSipSubscription::
SubscriptionStateChange already changed to state 3, input state 3
...
07/13/2007|11:33:56.734 A38:82C ERROR :: CUccRichPresenceParser::ParseCategoryInstance -
Instance id is NOT present.
Category note. 0x80ee0058
...
07/13/2007|12:41:45.312 A38:82C ERROR :: REGISTER_CONTEXT::
HandleRegistrationSuccess SetGruuByProviderId failed 80ee0058
...
07/13/2007|12:57:45.859 A38:82C ERROR :: REGISTER_CONTEXT::
HandleRegistrationSuccess - ParseMsUserLogonDataHeader - hr=0x00000000, bRemoteUser=1
...
07/13/2007|11:33:54.531 A38:82C ERROR :: Condition failed with 00000001:
'pos != 0'
...
07/13/2007|11:45:43.156 A38:82C ERROR :: CUccPublication::Publish
[01AD3950] - Publication does not contain any instances
...
These logs are listed without much explanation because they are easily red herrings—logs that should really be INFO traces and not ERROR traces. This can be very misleading because a successful login on a production system with many local and federated contacts resulted in 2900 ERROR traces. Working through these logs can be difficult, but working from the end of the log and looking at the log immediately after a failure can help reduce the volume of data that needs to be reviewed.
Note
On the CD To simplify things, the ClientLogReader script or the Snooper tool (which are included on the CD in the Office Communicator Server 2007 Resource Kit Tools) can both help read Communicator 2005 and Communicator 2007 trace logs instead of you having to manually scan through the log file. The Snooper tool, which is detailed in the Understanding Office Communications Server Traces section, can be launched from the server MMC and is a viewer for server logs. However, it can also load the client trace file to look at protocol messages in a summary and in full view. The ClientLogReader script is covered in the following "Using ClientLogReader" section.
Using ClientLogReader When some common problems occur, the logs provide useful information. The PERL (Practical Extraction and Report Language) script ClientLogReader from the Office Communications Server 2007 Resource Kit Tools helps tremendously in diagnosing these problems. This tool (also available on the CD) sifts through the client logs and identifies problem records in a meaningful way. The tool can be used to analyze a log file and point out potential problems as well as to show all protocol messages in full or summary mode. The following examples of using the script (with the resulting data trimmed for brevity) introduce the script's capabilities and the output that can be expected.
C:Documents and SettingsJeremyTracing>perl clientlogreader.pl -helpVersion: 1.0, Last Update: 07JUN2006 USAGE: perl clientLogReader.pl [-f fileToProcess] [-protocol] [-protocolSummary] [-tail] fileToProcess - if not specified input is taken from standard input the file to process - can contain wildcards -protocol - SIP protocol messages will all be output along with hints -protocolSummary - SIP protocol messages will have start lines displayed -tail - log file will be watched if it grows and/or is recreated EXAMPLE: perl clientLogReader.pl -f lcapi*.log -protocolSummary perl clientLogReader.pl -f lcapi*.log -protocol perl clientLogReader.pl -f lcapi4.log -tail Look in the README.txt file for this tool for more help and examples C:Documents and SettingsJeremyTracing>perl clientlogreader.pl-f Communicator-uccp-0.uccplogWARNING: DNS resolution failed for oldserver.contoso.com because the hostname wasn't found (WSANO_DATA) C:Documents and SettingsJeremyTracing>perl clientlogreader.pl-f Communicator-uccp-0.uccplog -protocolINFO: Incoming from 192.168.1.100:443 (via 192.168.1.103:2780) $$$begin-message$$$ ... $$$end-message$$$ INFO: Outgoing to 192.168.1.100:443 (via 192.168.1.103:2780) $$$begin-message$$$ ... $$$end-message$$$ ... C:Documents and SettingsJeremyTracing>perl clientlogreader.pl-f Communicator-uccp-0.uccplog -protocolSummaryINFO: Outgoing to 192.168.1.100:443 (via 192.168.1.103:2780) SUBSCRIBE sip:sip.contoso.com:443;transport=tls;lr;ms-route- sig=hu4T8Jd65_O8xKIjN1aUGxssauUPBSsbQNNOYHwAAA SIP/2.0 INFO: Incoming from 192.168.1.100:443 (via 192.168.1.103:2780) SIP/2.0 200 OK ...
The –tail option is not shown in the preceding example, but it allows a log file that is being written by Communicator to be analyzed and its output data to be shown as Communicator runs. This can be especially useful to detect problems or protocol failures daily in the summary view that might otherwise be hidden or go unnoticed.
Server tracing changed significantly with the release of Office Communications Server 2007, and logging can now be initiated and configured, and files can be viewed directly from the MMC. The logging infrastructure is now using WPP instead of the flat-file logging component used in the past. This update results in all client and server traces being logged with the same mechanism and allows remote and interactive logging of server components across the topology. It is now also possible to filter by server component as well as by user and/or server when looking for logs to reduce processing time and the volume of logs created when specific debugging is in process.
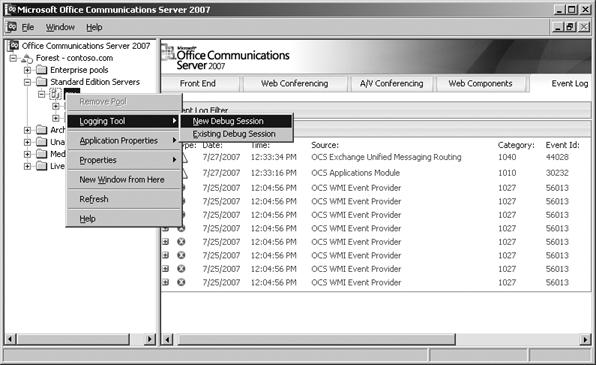
The Office Communications Server 2007 Logging Tool can be launched by right-clicking the node that corresponds to the server's short name and selecting Logging Tool | New Debug Session, as shown in Figure 16-4.
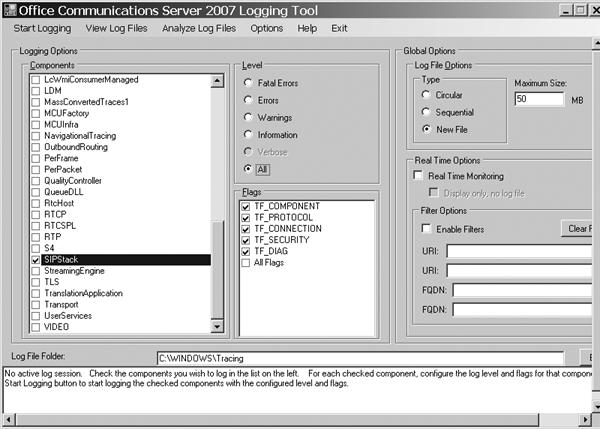
The Logging Tool shown in Figure 16-5 contains a large set of features in one tool to make it easy to learn and then apply across topologies and technologies. The features include:
Starting and stopping logging
Enabling/disabling logging individually by server component
Control over logging options
Defining specific log file options, such as recycling type and maximum size
Formatting information for the log prefix, buffering, and clock resolution
Enabling real-time monitoring instead of only log-based mechanisms
Enabling user Uniform Resource Identifier (URI) and server FQDN filtering of protocol logs
Ability to directly view and analyze the log with the Snooper tool (if the Office Communications Server 2007 Resource Kit Tools have been installed)

Snooper is included in the Office Communications Server 2007 Resource Kit Tools. It can show protocol summaries and allow full-message text to be displayed. It can load all server and client logs and even allow errors to be identified by looking up user information in the archiving database (if one exists). It can also look up conferencing and presence reports for individual users, conferences, and health reports for MCUs and can display users who have more than a specified number of contacts or permission settings. An example of Snooper with a client log loaded is shown in Figure 16-6. In addition, see the Using Snooper section later in this chapter for more information on the capabilities of this tool.

Once the Office Communications Server 2007 Logging Tool is launched (refer to Figures Figure 16-4 and Figure 16-5), a few steps must be taken to gather a server trace log. In this example, a SIP stack log is collected into a log file. To do this, only the SIPStack component check box should be selected, all levels and flags should be enabled, logging to C:WindowsTracing should be left as the default, and no real-time options should be selected (no active display or filtering of the content). For reference, the Flags section identifies subcomponents that log information if they are enabled, thereby allowing protocol, diagnostic information, connection-level, or other details to be logged or ignored (for SIPStack) to prevent the trace logs from being overwhelmed by too much information if a precise area of the server must be investigated. After this configuration is selected, the dialog box should appear as shown in Figure 16-7.
Once the tracing configuration is set, select the Start Logging menu item to begin logging for the server. If desired, real-time monitoring can be enabled to show the log output in a console as it occurs or to show the console output and log to the log file as normal. Once the network or communication actions of interest are complete, the Stop Logging menu item can be selected to finish logging and prepare the text trace log. Finally, the View Log Files menu item can be used to view the text files (in Notepad), or Analyze Log Files can be used for a summary view of the protocol messages in Snooper (assuming that the Office Communications Server 2007 Resource Kit Tools are already installed). It is worth noting that log files can contain errors and other issues that won't show up in protocol logs, so be aware that the way in which you view the log files can make it easy for you to forget that errors might exist.
Note
If the log file has grown upward of 20MB, be aware that logs of this size won't load easily in Notepad and that other editors should be used such as WordPad, Emacs, or VI. Snooper is specifically built to interpret and quickly display information from these log files, but it does not show all of the details that can be seen if the log file is interpreted directly.
The Real-Time Monitoring section can enable a text window that shows the logs as they occur, and filters can be enabled to prevent logs that don't pertain to specific users or servers from showing. This capability is of great utility when working on a busy server because it can reduce the amount of data that scrolls past on the display.
More details and information about the Logging Tool can be found in the product documentation. Most of the remaining features in the Options menu are of interest only during an engagement with product support.
Direct from the Source: Using Trace Filters to Diagnose a Problem on a Busy Server
Logs collected by the Office Communications Server 2007 Logging Tool are valuable, but can quickly become very large on a busy server. For example, a Standard Edition server that hosts thousands of users could log 1MB or more per second of SIP message data. If the problem being investigated requires logging to be enabled for more than a few minutes, the resultant log files might be several GB in size. Such log files are difficult to view and manipulate and might impact server performance due to the disk space that they consume. Fortunately, most problems can be isolated to one or two users or, in the case of an edge proxy, one or two peer servers. The Filter Options supported by the Office Communications Server 2007 Logging Tool can thus be used to greatly reduce the size of log files on a busy server. The following sections discuss problems that have been seen in customers' live deployments of Office Communications Server 2007 and its predecessor, Live Communications Server 2005 with SP1.
Scenario One: Remote User Cannot Log In
In this scenario, a remote user (an employee who is currently located outside the enterprise) has called the help desk of a large company and reported that he cannot log in via the company's edge proxy server. The edge proxy in question not only routes traffic from remote users, but also routes traffic from federated peers and public instant messaging connectivity (PIC) providers. Therefore, hundreds or thousands of SIP messages per second might pass through the edge proxy.
The obvious place to start an investigation into this problem is the edge proxy. Simply running the Office Communications Server 2007 Logging Tool will quickly result in very large log files. Instead, we enter the URI of the affected remote user into the first URI field under Filter Options and then select the Enable Filters check box, as shown in Figure 16-8.

When logging is started, only SIP messages and related events that contain the user URI of interest appear in the trace log; all other data is ignored, resulting in a small and focused log file. The cause of the problem is typically evident from the failure SIP responses being sent back to the client. For example, the ms-diagnostics field in SIP responses received at the internal edge of the edge proxy from a director might provide a hint as to why a REGISTER or INVITE request has failed.
If the cause of the problem is not evident from the (filtered) log recorded on the edge proxy, then the same procedure can be used to obtain filtered logs on an internal server, such as a director. Simply enter the URI of the affected remote user and enable filters, as in Figure 16-8.
Scenario Two: Incorrectly Configured Firewall Causes Intermittent Failure of IMs to Users in a Federated Partner
In this scenario, one or more users in a large company have called the help desk and reported intermittent failures when sending and receiving instant messages (IMs) from buddies in another company. Routing between the two companies is achieved by federation between their respective edge proxy servers. The local edge proxy routes traffic to many federated partners and PIC providers, so hundreds or thousands of SIP messages per second might pass through the edge proxy.
Simply running the Office Communications Server 2007 Logging Tool on the local edge proxy will quickly result in very large log files. Instead, we enter the FQDN of the edge proxy of the federated partner in the first FQDN field under Filter Options and then select the Enable Filters check box, as shown in Figure 16-9.

When logging is started, only SIP messages and related events that originate from, or are destined to, the FQDN of interest appear in the trace log; all other data is ignored, resulting in a small and focused log file. In this particular scenario, the remote edge proxy server appears to be dropping the MTLS connection for some reason. This manifests itself as TF_CONNECTION and TF_DIAGNOSTIC messages at TL_ERROR level in the trace log. For example:
TL_ERROR(TF_CONNECTION) [0]0B90.07F8::09/05/2007-07:06:29.805.00000088
$$begin_record
LogType: connection
Severity: error
Text: Receive operation on the connection failed
Local-IP: 10.0.0.13:1142
Peer-IP: 10.0.0.10:5061
Peer-FQDN: sip.contoso.com
Peer-Name: sip.contoso.com
Connection-ID: 0x502
Transport: M-TLS
Result-Code: 0x80072746 WSAECONNRESET
$$end_record
TL_ERROR(TF_DIAG) [0]0B90.07F8::09/05/2007-07:06:31.991.0000008d
$$begin_record
LogType: diagnostic
Severity: error
Text: Message was not sent because the connection was closed
SIP-Start-Line: MESSAGE sip:[email protected];opaque=user:epid:G-
AWNAmf8Vqf8tSG2CexVwAA;gruu SIP/2.0
SIP-Call-ID: a524eda4c75e49e58a3777d0478d49a8
SIP-CSeq: 7 MESSAGE
Peer: sip.contoso.com:5061
$$end_record
Furthermore, the MTLS connection is being dropped at a regular interval of every 30 seconds or so.
TL_ERROR(TF_DIAG) [0]0B90.07F8::09/05/2007-07:07:01.871.00000094
$$begin_record
LogType: diagnostic
Severity: error
Text: Message was not sent because the connection was closed
SIP-Start-Line: MESSAGE sip:[email protected];opaque=user:epid:G-
AWNAmf8Vqf8tSG2CexVwAA;gruu SIP/2.0
SIP-Call-ID: 75e49e58a3777d0478d49aa524eda4c8
SIP-CSeq: 9 MESSAGE
Peer: sip.contoso.com:5061
$$end_record
The most likely cause of this problem is a firewall that is not correctly configured for SIP traffic, thereby causing it to drop connections when they are idle for 30 seconds. This process is typical of many firewalls and load balancers in which the default configuration assumes a protocol like HTTP rather than SIP.
—Conal Walsh
The Snooper utility is a tremendous advance for diagnostics when working with the Office Communications Server 2007 product suite and is available as part of Office Communications Server 2007 Resource Kit Tools. Unlike many tools, it has a complete reference manual that is available directly within the tool from the Help | Using Snooper menu. Snooper is capable of viewing logs from the current client and server components as well as Live Communications Server 2005 flat-file server logs. Snooper summarizes protocol messages, identifies diagnostic and connection-level events, and offers full content for any message that is selected. Snooper is also capable of querying the archiving server and other Structured Query Language (SQL) repositories to gather reports containing useful overview and detailed information. Snooper can be run remotely for pools, but Standard Edition servers might have connection errors when logging remotely. If this is the case, Snooper.exe should be run locally on the Standard Edition server.
Snooper enables searches and allows complex queries related to specific fields in the message. For example, if the user [email protected] is of interest but only for messages that were sent to [email protected], a search such as from:[email protected] to:[email protected] would get the protocol messages of interest. When each message is viewed in detail, the matching text in the protocol message is highlighted. A useful trick for director and access edge server logs is to specify a direction—whether the message is incoming (in) or outgoing (out)—to avoid seeing messages twice. Such a specification might be direction:in. Likewise, to see nonprotocol messages, specifying direction:none allows a view of just these messages (connection events, diagnostic notes, and so forth).
Snooper is also capable of building useful reports based on queries against the SQL repositories maintained by Office Communications Server 2007. The Reports menu offers this functionality, and the Error Analysis option allows an archiving server to be queried to gather error reports that have been logged. These records can be filtered by user or by attributes of the error messages and provide an insightful way for information technology (IT) support to identify problems that a user is experiencing without more information or logs from the users themselves. The ability to gather overview information for all errors or specific types of errors allows administrators to proactively look at the errors that have been occurring to predict and resolve problems before many users even end up encountering them. The Analyze Error Reports dialog box is shown in Figure 16-10.

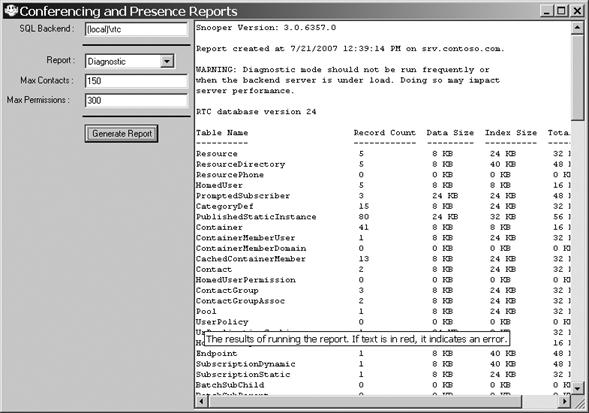
The Conferencing And Presence Reports option provides a variety of useful reports that have not been so easily available in the past. Information can be retrieved about users, conferences, MCUs, and diagnostic overview information for the repository. An example of a user query is shown in Figure 16-11. This report contains detailed information about the user, their rights, their contacts and groups, the rich presence information they are publishing, conferences they organized, and conferences to which they are invited.

The conference report shows the current settings as well as the current state of the conference that was queried. The schedule for the conference, the invitee list, the media types allowed in the conference, the active MCUs, the active participant list, and the state of each participant are all shown. This information can be helpful when monitoring a running conference or when diagnosing problems for users when they are connecting to or interacting in a conference.
The MCU Health report identifies all MCUs that are present on the server and provides detailed information about them. Their ID, media type, URL, heartbeat status, number of assigned conferences, and number of connected participants are all displayed. An example of this report is shown in Figure 16-12. Heartbeats to the MCU Factory should generally occur within 15 seconds, but the heartbeat to the Focus depends on the activity level of the MCU.

The Diagnostic report identifies overview information about many aspects of the repository in question, but focuses on stats for record counts as well as the size of the database on disk and how this space is allocated across internal records. An example of the report in Snooper is shown in Figure 16-13. The following data are presented in the log, with notes in parentheses to clarify or call out the usefulness of the information.
Database version (can highlight errors during the update process if the database wasn't updated)
Database internal statistics along with storage space utilized (helps during maintenance and in understanding what is taking up space if the database grows unreasonably)
List of tables in the database along with record count and data/index/total size counts
Database size and dynamic database size
Files that make up the database (.mdf and .ldf files) plus their sizes and growth
Server statistics (helps determine server load in terms of storage space and network activity)
Distribution of contacts across enterprise servers as well as the percentage of contacts that are outside of the enterprise
Number of active endpoints (Communicator clients or otherwise)
Maintenance, replication, and expiration tasks and the server on which they are scheduled to run
Number of users with no contacts or permissions (likely idle or have never logged in)
Presence statistics, all with min, max, average, and standard deviation (helps to get a feel for usage and how users compare with each other in terms of usage)
Contacts per user
Container member users per user
Container member domains per user
Cached container members per user
Permissions per user
Prompted subscribers per user
Static publications per user
User-bound publications per user
Time-bound publications per user
Endpoint-bound publications per user
Publication data size per user
Subscribers per user
Category subscriptions per user
Endpoints per user
Conferences per user
Overview of activity (quick view of current usage)
Number of unique users with endpoints
Number of conferences (total and currently active)
Note
Generating the Diagnostic Conferencing And Presence Report can create a large amount of load on database servers, so it should be done infrequently during high-activity intervals to prevent creating delays for users. This report effectively locks the database to get a snapshot report, which holds up all traffic on the servers that require a database query from this repository.
Overall, Snooper is a helpful resource for gathering information about the configuration and state of servers and users and is a useful tool for scanning logs that have been collected to analyze them. However, it is always good to start by reviewing the event logs and looking at the MMC overviews for each server because many times the problems have already been identified or will be mentioned. Forgetting to look for event log messages before starting an investigation can waste a great deal of time when the error has already been identified and highlighted to make things easier.