
PART 9: Software Trace Analysis Patterns
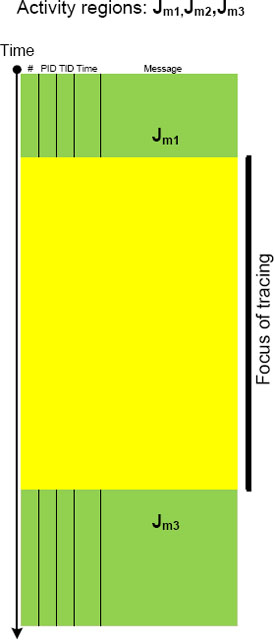
Focus of Tracing
Activity Region pattern (Volume 4, page 348) highlights “mechanical” and syntactical aspects of trace analysis whereas this pattern brings attention to changing semantics of trace message flow, for example, in Citrix terminal services environment, from logon messages during session initialization to LHC database search. Here is a graphical illustration of the pattern where tracing focus region spans 3 regions of activity:
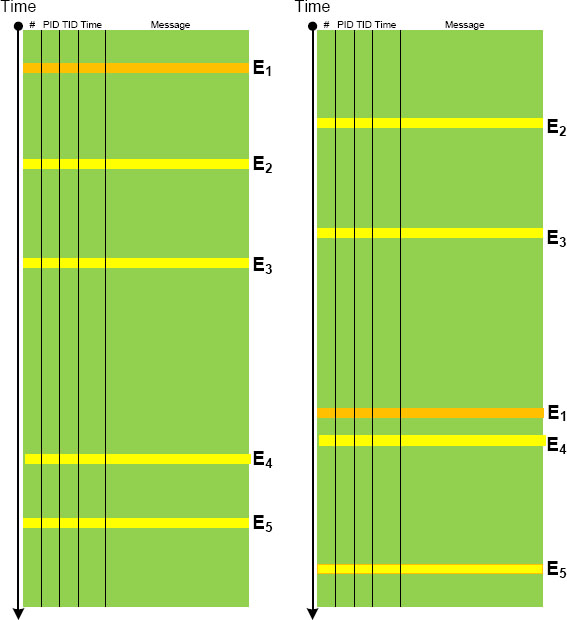
Event Sequence Order
In any system this pattern is expected as a precondition to its normal behavior. Any out-of-order events should raise the suspicion bar as they might result or lead to synchronization problems. It need not be a sequence of trace messages from different threads but also between processes, for example, image load events in CDF / ETW traces can indicate the wrong configuration of a service startup order. The following diagram depicts a possible pattern scenario:
Implementation Discourse
If we look at any non-trivial trace we would see different Implementation Discourses. Components are written in different languages and adhere to different runtime environments, binary models and interface frameworks. All these implementation variations influence the structure, syntax and semantics of trace messages. For example, .NET debugging traces differ from file system driver or COM debugging messages. Therefore we establish the new field of Software Trace Linguistics as a science of software trace languages. Some parallels can be drawn here towards software linguistics (the science of software languages) although we came to that conclusion independently while thinking about applying “ethnography of speaking” to software trace narration.
News Value
This is a pattern that assigns relative importance to software traces for problem solving purposes especially when it is related to problem description, recent incidents and timestamps of other supporting artifacts (memory dumps, other traces, etc.). For example, in one scenario, an ETW trace was provided with 3 additional log files:
#      Source  PID  TID  Date       Time         Message
0      Header  1260 1728 12/14/2010 06:48:56.289 ?????
[...]
215301 Unknown 640  808  12/14/2010 07:22:57.508 ????? Unknown( 16):
GUID=[...] (No Format Information found).

// LogA
05/11/10 18:28:15.1562 : Service() - entry
[...]
14/12/10 10:31:58.0381 : Notification: sleep
* Start of new log *
14/12/10 10:34:38.4687 : Service() - entry
[...]
14/12/10 11:53:35.2729 : Service.CleanUp complete
* Start of new log *
14/12/10 11:56:11.7031 : Service() - entry
[...]
14/12/10 15:25:23.3004 : Notification: sleep

// LogB
[ 1] 12/14 10:34:29:890  Entry: ctor
[...]
[ 2] 12/14 11:53:30:866 Exit: COMServer.Server.DeleteObject

// LogC
[ 1] 12/14 11:56:03:359  Entry: ctor
[...]
[20] 12/14 15:30:20:110 Exit: Kernel32.Buffer.Release
From the description of the problem we expected LogB and LogC to be logs from two subsequent process executions where the first launch fails (LogB) and the second launch succeeds (LogC). Looking at their start and end times we see that they make sense from the problem description perspective but we have to dismiss ETW trace and most of LogA as recorded earlier and having no value for Inter-Correlation (Volume 4, page 350) analysis of the more recent logs. We also see that portions of LogA overlap with LogB and LogC and therefore have analysis value for us.
Master Trace
When reading and analyzing software traces and logs we always compare them to Master Trace. Other names for this pattern borrowed from narrative theory include Meta-trace, Canonical Trace or Archetype. When looking at the software trace from a system we either know the correct sequence of Activity Regions (Volume 4, page 348), expect certain Background and Foreground Components (Volume 5, page 287), Event Sequence Order (page 244) or mentally construct a model based on our experience and Implementation Discourse (page 245). For the latter example software engineers internalize software master narratives when they construct code and write tracing code for supportability. For the former example it is important to have a repository of traces corresponding to master traces. This helps in finding deviations after Bifurcation Point (Volume 3, page 343). Consider such comparisons similar to regression testing when we check the computation output against the expected prerecorded sequence.
Gossip
This pattern has a funny name Gossip. We were thinking originally to call it Duplicated Message but gave it the new name allowing for the possibility of semantics of the same message to be distorted in subsequent trace messages from different adjoint threads82. Here is a typical ETW / CDF trace example (distortion free) of the same message content seen in different modules (some columns like Date and Time are omitted):
#      Module  PID  TID  Message
[...]
26875  ModuleA 2172 5284 LoadImageEvent:
ImageName(DeviceHarddiskVolume2WindowsSystem32
otepad.exe)
ProcessId(0x000000000000087C)
26876  ModuleB 2172 5284 LoadImageEvent:
ImageName(DeviceHarddiskVolume2WindowsSystem32
otepad.exe),
ProcessId(2172)
26877  ModuleC 2172 5284 ImageLoad: fileName=notepad.exe, pid:
000000000000087C
[...]
In such cases, when constructing event sequence order (page 244) it is recommended to choose messages from the one source instead of mixing events from different sources, for example:
#       Module  PID  TID Message
[...]
26875   ModuleA  2172 5284 LoadImageEvent:
ImageName(DeviceHarddiskVolume2WindowsSystem32
otepad.exe)
ProcessId(0×000000000000087C)
[...]
33132   ModuleA  4180 2130 LoadImageEvent:
ImageName(DeviceHarddiskVolume2WindowsSystem32calc.exe)
ProcessId(0×0000000000001054)
[...]
Impossible Trace
Sometimes, we look at a trace and say it's impossible. For example, this fragment shows that the function foo had been called:
#    Module  PID TID Message
[...]
1001 ModuleA 202 404 foo: start
1002 ModuleA 202 404 foo: end
[...]
However, if we look at the corresponding source code (PLOT, Volume 5, page 272) we would see that something is missing: the function bar must have been called with its own set of trace messages we don't see in the trace:
void foo()
{
    TRACE(“foo: start”);
	bar();
    TRACE(“foo: end”);
}

void bar()
{
    TRACE(“bar: start”);
	// some code ...
    TRACE(“bar: end”);
}
We suspect the runtime code being modified, perhaps by patching. In other cases of missing messages we can also suspect thrown exceptions or local buffer overflows that led to wrong return address skipping the code with expected tracing statements. The mismatch between the trace and the source code we are looking at is also possible if the old source code didn't have BAR function called.
Glued Activity
Adjoint Thread (Volume 5, page 283) invariants like PID can be reused giving rise to curious CDF (ETW) traces where two separate execution entities are glued together in one trace. For example, in one trace we see AppA and AppB sharing the same PID:
#      Module  PID  TID  Time     Message
[...]
242583 ProcMon 5492 9476 11:04:33 LoadImageEvent for ImageName: ...AppA.exe PID: 5492
256222 ProcMon 5492 9476 11:04:50 ProcessDestroyEvent for PPID: 12168 PID:   5492
274887 ProcMon 5492 1288 11:05:18 LoadImageEvent for ImageName: ...AppB.exe PID: 5492
[...]
Other similar examples might include different instances of components sharing the same name, source code or even, in general, periodic tracing sessions appended to the end of the same trace file although we are thinking that the latter should be a separate pattern. We named this pattern Glued Activity by an analogy of different thread strings glued together (in general, manifiolds83 glued along their boundaries). Another name might be along the line of adjoint thread ID reuse (ATID Reuse).
Message Invariant
Most of the time software trace messages coming from the same source code fragment (PLOT, Volume 5, page 235) contain invariant parts such as function and variable names, descriptions, and mutable parts such as pointer values and error codes. Message Invariant is a pattern useful for comparative analysis of several trace files where we are interested in message differences. For example, in one troubleshooting scenario certain objects were not created correctly for one user. We suspected a different object version was linked to a user profile. Separate application debug traces were recorded for each user and we could see the version 0×4 for a problem user and 0×5 for all other normal users:
#     Module  PID  TID  Message
[...]
2782  ModuleA 2124 5648 CreateObject: pObject 0×00A83D30 data ([...]) version 0×4
[...]

#     Module  PID  TID  Message
[...]
4793  ModuleA 2376 8480 CreateObject: pObject 0×00BA4E20 data ([...]) version 0×5
[...]
UI Message
This pattern is very useful for troubleshooting system-wide issues because we can map visual behavior to various activity regions (Volume 4, page 348) and consider such messages as significant events (Volume 5, page 281).
#    Module  PID  TID  Time         Message
[...]
2782 ModuleA 2124 5648 10:58:03.356 CreateWindow: Title “...” Class “...”
[...]
3512 ModuleA 2124 5648 10:58:08.154 Menu command: Save Data
[...]
3583 ModuleA 2124 5648 10:58:08.155 CreateWindow: Title “Save As” Class “Dialog”
[... Data update and replication related messages ...]
4483 ModuleA 2124 5648 10:58:12.342 DestroyWindow: Title “Save As” Class “Dialog”
[...]
By filtering the emitting module we can create an adjoint thread (Volume 5, page 283):
#    Module  PID  TID  Time         Message
[...]
2782 ModuleA 2124 5648 10:58:03.356 CreateWindow: Title “...” Class “...”
3512 ModuleA 2124 5648 10:58:08.154 Menu command: Save Data
3583 ModuleA 2124 5648 10:58:08.155 CreateWindow: Title “Save As” Class “Dialog”
4483 ModuleA 2124 5648 10:58:12.342 DestroyWindow: Title “Save As” Class “Dialog”
[...]
Original Message
This pattern deals with software trace messages where certain activity is repeated several times but the only the first message occurrence or specific message vocabulary has significance for analysis activity. Typical example from CDF/ETW tracing is module load events:
#     Module  PID   TID   Time         Message
[...]
35835 ModuleA 11000 11640 17:27:28.720 LoadImageEvent:
DeviceHarddiskVolume2WindowsSystem32userinit.exe PId 5208
[...]
37684 ModuleA 12332 9576 17:27:29.063 LoadImageEvent:
WindowsSystem32userinit.exe PId 573C
[...]
37687 ModuleA 12332 9576 17:27:29.064 LoadImageEvent:
WindowsSystem32userinit.exe PId 573C
[...]
What we are looking here is for message invariant (page 251) like “.exe” but interested in the occurrence of specific path structures like DeviceHarddiskVolume because in our troubleshooting context they signify process launch sequence during terminal session initialization.