Chapter 18
Client Health
Maintaining healthy Configuration Manager clients is critical for delivering Configuration Manager services and meeting required service-level agreements. When clients in the environment are not healthy, the accuracy and dependability of Configuration Manager services are degraded, resulting in systems that are either completely or partially unmanaged.
Client health has been a challenge historically with Configuration Manager, and many tools or processes have been developed to help identify and repair broken clients. The most recent offering from Microsoft was the Client Status Reporting tool, which arrived in Configuration Manager 2007 R2. While good, many of these tools fall short in that client health problems must be managed manually, and automatic remediation is not generally part of the process. Configuration Manager 2012 changes the game in a dramatic way by not only detecting health problems through a thorough set of diagnostics but automatically remediating the problems as well. Before continuing, we must point out that no solution is 100 percent effective, and there will be problems that can’t be resolved automatically. However, the majority of client problems that happen now are anticipated to be those that happen because of external issues not related to Configuration Manager specifically. The inclusion of client health evaluation/remediation by default in Configuration Manager 2012 will significantly enhance the stability of deployments. While this solution won’t address every potential issue, it goes a long way to reducing administrator workload in keeping systems active and healthy.
This chapter details the client health mechanism in Configuration Manager 2012. In this chapter you will learn to
- Detail client health evaluations in Configuration Manager 2012.
- Review client health results in the Configuration Manager console.
Understanding the Client Health Mechanism
Managing client health issues involves detecting potential issues and fixing problems as they arise. Configuration Manager clients can become unhealthy for any number of reasons, often because of external issues such as WMI failure, DCOM permissions, service failures, and more. Configuration Manager 2012 introduces an automated mechanism to detect the most common client health issues and automates the process of fixing the problem. While this mechanism will go a long way toward helping maintain healthy clients, there will likely still be situations where manual intervention is required, but those situations should be greatly minimized.
Any tool to effectively validate and potentially repair client health issues, by definition, must be able to execute independently without relying on a healthy client to operate. Further, such a tool must execute locally to mitigate any potential network issues. The client health tool in Configuration Manager 2012 addresses this requirement nicely by running as a scheduled task—set apart from the client itself. The next section reviews the elements of this scheduled task for implementing the client health scanning.
Scheduled Task
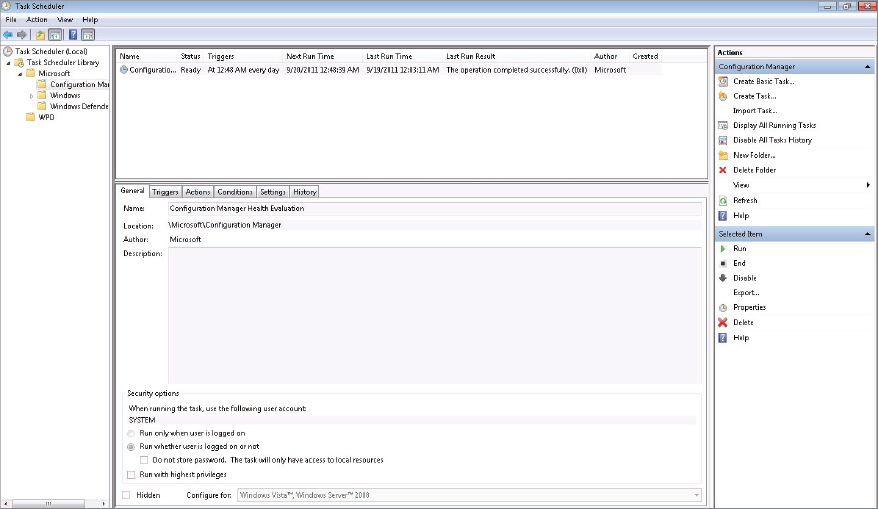
The client health tool in Configuration Manager 2012 operates as a scheduled task. The required scheduled task is automatically created when the Configuration Manager 2012 client is installed and set to run daily or a bit past midnight. Figure 18.1 shows the scheduled task created on a client system.
Figure 18.1 Scheduled task created by a client installation
Differences between Platforms
All platforms supported for use with the Configuration Manager client also support the client health scheduled task, but there are differences in the way various configurations may appear between platforms. The example discussion focuses on a Windows 7 workstation.
The overview of the scheduled task shown in Figure 18.1 provides helpful information, including the last run time and next run time for the task and whether the task was successful.
Client Health vs. Problem-Free Execution
A successful task doesn’t necessarily mean that the Configuration Manager client is healthy; it simply means that the client evaluation tool was able to execute without encountering a problem.
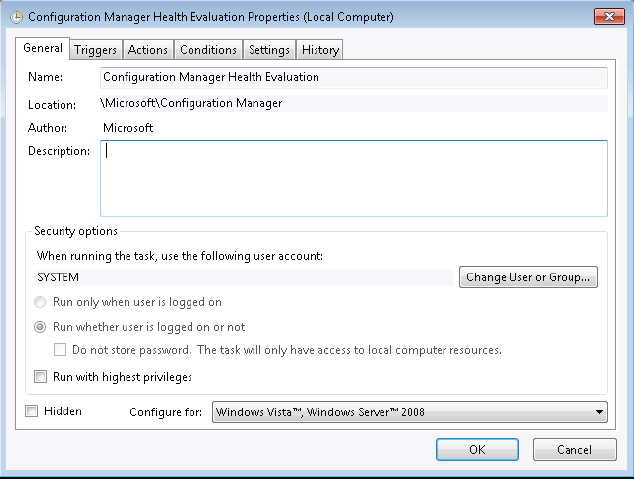
Notice that this view also provides various tabs that allow you to view the underlying configuration for the scheduled task. In order to make any changes to the task, you must select the properties for the task, which will present the same information but in an editable format, as shown in Figure 18.2 and described in the following sections.
Figure 18.2 Properties window for the scheduled task
Triggers Tab
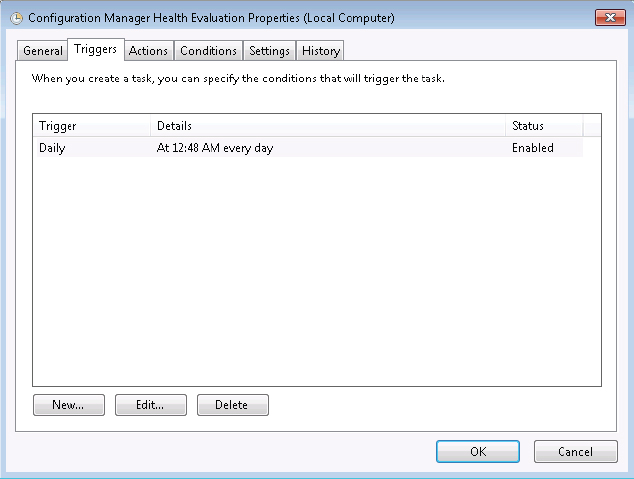
The Triggers tab of the scheduled task shown in Figure 18.3 is the place where you might adjust the run schedule for the scheduled task. The default setting is that this task should be run just after midnight. If Configuration Manager client systems are not powered on and able to run the task on schedule, it might be helpful to change the default schedule to something that matches when systems are anticipated to be running in the environment. Before making the change, though, it is also worth considering the power management options available in Configuration Manager that allow you to wake up systems at a scheduled time to handle any pending tasks.
Figure 18.3 Triggers tab for the scheduled task
Actions Tab
The Actions tab of the scheduled task, shown in Figure 18.4, shows the command line that is to be executed when the scheduled task runs. As you can see from the figure, the task executes CCMEval.exe, which is in the WindowsCCM directory. We’ll discuss CCMEval in more detail shortly. No command-line parameters are needed for this executable.
Figure 18.4 Actions tab for the scheduled task

Conditions Tab
The Conditions tab, shown in Figure 18.5, allows administrators to specify specific conditions that must be met before starting the task. There are no conditions set on this tab by default.
Figure 18.5 Conditions tab for the scheduled task

Settings Tab
The Settings tab, shown in Figure 18.6, specifies various settings for the task. The default values configured are as follows:
Figure 18.6 Settings tab for the scheduled task

Allow Task To Be Run On Demand This setting specifies that the task can be started by administrators as needed, such as in troubleshooting scenarios, outside the scheduled start time.
Run Task As Soon As Possible After A Scheduled Start Is Missed This setting specifies the run behavior for the task if the system isn’t able to run it on the defined schedule. As an example, if the system is powered off overnight and cannot run the task at the assigned time, then the task will be initiated the next time the system is started. The CCMEval process is lightweight but in this scenario is just one more thing for a system to do during startup, a process already loaded with significant activity. To avoid additional system load during startup caused by running this task, it may be worth considering rescheduling the start time for the task so that it takes place when the system is anticipated to be available.
Stop The Task If It Runs Longer Than This setting ensures that a hung task doesn’t continue to run long term. The default setting for this is 3 days, and it’s unlikely that the CCMEval task will run into issues causing the process to hang. Having this set as a failsafe, though, is a good idea.
If The Running Task Does Not End When Requested, Force It To Stop This setting works with the previous setting and will force the CCMEval thread to terminate if it remains in a hung state even after termination is requested.
The last setting, Do Not Start A New Instance, prevents multiple instances of CCMEval from spinning up.
History Tab
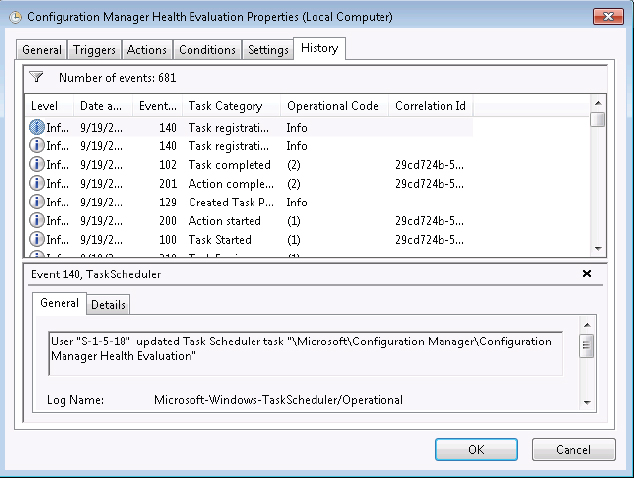
The History tab, shown in Figure 18.7, allows administrators to review the execution history for the task. There are no configurable settings on this tab.
Figure 18.7 History tab for the scheduled task
CCMEval Process
The task to execute CCMEval runs on a daily schedule by default. It is fully possible to change this schedule, but it’s not recommended. If needed, the task can be run manually for troubleshooting or other purposes, as previously alluded to.
With the understanding that client health checking and remediation for Configuration Manager 2012 clients is handled by CCMEval, it’s natural to wonder what this process actually does. That’s the next part of the discussion.
CCMEval is an executable that exists in the WindowsCCM folder on all Configuration Manager 2012 clients, as shown in Figure 18.8.
Figure 18.8 CCMEval executable in the WindowsCCM folder
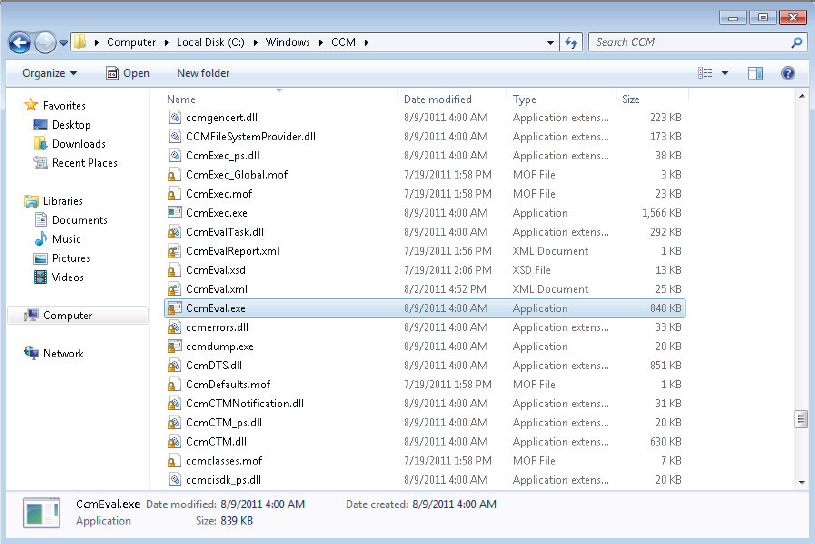
Note that in addition to CCMEval.exe there are also CCMEval.xml, CCMEval.xsd, CCMEvalReports.xml, and CCMEval.log. These are support files for the CCMEval process and are used as follows:
CCMEval.exe This is the executable file used to drive the health evaluation and remediation process on Configuration Manager 2012 clients.
CCMEval.xml This is the control file that defines the tests and remediation actions that will be taken as a result of test conditions. This file will be discussed in some detail shortly.
CCMEval.xsd This file defines the schema used to validate client health evaluation and report data.
CCMEvalReports.xml This is a header file used for building reporting information forwarded to Configuration Manager 2012 servers.
CCMEval.dll This is a library file for use with CCMEval.exe.
CCMEval.log This file records the progress of health check and remediation activities and is located in the WindowsCCMlogs folder.
Understanding the health check and remediation mechanism provided by CCMEval requires reviewing the work that is done during a CCMEval cycle along with the various checks that are performed. You can mine this information by reviewing CCMEval.xml along with CCMEval.log, and it will help you understand what is happening behind the scenes. Table 18.1 lists the checks and potential remediation outcomes that take place when problems are found during evaluation.
Table 18.1: CCMEval evaluation tasks and potential remediation actions
| Evaluation Task | Potential Remediation Action |
| Verify WMI service exists | No remediation |
| Verify/Remediate WMI service startup type | Reset service startup to Automatic |
| Verify/Remediate WMI service status | Reset service status to Running |
| WMI Repository Integrity Test | Reinstall Configuration Manager client |
| WMI Repository Read/Write Test | Reset WMI repository and reinstall Configuration Manager client |
| Verify BITS exists | No remediation |
| Verify/Remediate BITS startup type | Reset service startup to Automatic |
| Verify/Remediate client and client prerequisite installation | Install ConfigMgr prerequisites |
| Verify SMS Agent Host service exists | No remediation |
| Verify/Remediate SMS Agent Host service startup type | Reset service startup to Automatic |
| Evaluation Task | Potential Remediation Action |
| Verify/Remediate SMS Agent Host Service | Reset service status to Active |
| Restart SMS Agent Host Service | |
| Verify/Remediate Lantern service startup type (Lantern = Microsoft policy platform processor service) | Reset service status to Manual |
| Verify/Remediate Antimalware service startup type | Reset service startup type to Manual |
| Verify/Remediate Antimalware service status | Reset service status to Running |
| Verify/Remediate Inspection service startup type | Reset service startup type to Manual if installed |
| Verify/Remediate Windows Update service startup type | Reset service startup type to Automatic |
| Verify/Remediate Windows Update Service status | Reset service status to Active |
| Verify/Remediate Configuration Manager Remote Control service | Reset service startup type to Automatic |
| Verify/Remediate Configuration Manager Remote Control service status | Reset service status to Active |
| Verify/Remdiate SQL CDE database health | Validate CCMStore.sdf |
Figure 18.9 is a portion of the CCMEval.xml file that contains the rules that are used during the client health/remediation evaluation cycle.
Figure 18.9 CCMEval.xml example
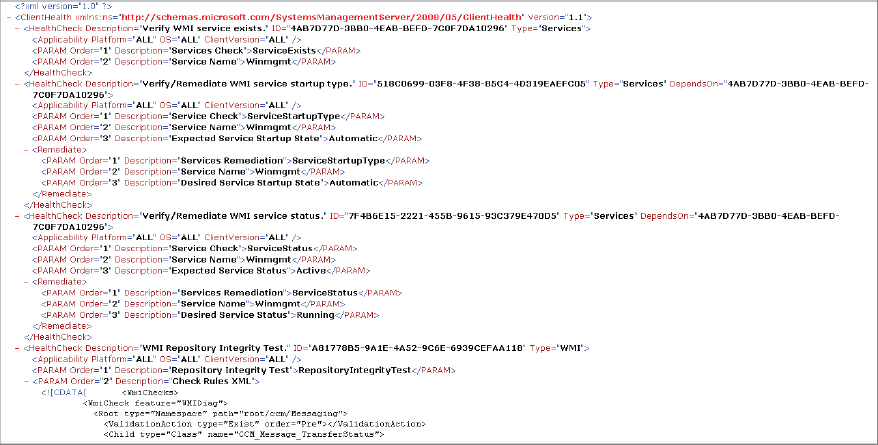
Figure 18.10 is an example of the CCMEval.log file after an evaluation cycle is complete. Experienced administrators may notice that after the health-checking cycle is complete, the report is sent back to the site in the form of a state message. We mentioned earlier that an effective client health tool must function independently and not rely on a client function for any of its operation. State messages are commonly sent by the Configuration Manager client, so you might question whether the health evaluation tools simply offload the resulting state report to the client or handle it independently. The latter is true; client health forwards the state message directly to the clients management point using its own mechanism. This is also noted in the log snip below.
Figure 18.10 CCMEval.log sample

CCMEval—Customizable? Portable?
After taking a peek at the CCMEval.xml and CCMEval.log files, a common question to ask is whether customers are able to customize or add to these checks. Unfortunately, changes to these files are not supported, so if any modifications are attempted, they are solely at the risk of the administrator and may cause problems. Remember, the contents of this file impacts every Configuration Manager client in the organization.
Another question that commonly follows is whether it’s possible to port the CCMEval process to work on earlier versions of Configuration Manager clients. No. CCMEval is solely for use on Configuration Manager 2012 client systems.
Client Health Evaluation: Results
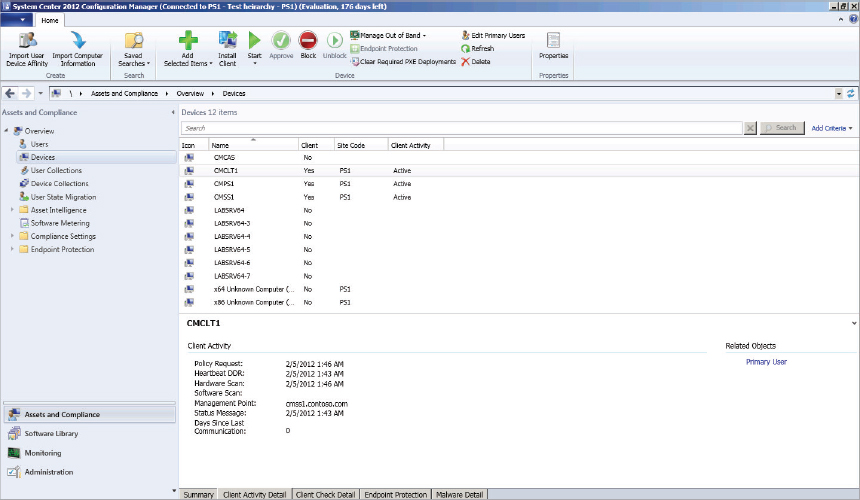
Client health evaluation results are accessible in the Configuration Manager console in several areas. First, client health is reported on a device level by reviewing collection membership. Any collection in which the device is a member will provide the same health information. To view health results for a device, simply select it in the console, and the bottom of the screen will reveal five tabs: Summary, Client Activity Detail, Client Check Detail, Endpoint Protection, and Malware Detail. All of these tabs contain useful health information but for client health evaluation the first three are the main ones to review.
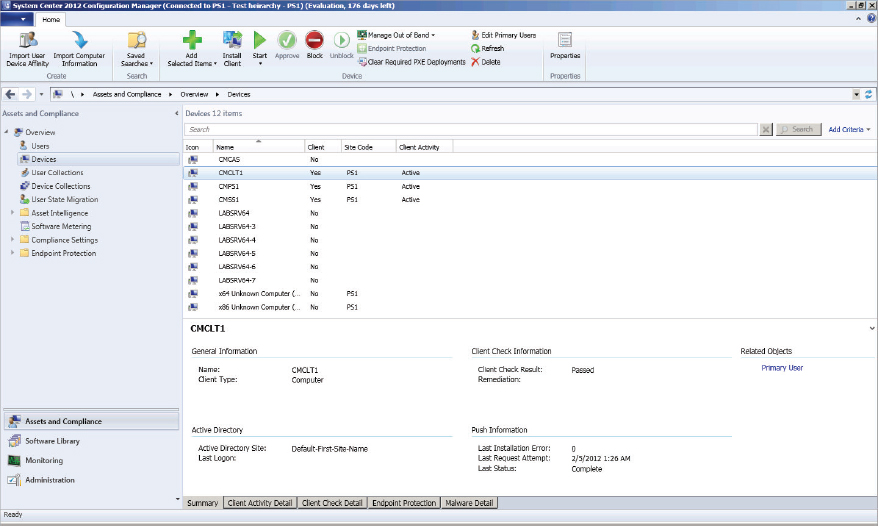
Summary The Summary tab, shown in Figure 18.11, reports the latest client health information as Pass or Fail and also reports whether the last remediation attempt was successful.
Figure 18.11 Summary tab for specific device
Client Activity Detail The Client Activity Detail tab, shown in Figure 18.12, reports the last time the client requested policy, sent a heartbeat, reported hardware or software inventory, and sent a status message. The Days Since Last Communication field reflects how long the site has gone without hearing from the client. All of this information taken together gives a good idea about client health, but it’s important to also factor in systems that may be powered are off for extended periods or are offline because of network or other issues. The Last Management Point field documents the last management point in use by the client. This information can help identify potential issues with boundaries, roaming, and the like.
Figure 18.12 Client Activity Detail tab for specific device
Client Health Detail The Client Health Detail tab, shown in Figure 18.13, provides summary information about the device’s last health evaluation scan. The specific evaluation rules and remediation status are reflected in the summary.
Figure 18.13 Client Health Detail tab for specific device

Monitoring: Client Health
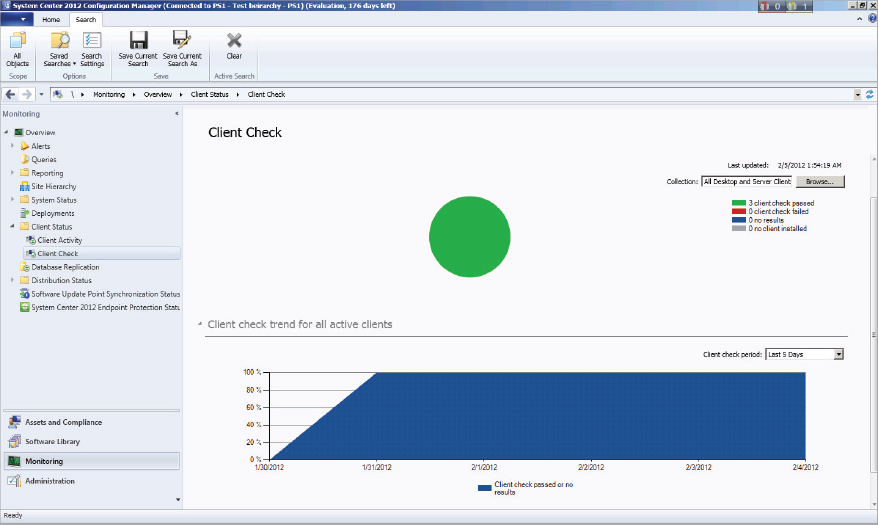
The Monitoring workspace of the Configuration Manager console is the place to view Client Health and Client Activity information summarized for all clients in the hierarchy. This information is located under the Client Status node.
The Client Health node shown in Figure 18.14 shows a collective view of client health in the hierarchy. The number of devices that have passed or failed or are in an unknown status for health evaluation are reflected in a pie chart, and the accompanying bar chart details issues that have been found for those systems failing health evaluation. There is also a line graph showing trending information for client health. For more detail simply click the section of interest from the pie chart, the pie chart legend, or the bar chart, which will open a view of all devices in the selected category.
Figure 18.14 Client Health node in the Monitoring workspace of the Configuration Manager console
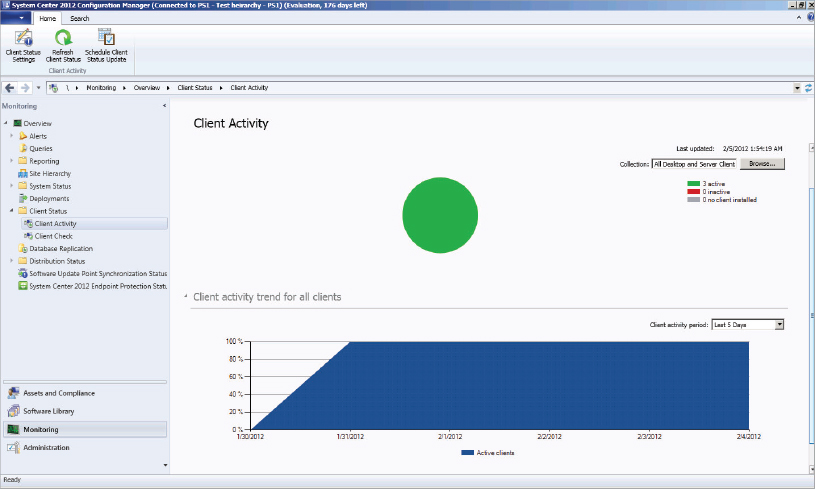
Monitoring: Client Activity The Client Activity node shown in Figure 18.15 shows a collective view of client activity in the hierarchy. Device are represented in a pie chart as either active or inactive. In the example, all clients are active. Having 100 percent active clients would be a great result in a production environment but likely will not often be achieved because of environmental issues, systems being powered off for extended periods, network issues, and the like. This view also provides a line chart for trend analysis. To view specific systems that are in an active or inactive state, simply click the area of the pie chart or pie chart legend of interest to drill down for additional detail.
Figure 18.15 Client Activity node in the Monitoring workspace of the Configuration Manager console
Reporting: Client Health Configuration Manager 2012 provides a wealth of information through the reports available in the console. Reports are grouped by category and, as shown in Figure 18.16, there are five reports specifically geared to client health information. Combining the reports with the ability to create report subscriptions, as detailed in Chapter 12, “Reporting,” gives administrators significant flexibility to pick reports that best serve their needs and render or deliver automatically.
Figure 18.16 Client health reports

Detail client health evaluations in Configuration Manager 2012. Health evaluations and remediations take place daily on every Configuration Manager 2012 client in the hierarchy. This information is updated at the site and is available for review on every client and also summarized for every client across the hierarchy.
Master It List the health evaluations and remediations that take place on Configuration Manager clients.
Review client health results in the Configuration Manager console. Client health data is available in several locations of the console to allow access to health for individual devices and summarized data for all clients in the hierarchy.
Master It List the locations in the console where individual client health and summarized client health data are accessible.