By now, you are probably eager to start applying machine learning to your own projects—you may have even already done so. If you have attempted a project on your own, you likely found that, the task of turning data into action is more difficult than this book made it appear.
As you attempted to gather data, you might have realized that the information was trapped in a proprietary spreadsheet format or spread across pages on the Web. Making matters worse, after spending hours manually reformatting the data, perhaps your computer slowed to a crawl after running out of memory. Perhaps R even crashed or froze your machine. Hopefully you were undeterred; it does get easier with time.
This chapter covers techniques that may not apply to every machine learning project, but could prove useful for certain types of work. You might find the information particularly useful if you tend to work with data that are:
- Stored in unstructured or proprietary formats such as web pages, web APIs, or spreadsheets
- From a domain such as bioinformatics or social network analysis, which presents additional challenges
- So extremely large that R cannot store the dataset in memory or machine learning takes a very long time to complete
You're not alone if you suffer from any of these problems. Although there is no panacea—these issues are the bane of the data scientist as well as the reason for data skills to be in high demand—through the dedicated efforts of the R community, a number of R packages provide a head start toward solving the problem.
This chapter provides a cookbook of such solutions. Even if you are an experienced R veteran, you may discover a package that simplifies your workflow, or perhaps one day you will author a package that makes work easier for everybody else!
Unlike the analyses in this book, real-world data are rarely packaged in a simple CSV form that can be downloaded from a website. Instead, significant effort is needed to prepare data for analysis. Data must be collected, merged, sorted, filtered, or reformatted to meet the requirements of the learning algorithm. This process is known informally as data munging. Munging has become even more important as the size of typical datasets has grown from megabytes to gigabytes and data are gathered from unrelated and messy sources, many of which are domain-specific. Several packages and resources for working with specialized or domain-specific data are listed in the following sections.
The RCurl package by Duncan Temple Lang provides an R interface to the curl (client for URLs) utility, a command-line tool for transferring data over networks. The curl utility is useful for web scraping, which refers to the practice of harvesting data from websites and transforming it into a structured form.
Note
Documentation for the RCurl package can be found on the Web at http://www.omegahat.org/RCurl/.
After installing the RCurl package, downloading a page is as simple as typing:
> library(RCurl)
> webpage <- getURL("http://www.packtpub.com/")
This will save the full text of the Packt Publishing's homepage (including all web markup) into the R character object named webpage. As shown in the following lines, this is not very useful as-is:
> str(webpage)
 chr "<!DOCTYPE html>
<html xmlns="http://www.w3.org/1999/xhtml" lang="en" xml:lang="en" >
<head>
    <title>Home | Packt Pu"| __truncated__
Because most websites use web-specific formats such as XML/HTML and JSON, the web data must be processed before it is useful in R. Two functions for doing so are discussed in the following sections.
XML is a plaintext, human-readable, but structured markup language upon which many document formats have been based. In particular, many web-based documents utilize XML formatting. The XML package by Duncan Temple
Lang provides a suite of functionality based on the popular C-based libxml2 parser for reading and writing XML documents. Combined with the Rcurl package (noted previously), it is possible to download and process documents directly from the web.
Note
More information on the XML package, including simple examples to get you started quickly, can be found at the project's website: http://www.omegahat.org/RSXML/.
The rjson package by Alex Couture-Beil can be used to read and write files in the JavaScript Object Notation (JSON) format. JSON is a standard, plaintext format, most often used for data structures and objects on the Web. The format has become popular recently due to its utility in creating web applications, but despite the name, it is not limited to web browsers.
Note
For details about the JSON format, go to http://www.json.org/.
The JSON format stores objects in plain text strings. After installing the rjson package, to convert from JSON to R:
> library(rjson)
> r_object <- fromJSON(json_string)
To convert from an R object to a JSON object:
> json_string <- toJSON(r_object)
Used with the Rcurl package (noted previously), it is possible to write R programs that utilize JSON data directly from many online data stores.
The xlsx package by Adrian A. Dragulescu offers functions to read and write to spreadsheets in the Excel 2007 (or earlier) format—a common task in many business environments. The package is based on the Apache POI Java API for working with Microsoft's documents.
Note
For more information on xlsx, including a quick start document, go to https://code.google.com/p/rexcel/.
Data analysis in the field of bioinformatics offers a number of challenges relative to other fields due to the unique nature of genetic data. The use of DNA and protein microarrays has resulted in datasets that are often much wider than they are long (that is, they have more features than examples). This creates problems when attempting to apply conventional visualizations, statistical tests, and machine learning-methods to such data.
Note
A CRAN task view for statistical genetics/bioinformatics is available at http://cran.r-project.org/web/views/Genetics.html.
The Bioconductor project (http://www.bioconductor.org/) of the Fred Hutchinson Cancer Research Center in Seattle, Washington, provides a centralized hub for methods of analyzing genomic data. Using R as its foundation, Bioconductor adds packages and documentation specific to the field of bioinformatics.
Bioconductor provides workflows for analyzing microarray data from common platforms such as for analysis of microarray platforms, including Affymetrix, Illumina, Nimblegen, and Agilent. Additional functionality includes sequence annotation, multiple testing procedures, specialized visualizations, and many other functions.
Social network data and graph data present many challenges. These data record connections, or links, between people or objects. With N people, an N by N matrix of links is possible, which creates tremendous complexity as the number of people grows. The network is then analyzed using statistical measures and visualizations to search for meaningful patterns of relationships.
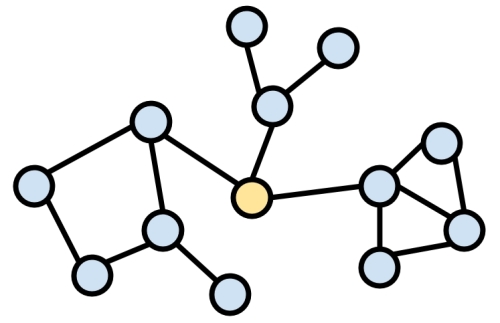
The network package by Carter T. Butts, David Hunter, and Mark S. Handcock offers a specialized data structure for working with such networks. A closely-related package, sna, allows analysis and visualization of the network objects.
Note
For more information on network and sna, refer to the project website hosted by the University of Washington: http://www.statnet.org/.