
8 Driving logs with Docker and Kubernetes
- Setting Docker to use Fluentd as its log driver
- Understanding components used for Kubernetes logging
- Tailoring Kubernetes DaemonSets for Fluentd
- Configuring Fluentd to collect Kubernetes component log events
- Discovering how Kubernetes node monitoring works
Previous chapters have referred to Fluentd’s relationship with Docker and Kubernetes, but we have focused on running Fluentd independently of these technologies to minimize complexity. This has helped underpin the point that despite the association with CNCF, Fluentd certainly is not restricted to cloud-native use cases.
In this chapter, we will now look at how Fluentd can be used with Docker and Kubernetes. We should recognize that the more advanced configuration of Docker and Kubernetes is not trivial; both technologies deserve and have many dedicated books. We can view the different technologies as layers of a “cake” that form a cloud-native microservice development platform—each layer adding increased sophistication, abstraction, and scaling. Typically, each layer assumes an understanding of the one preceding it. Operating systems provide a bedrock on which containers provide the first layer, commonly through Docker. The next layer is container orchestration—Kubernetes for us (but others, such as Mesos and OpenShift, exist). A further layer could be added to provide a service mesh like Istio or Linkerd. However, as they bring another layer of components from telemetry to mutual TLS, we’ve opted not to address this.
However, we want to look at a small slice through these layers to understand how logging fits into each technology layer in turn. To get this perspective, we will assume that you have a basic conceptual appreciation of Docker and Kubernetes. The explanations of Docker and Kubernetes will only be at a high level as we aim to provide insight into how Fluentd and the prebuilt solutions support logging can be applied. We’ll keep the setup and illustration of the different points as minimalist as possible, so the approaches and considerations don’t need a deep hands-on experience of every layer. By the end of the chapter, you will have grasped the ideas and seen how to deploy Fluentd to work with Docker and Kubernetes. If you’d like to know more about these technologies, appendix E provides recommendations for additional book resources.
8.1 Fluentd out of the box from Docker Hub
The previous chapter illustrated a range of deployment configurations, including patterns applicable in a Kubernetes environment. These use cases can be addressed directly using predefined containers provided by Fluentd and others and published in the central Docker Hub repository (https://hub.docker.com/r/fluent/fluentd/). The container has been configured so that it is possible to pass a location to write output log files—this allows appropriate mount points to be used and allows the logs to be accessed from outside of the container, avoiding the issue of losing logs when a container terminates. In addition to the location for log files, we can also pass in our own custom Fluentd configuration if the default is insufficient. The default settings include the following:
-
Port 24224 is used for receiving logs using the forward plugin.
-
Logs tagged with
Docker.**are written to/fluentd/log/docker.log.
8.1.1 Official Docker images
The Fluentd has a single official image, according to Docker Hub. The official image means we can be assured the image is being maintained and can be found at https://hub.docker.com/_/fluentd (you will need at least a free Docker Hub account to access this). This isn’t the only Fluentd-provided Docker image available, but the other images don’t come with the same assurances. Other than the official image, the other image of particular interest is the DaemonSet, which was first referenced in chapter 2. The DaemonSet, as you may recall, provides the means to ensure each Kubernetes worker node (host machine) runs a pod that provides foundation services, such as logging and monitoring of infrastructure health. The Docker files are available in the Fluentd GitHub repository if you want to use them as a starting point.
If you search the Docker Hub for Fluentd, you will find hundreds of entries. This is because many organizations (including many vendors who want to make it easy for you to send log events to their product) use Fluentd and have their own image configurations. It is worth keeping in mind that the official Docker images only include the core plugins. To use your custom or community-contributed plugins, the Docker image needs to be modified to retrieve that plugin and install it, along with any dependencies. It is worth considering where the Docker image you elect to use has originated. Doing so will enable us to track whether the image provider maintains the image with the latest patches and releases to the OS and software, including Fluentd in the image.
8.1.2 Docker log drivers
The purpose of the log drivers is to capture the output streams for stdin, stdout, and stderr (i.e., the content you would expect to see on a console) and direct them to a suitable destination; otherwise, this information will “disappear into the ether.” Docker supplies, out of the box, several bundled log drivers covering
-
Fluentd—Communicates with the Fluentd forward endpoint, which must be on the host machine.
-
JSON file—The default setting; stores events in a file using JSON format.
-
local—A file-based storage custom to Docker and optimized for its operations.
-
journald—A daemon service that uses the same API as Syslog but produces a more structured file. This comes with systemd which provides a range of OS services beyond the Linux core (http://mng.bz/XWZ6).
-
GELF—Graylog Extended Log Format; a format adopted by several logging frameworks such as Graylog and Logstash (https://docs.graylog.org/en/4.0/pages/gelf.html).
-
ETW logs—Windows log events (http://mng.bz/y4vq).
-
Google Cloud Platform, AWS CloudWatch, Rapid7, Splunk—Some of the vendors and platforms that have provided log drivers to their services.
In addition to these Docker-shipped log drivers, you can also build your own. But unless you want to tightly couple Docker logging to a product or platform, there are plenty of options without resorting to development.
8.1.3 Getting set up for Docker log drivers
To use Fluentd log drivers, we will need to get Docker installed (as well as Kubernetes for later parts of this chapter). As these technologies have significant differences between Windows and Linux, we will adjust our approach to accommodate both platforms (a practice that recognizes many people who work from a Windows machine but often work with Linux in production). Microsoft and Docker have made several significant advancements that allow Linux containers to run on Windows servers. This is through using the Windows Linux Subsystem(WSL), but this isn’t available on all versions of Windows OSes (but if you have the means to use WSL, it is a great way forward). For this chapter, we will focus on just Linux containers. This means working with WSL, Hyper-V' or VirtualBox for Windows users. In appendix A, we have provided the resources to help you get set up.
8.2 Using Docker log drivers
Docker provides the means to control what happens to logs. By default, Docker uses a JSON log driver that writes to stdout and stderr (i.e., our console unless you’ve overridden the routing of these outputs in your environment). There are two ways to control the log driver, either with additional parameters in the Docker run command or by modifying the Docker configuration. The difference is that the command-line approach means you can use alternative configurations for specific Docker containers. The downside of the command-line approach is the parameters need to be provided every time.
8.2.1 Docker drivers via the command line
For our first use of log drivers, we’re going to use the command-line approach. It is the least invasive approach to tailoring log driver behavior; therefore, experimenting with configuration controls involves the least disruptive change.
We’ll continue to run a configuration of Fluentd on our host computer to receive and output log events. First, we will run the Hello-World Docker image from within the Linux VM (virtual machine) established using the guidance in appendix A. If your host operating system is Linux, this may seem a little perverse, but this approach has the following benefits:
-
Clear separation of network layers, as the virtualization layer will provide a separate network layer besides the network abstractions from the Docker layer.
-
Keeps the number of VMs needed down and the resource overhead that virtualization creates.
-
The outcomes will be the same regardless of the host operating system. This can be particularly beneficial if your host is Windows, as it helps to emphasize that Fluentd is platform-agnostic.
Personally, this is going to be done using my Windows 10 Pro host running Hyper-V with an Ubuntu 18 LTS VM. This means we will be using Ubuntu to run Docker containers. We can visualize the deployment as shown in figure 8.1.

Figure 8.1 The layers of the operating system and virtualization and containerization being used to ensure our host environment isn’t disturbed with just Docker
8.2.2 A quick check of network connections
Getting network configurations correct is a significant consideration for using Docker, Kubernetes, and virtual machines. This means it is always worth doing quick and easy checks to ensure the network connectivity works as expected, such as using curl or Postman to send HTTP log events to Fluentd. To help with this and use the Fluentd log driver, we have prepared a simple Fluentd configuration to send anything received to stdout. We can start Fluentd just as we have many times before using the command
Once Fluentd is running from the Linux environment, we can execute a variation on our “Hello World” test used in chapter 2. In the following configurations and commands, we need to replace w.x.y.z with the host computer’s IP, as seen by the Linux guest. You can get the IPs of a machine with the command ipconfig on Windows and ip addr show on Linux hosts (ifconfig may also work but is deprecated). Our test command on the Linux VM or container has to be
This should result in the JSON details {"foo":"bar"} being displayed on the console where Fluentd is running on the host.
8.2.3 Running Docker command line
Having set and checked our deployment, particularly networking, we can move on to using the Docker daemon. Rather than build our own Docker image, we will retrieve a traditional “Hello World” one from the Docker Hub website. The hello-world Docker image is straightforward, and when people are finding their way with Docker, it’s a good starting place. Details of the image are available at https://hub.docker.com/_/hello-world.
We can stipulate a specific version through the use of tags. The tag is added after the name with a colon separator. As the hello-world Docker image has been tagged following the convention of using a latest tag for the most recent stable version, we can add :latest to the command. This can be done by running on the VM the Docker CLI command
We haven’t made any changes to the Docker configuration, which means we will see the standard Docker log driver behavior when asking the Docker daemon to run our image. While the location of Docker logs can vary, typically we should locate them in the folder /var/lib/docker, where we will see a folder called containers. We can see this as highlighted in section 1 of figure 8.2, with each container instance having its own folder created using its unique ID. Of course, there won’t be any containers present initially. With a local copy of the image now available, we should tell Docker daemon via the CLI to run the hello-world image using the command
If we now refresh our view of the folder /var/lib/docker/containers, the folder will have a new entry, highlighted in section 2 of figure 8.2. In the new container’s folder structure, we will see a log file with a long name (Docker image instance; e.g., b361e69a1 . . .). Navigating into a container’s folder, we’ll see the resources for that Docker instance, including a folder called local-logs (highlighted in section 3 of figure 8.2). Finally, navigating into the local-logs folder, we can see the container’s log file called container.log (highlighted in section 4 of figure 8.2). The log file contents will be unreadable because it’s stored in its own custom format (section 5 of figure 8.2).
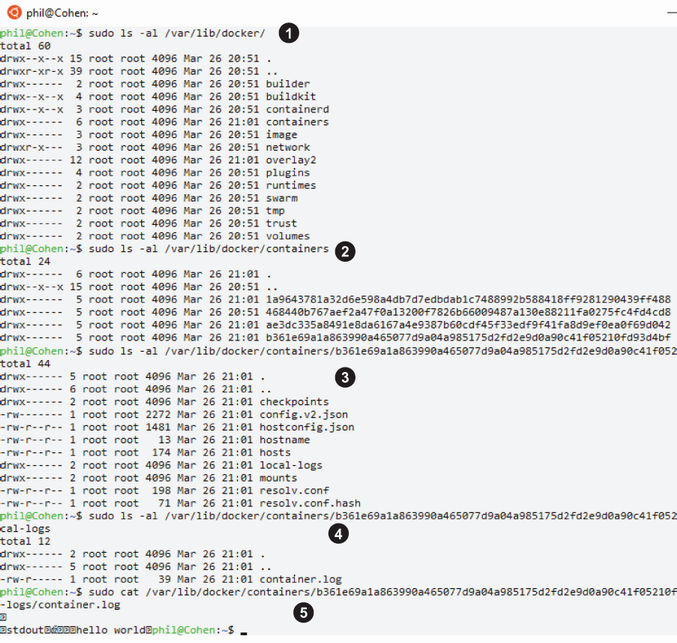
Figure 8.2 Directory structures holding Docker and the folders per container instance, followed by the listing of a container and a container log, which is encoded in a custom manner (numbers in the screen shot are explained in the preceding text)
To make things more practical, we want to configure Docker to log using a more consumable format. We can override the default settings, so Docker uses the Fluentd log driver. This is done by telling the Docker daemon to use an alternative with the parameter -–log-driver=fluentd. We don’t need to do anything more, as the Fluentd driver is bundled in the deployment of Docker. We also need to tell the driver where to find our Fluentd node to receive the log events. This and other configuration options are provided using the parameter -–log-opt followed by a name-value pair separated by the equals (=) character. In our case, we need to give the address (just like the previous curl command) of our host machine’s Fluentd. As the Docker log driver can use the forward plugin (and benefit from msgpack providing compression), we need to ensure the network address, including that port, is provided. This results in the command to run hello-world like this:
The outcome of executing the statement will be to see log events from the Docker image being output on the Fluentd console. If the Docker command returns with an error message such as
docker: Error response from daemon: failed to initialize logging driver: dial tcp w.x.y.z:28080: connect: connection refused.
then something is wrong on the network or in Fluentd (e.g., it is not binding to the correct network). The order in which the docker image and the target Fluentd node are started up should also be noted. This will become particularly important when moving into container orchestration with Kubernetes, as it manages the order in which pods start up. In the event of such issues, we would recommend checking the Docker configuration values for network ports to ensure network traffic is allowed out of the container. If any port number mapping is happening, then that is fine.
The Fluentd driver can use any of the standard features Fluentd offers, such as making communication asynchronous (i.e., exploiting the memory buffer capabilities; more on this in chapter 9). But we’ll look at more of these when we move to the complete configuration.
In figure 8.3, we can see the output generated from running our command. Notice how the log events include the following attributes:
-
container_id—The complete 64-character ID of the container uniquely identifying an individual container. -
container_name—The name of the container when the container was started. Any renaming actions after the startup aren’t reflected until restarted.
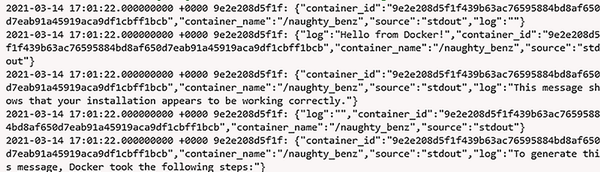
Figure 8.3 The console output from Fluentd received from executing the hello-world container from Docker
8.2.4 Switching to driver configuration through a configuration file
With a parameterized solution proven, we can advance the configuration in a more readable manner and add further options that are relevant. Given all the possible configuration options, using a command line for an advanced configuration will make for a challenging maintenance task. By default, changing the Docker daemon configuration file will impact all Docker images being run. The Docker command line also allows us to point to a configuration file with the parameter –-config, followed by the filename for alternate configuration.
The Docker daemon keeps its configuration, including the log driver configuration, in a file called daemon.json. The default location for the file is /etc/docker/ for Linux setups. If you use an instance of Docker on Windows (rather than the indirect approach we’ve chosen to adopt), the location is ProgramDatadocker config (ProgramData is typically found on the C drive root). It is possible that the file does not exist if the Docker setup is running entirely on default values.
In the daemon configuration file, we clearly want to include the setting of the type of log driver and connection to our Fluentd instance. To do this, we include into the JSON file the configuration version of the command line parameter "log-driver": "fluentd". In the command line, we also provided the fluentd-address attribute. When it comes to the fluentd-address, we can provide the address as tcp://w.x.y.z:28080 or as an explicit path reference to the relevant socket file (e.g., unix:///usr/var/fluentd/fluent.sock).
In addition to the address, we should also introduce several additional parameters directly related to the log driver and other general parameters relevant to logging. The general settings we’ve included are
-
raw-logs—Should be set to eithertrueorfalse. If specified asfalse, then a complete ANSI timestamp is applied (e.g.,YYYY-MM-DD HH:MM:SS), and the coloring of the log text through the use of escape codes is switched off from any encoding. -
log-driver—As shown in the command line example used to set the log driver. -
log-level—The log filter threshold to apply to Docker daemon. The accepted levels aredebug,info,warn,error, andfatal, with the default beinginfo.
Within the configuration file, we can start an inner group of attributes called log-opts; these logging specific options include
-
env—We can ask the driver to capture and include specific environment variables. This is done by defining a comma-separated list. For our purposes, we can use"os, customer". This does assume that something has set such values. It is also possible to define a regular expression version of this by using the attributeenv-regex. -
labels—This works very much in the same way asenv, insofar as a list of labels (Docker metadata name-value pairs) can be specified, or a regular expression can be provided vialabels-regex. -
fluentd-retry-wait—Each time a connection fails, a waiting period is applied before retrying again. The value needs to include the duration type (e.g.,sfor seconds,hfor hours). -
fluentd-max-retries—The maximum number of connection retries before giving up. This defaults to4294967295—that is,(2**32 - 1). We don’t want things hanging for that many retries. Given that we have set retry to one per second, up to 10 minutes retrying would be plenty, meaning a value of600. -
fluentd-subsecond-precision—Allows us to get the timestamp precision to millisecond accuracy if the hardware is capable of it. While the default value isfalse, it is worth setting explicitly, even if it’s to the default value. By explicitly setting the value, we’re reminded that we won’t have such precision. -
tag—The tag to associate with the log event record. This can be built using several predefined values (the complete list is in appendix A) using a notation defined by Docker. In our case, let’s define the tag using the shortened ID and Image ID using the following representation:{{.ID}}-{{.ImageID}}. -
fluentd-address—As in the command-line configuration, this is the location of the Fluentd server to talk with. This, as with the parameter approach, needs to be tailored to the host IP of the Fluentd instance.
The outcome of addressing these other needs means we arrive at the code shown in listing 8.1. Running the Docker daemon process in debug mode is the easiest way to ensure that the configuration file is processed correctly. This means that as this is a daemon service, we need to stop the current process using the command
Listing 8.1 Chapter8/Docker/daemon.json configuration for Docker Fluentd log driver
{
"log-driver" : "fluentd",                     ❶
"log-level": "debug",
"raw-logs": true,                             ❷

"log-opts": {
    "env": "os,customer",
    "labels": "production_status,dev",
    "fluentd-retry-wait": "1s",
    "fluentd-max-retries": "600",
    "fluentd-sub-second-precision": "false",
    "tag": "{{.ID}}-{{.ImageID}}",            ❸
    "fluentd-address": "w.x.y.z:28080"        ❹
  }
}
❶ This tells Fluentd to use the Fluentd version of the log driver.
❷ This is setting Docker to use raw logs, so the formatting isn’t used, and the ANSI timestamp is applied.
❸ This tailors the tag to be used in the log events.
❹ This specifies to the log driver where the Fluentd server is.
Once the service has stopped, we need to copy our modified daemon configuration file to the default location /etc/docker/. Then we can start the process manually with the command
This will launch Docker in debug mode, picking up the configuration from the default location. If there are any issues with the configuration file, the Docker daemon will almost immediately stop or generate warnings about not parsing the configuration. Messages will be displayed on the console, such as
unable to configure the Docker daemon with file /etc/docker/daemon.json: invalid character '
' in string literal
Once the file is read okay, the Docker daemon will direct log events to our Fluentd instance, including the output when running the Hello-World docker image. As our previous command has started the Docker daemon in the foreground, we need to use an additional shell to run the docker image. We can use the same command as before:
If you’re feeling brave, then you can jump straight to running Docker as a service again. This means terminating the current execution of the Docker daemon process in debug mode. Then execute the command
When you’re confident about any further changes to the configuration file (daemon.json), rather than running the Docker daemon manually, we can adopt an approach of simply restarting the daemon to force it to pick up the latest config. This is done by replacing the start command with restart. For example:
Suppose you want to verify that config attributes have been accepted by the Docker daemon. In that case, it is possible to run the command docker --info, which will display all the settings being used, including those defaulted values on the console.
8.3 Kubernetes components logging and the use of Fluentd
The nature of Kubernetes and the model making it highly pluggable means that the landscape can become complex. To illustrate this, if we look at the containerization aspect of Kubernetes, Docker may be the most predominant container technology today. Still, Kubernetes, through the API model, allows us to use other container technologies such as containerd (https://containerd.io/) and cri-o (https://cri-o.io/), both under the governance of CNCF. Some of the complexity is addressed through the Open Container Initiative (https://opencontainers.org/), also under CNCF governance, which helps abstract the interaction between the container implementation and Kubernetes’s orchestration of containers. The essential question here is how does that impact us and the use of Fluentd?
The important thing here is that, as we have seen, we can configure Docker to capture the events propagating through stdout and stderr; therefore, do the other containers support such a capability? Not all containers are as mature as Docker when it comes to logging. Many simply line up with Kubernetes’s internal logging framework klog (https://github.com/kubernetes/klog), which adopts the logging approach of using journald when it is deployed, and otherwise logging to a default file location.
8.3.1 Kubernetes components and structured logging
The application of structured logging today in Kubernetes components is an evolving journey. Not all components within Kubernetes have adopted structured logging yet (although this is changing). We should be prepared for the possibility that any additional system components or extensions used in the future might not apply structure. This reinforces the recommendation that it is better to actively adopt logging and deployment patterns outlined in chapter 7 (Fluentd as a sidecar pattern, embedded with the application, etc.) rather than try to harvest logs out of Kubernetes.
8.3.2 Kubernetes default log retention and log rotation
When the logs come through to Kubernetes from a container because of the container configuration, Kubernetes will push the log entries into a log file for each container instance. To manage the size and log rotation, it is our responsibility to establish a log rotation tool, which can control how many log files and how frequently they are rotated.
Kubernetes doesn’t have its own log rotator; it is the responsibility of the deployer of Kubernetes worker nodes to address log rotation challenges. That said, if the worker node is set up using a Kubernetes provided script (kube-up.sh, http://mng.bz/M25n), it will deploy the open source tool logrotate (https://github.com/logrotate/logrotate). Logrotate can be configured to retain a specified number of files. Some flavors of Linux will have logrotate deployed, so it is a matter of additional configuration. How logrotate is set up can vary across Linux flavors only because of how the Linux configuration is applied. Some flavors use systemd, and logrotate is provided as part of that. Where logrotate isn’t already deployed, it is typical to be able to perform an independent installation via the Linux flavor’s package manager of choice.
Logrotate is not cross-platform as a solution, so running Kubernetes on Windows needs another answer to achieve log rotation, which isn’t obvious and more challenging when examining the Kubernetes discussions on the subject. Regardless of log rotation, logs generated by klog are automatically truncated when they reach 1.8 GB. So any log rotation needs to be established to occur before hitting that threshold.
Kubernetes will automatically delete all except the current log files when a container is removed. If the process of capturing such log events is too far behind, there is a risk of losing log events—something to be considered when establishing log capture.
The takeaway from this is that managing logs at the Kubernetes layer presents challenges with potential differences based on the deployment approach and infrastructure setup. As a result, our preference is to minimize the issues by focusing on log capture in the layers where we can see more consistency and the means to assert more control. We can’t entirely ignore Kubernetes logs, but intercepting the log events elsewhere means the loss of Kubernetes log events isn’t as critical.
8.3.3 kubectl with logging
As you may well already know, kubectl is the primary CLI tool for interacting with Kubernetes. When Kubernetes understands where the logs are being written, we can utilize kubectl to perform various tasks, such as tailing one or more log files, forwarding logs to different ports, and supporting the everyday log file activities. Rather than describe kubectl log commands, all the details can be found in the kubectl command reference at http://mng.bz/aDJB.
8.4 Demonstrating logging with Kubernetes
We need to collect Kubernetes process logs and understand whether internal container processes such as Kubelet are logging errors. Kubernetes has plenty of mechanisms to help us check the health of containers. Still, understanding that everything is running without issue in Kubernetes is essential to knowing whether the containers are being cared for, or the nodes are slowly failing. If an application is logging into the console and events go to Kubernetes, where do we retrieve the events?
To address this, we will deploy a ready-built pod containing the LogSimulator, which is configured to direct the log events to stdout. The log events will propagate through the container mechanism and let Fluentd intercept them in the Kubernetes layer, so we will be capturing the Kubernetes and container internal logs. This may reflect the recommended setup described by the twelve-factor app (https://12factor.net/logs). But it does, in many ways, represent a worst-case scenario, as we have to invest effort in deriving the context (separating multiple log events in stdout that could have been from the platform or container versus the application, etc.) and restructuring the log events.
At this point, if you haven’t followed appendix A to install minikube as our Kubernetes implementation, then now is the ideal time. Once complete, your environment will look like the layout shown in figure 8.4.

Figure 8.4 The layers of operating system and virtualization and containerization being used to ensure our host environment isn’t disturbed with minikube
8.4.1 Kubernetes setup
To demonstrate the Kubernetes configuration to keep things nice and compact, we’re going to use minikube. Minikube is a version of Kubernetes pared down to keep the footprint as compact as possible. If you haven’t already followed the instructions in appendix A, that is the first step to perform on the Linux virtual machine. It also happens to be the Kubernetes implementation used in Kubernetes in Action by Marko Lukša (http://mng.bz/g4wE). Once minikube is installed, let’s fire it up and use the Kubernetes dashboard to look around at the initial state. We do this with the following command for Windows:
This will establish a single node “cluster” of Kubernetes stripped down to the minimum. The download package for this chapter contains Linux shell and Windows batch scripts, which will perform this command (making it a lot easier than remembering or copying the commands every time). Then we can start up the dashboard with this command in either Windows or Linux:
This command starts a foreground process that will deploy the necessary pods to run the dashboard UI and provide the dashboard page URL. With the dashboard page open, we can navigate using the UI’s left-hand menu to see what DaemonSets, Deployments, and Pods are currently deployed (as part of the Workloads section of the menu). As you can see in figure 8.5, there are no DaemonSets currently deployed. You will find the basic hello-minikube deployment and associated pod running.

Figure 8.5 Kubernetes dashboard running on minikube, currently only showing the default namespace rather than the kube system or where most DaemonSets will be.
8.4.2 Creating logs to capture
We first need an application to generate log events so we can observe a log DaemonSet collecting events from Kubernetes and the applications not logging more directly to an endpoint (i.e., they are simply sending logs to stdout and stderr). For this, we can use a containerized version of LogSimulator. The containerized version of this tool is, by default, configured to loop through a simple data set several times and then stop. Each log event is simply written to stdout; thus, log events will get collected by Kubernetes. When the LogSimulator pod completes its run, it will stop the pod, at which point, Kubernetes will intervene to restart the deployment. The LogSimulator Docker image already exists within Docker Hub. The Kubernetes configuration to use this Docker image within a pod is shown in the following listing, which can be retrieved from http://mng.bz/5KQB. As there is no need for any configuration or external facing endpoints, the YAML configuration is straightforward.
Listing 8.2 Chapter8/LogGenerator/Kubernetes/log-simulator-deployment.yaml
apiVersion: apps/v1
kind: Deployment
metadata:
  name: log-simulator
  labels:
    app: log-simulator
spec:
  replicas: 1
  selector:
    matchLabels:
      app: log-simulator
  template:
    metadata:
      labels:
        app: log-simulator
    spec:
      containers:
      - name: log-simulator
        image: mp3monster/log-simulator:v1      ❶
❶ This is the reference to the Docker Hub image, which, when deployed, will be downloaded. If a newer version of this pod needs deploying, the version reference at the end of the name (i.e., :v1) must be updated. Without this, Kubernetes will ignore the request as it already has that version of the LogSimulator.
To deploy this pod, you need to ensure the environment variable LogSimulatorHome is defined, which references the root folder of the LogGenerator that has been previously installed. Alternatively, edit the provided script (deploy-log-sim-k8.bat or deploy-log-sim-k8.sh), replacing the environment variable reference with the absolute path. If you use the script, it will always try to remove any possible existing pod deployment first to be safe. This means that if you want to keep redeploying, then just use the script. To issue the deployment command yourself, then, in a shell, issue the following statement:
minikube kubectl -- apply -f %LogSimulatorHome%Kuberneteslog-simulator-deployment.yaml --namespace=default
Minikube should confirm the deployment as being successful.
Understanding LogSimulator’s view
Before we move on to look at the DaemonSet, it is worth taking a “little peek under the hood” to see things happening. As we’ve previously started the Kubernetes dashboard, we can use this to help us. We need to access the list of pods (left menu option); thus, we will see a list like the details shown in figure 8.6. We need to access the log-simulator pod instance, which can be done by clicking on the name that starts with log-simulator.

Figure 8.6 Kubernetes dashboard showing the instances of pods that contain our LogSimulator and Fluentd
This will display the details about the specific pod, and the top of the screen will look something like the details shown in figure 8.7.

As you’ll note in figure 8.7, there are four icons in the top right-hand side of the image. Clicking on the first icon will display a view like the one in figure 8.8. The figure shows us the stdout being generated by the LogGenerator.

Figure 8.8 The console (stdout) of our instance of the LogGenerator with its simple configuration generating events to be collected by our Fluentd setup
While this is useful and confirms the container is functioning as expected, we need to know which file Kubernetes is pushing this output to, as we need to set up a tail input plugin against that file. Returning to the screen, we saw in figure 8.7 that we want to use the arrow-based icon (second from left), as this will provide us with a shell view into the container being executed.
It is also worth logging into a shell provided by this container image, because you will see the environment as your application will. Any container exploration needs to be quickly done—once the LogGenerator has completed generating log events, it will stop. As a result, our container will die, taking our session with it. If you try to see what logs exist, you shouldn’t see anything, as the log events will be captured on the host running Kubernetes, not in the container. By doing this, we have clearly established the first of the requirements of our Kubernetes container—the fact that access to the host file system is needed to collect the logs generated.
8.4.3 Understanding how Fluentd DaemonSets are put together
Our first contact with Kubernetes was in chapter 2, where we looked briefly at using a DaemonSet provided by Fluentd. We’ve said Kubernetes configuration gets complex. However, it would be easy to question this given the Kubernetes.yaml we’ve used for the LogGenerator. Let’s take a moment to step through what is involved with the Kubernetes and Docker resources for Fluentd. There are a couple of crucial repositories relevant to this, specifically the following:
-
Kubernetes DaemonSet in GitHub—This is where most of the necessary implementation details are (http://mng.bz/6ZXo).
-
Docker file base images—(https://github.com/fluent/fluentd-docker-image). These are the Docker base images, including the template mechanism used to help generate the different OS variations.
-
Docker Hub repository—This is where the Docker images are pulled from for the Kubernetes configuration (https://hub.docker.com/u/fluent). One or more Docker images form a pod based on the configuration provided.
-
Metadata filter—This is incorporated into the DaemonSet (http://mng.bz/oa2d). The metadata filter enriches the Kubernetes log records with additional context to help you better understand what is happening.
When you visit the GitHub repository for Fluentd’s DaemonSets, you see a range of YAML files. The Fluentd community has provided a range of standardized configurations for capturing Kubernetes logging and sending the contents on to a single destination. The configurations range from forwarding the content to another Fluentd node, to sending to various cloud-native services provided by AWS, Azure, and Google, to dedicated services such as Graylog, Loggly, and the more common targets Elasticsearch and Syslog.
When examining the Kubernetes YAML configurations, you’ll see they are all very similar in nature, with the following characteristics:
-
Setting the image up, so it will be deployed in the kube-system namespace
-
Defining environment variables that can be used in the relevant Fluentd configuration file to connect with the external service—typically details such as the host and port of the target solution
-
Specifying the number of resources that should be allocated to the container
-
Defining the host-file locations that need to be visible within the container—specifically
/var/logand/var/lib/docker/containers—and how the path should be seen within the container.
What isn’t shown in the configurations is that some additional environment variables can be set and passed through, further changing the container’s behavior; for example, whether to try and interact with systemd. But we’ll see this in more detail shortly. We can assume that the “real magic” occurs in the container, and therefore in the Docker file.
If you examine the README in the repository’s root, you’ll see a list of Docker pull commands, with one or more references for each type of daemon. Looking through the list, you’ll note they have been broken into two major groups: x86_64 images and arm64_images. The need for this may not be immediately apparent until we remember that the Docker file has to ultimately reference binaries specific to the computer hardware. This is a downside of delivering virtualized or containerized solutions over using a more generic package manager. This means we have a lot of Docker images to maintain.
The Kubernetes Docker images are also generated using templates, but we can characterize the activities as doing the following things:
-
Setting up Ruby and Gem, including defining environment variables to the appropriate locations
-
Configuring files covering Fluentd, systemd, Kubernetes, Prometheus
Using an example such as https://github.com/fluent/fluentd-kubernetes-daemonset/tree/master/docker-image/v1.12/arm64/debian-forward/conf, we can examine the configuration and file relationships in detail. Figure 8.9 also provides a visual representation of the file relationships:
-
Fluent.confis in the root container and uses theincludemechanism to bring in the contents of other configuration files, as we saw back in chapter 5. This configuration file also has a single match that, in the case of the forward DaemonSet, matches all log events and sends them on to the target server. It is worth noting that the forwarding configuration does not include any security (no TLS, etc.); this isn’t a problem if the logs are not sensitive. But if they are, then you will need to replace the configuration files with ones that include the necessary configuration. We’ll see more of how this can be done later in the chapter.The inclusion of the systemd and Prometheus configurations are subject to environment variable controls, specifically the existence of settings for
FLUENTD_SYSTEMD_CONFandFLUENTD_PROMETHEUS_CONF.The
Kubernetes.confis needed, so it is included. Finally, any configuration in theconf.dfolder is included, so extending the configuration with any specific customizations is possible. -
The
Prometheus.conffile is straightforward. It defines the use of the input plugins for Prometheus andPrometheus_output_monitorto monitor Prometheus. Environment variables define the server addresses tobind,port, and apathif the metrics URI are different using the variablesFLUENTD_PROMETHEUS_BIND,FLUENTD_PROMETHEUS_PORT, andFLUENTD_PROMETHEUS_ PATH, respectively. -
The
Systemd.conffile defines the sources for Docker, Kubelet (the Kubernetes node controller and bootkube service using the systemd source plugin). It is worth noting that this plugin is separate from the Fluent Git repository and has been separately authored (details at https://github.com/fluent-plugin-systemd). -
The
Kubernetes.conffile is the most interesting of the inclusions in the configuration. Like systemd, it also uses an external plugin, this time a filter calledkubernetes_metadata(the details of which can be found at https://github.com/fabric8io/fluent-plugin-kubernetes_metadata_filter). The filter’s job incorporates or excludes additional metadata into the log events. This is done by communicating with the Kubernetes API endpoint using the environment variablesFLUENT_FILTER_KUBERNETES_URLor combiningKUBERNETES_ SERVICE_HOSTandKUBERNETES_SERVICE_PORT. This requires metadata from the log events for essential context to retrieve information from the Kubernetes API. The info can be drawn from the journald if being used or possibly from the log file names. Some of the attributes used with the plugin either assume the default values or are hardwired into the container. The controls that can be configured map to the plugin attributes as follows:KUBERNETES_VERIFY_SSL—verify_sslsets a flag indicating whether the SSL/TLS certificates should be checked. If your environment has a certificate authority for the certificates used, we recommend this be set to yes.KUBERNETES_CA_FILE—This attribute provides the path to the CA file for Kubernetes server certificate validation.FLUENT_KUBERNETES_METADATA_SKIP_LABELS—Don’t retrieve the labels from the metadata if set totrue.FLUENT_KUBERNETES_METADATA_SKIP_CONTAINER_METADATA—If set totrue, then the metadata relating to the container image andimage_idwill not be included.FLUENT_KUBERNETES_METADATA_SKIP_MASTER_URL—Iftrue, themaster_urlmetadata will not be included.FLUENT_KUBERNETES_METADATA_SKIP_NAMESPACE_METADATA—If set totrue, then the metadata such asnamespace_idwill be excluded.FLUENT_KUBERNETES_WATCH—When set totrue, it tells the plugin to watch for changes in the metadata held by the Kubernetes API server for the pods.

For a filter to do anything meaningful, the configuration needs to include sources. In this case, the tail source plugin is used multiple times to capture any logs generated in the folders /var/log/containers/*.log, /var/log/salt/minion, /var/log/ startupscript.log, /var/log/docker.log, /var/log/etcd.log, /var/log/ kubelet.log, /var/log/kube-apiserver.log, /var/log/kube-controller-manager.log, /var/log/kube-scheduler.log, /var/log/rescheduler.log, /var/log/glbc.log, /var/log/cluster-autoscaler.log, and /var/log/kubernetes/kube-apiserver-audit.log. You may have recognized these as the log files for the core Kubernetes processes. Based on this, we should see log events picked up as long as our container’s log events get written somewhere in the /var/log/containers/ folder on the Kubernetes host.
8.5 Getting a peek at host logs
Earlier in the chapter, we peeked at what our LogGenerator container could see of the environment and established that it couldn’t see any part of the host, and therefore any logs. This is because we didn’t configure the container to mount a file system. A folder mount wasn’t necessary, as we trusted the container to capture stdout and put the content in a suitable location. However, when we demonstrated that behavior, we had control of Docker. Now Docker will be managed by Kubernetes. Additionally, we need to think about how we monitor Kubernetes itself. A review of the prebuild Fluentd resources points to the log content residing in /var/log. Minikube provides a convenient tool that allows easy access to the host environment. Once we can access the host, we can examine the environment to locate the relevant log files and understand what needs to be captured. Using a new shell (Windows or Linux), we can use the command
This will provide us with a secure shell into the host environment. Let’s look at the folders we’ve seen in the current configuration using the command
The result is perhaps not as expected, given this is a folder of symbolic links to files in /var/log/pods, as shown in figure 8.10. Fortunately, everyone can see the links.

Figure 8.10 The result of looking at the /var/log/containers folder—you can see the files listed as symbolic links to another file in the pods folder
If we follow the links to /var/log/pods, we see that each link resolves to a folder that reflects instances of the pods, as shown in figure 8.11.
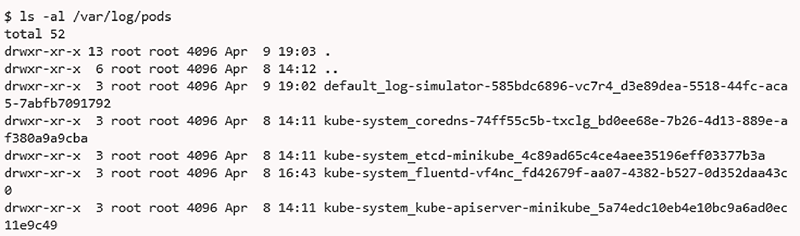
Examining one of the pod folders, such as log-simulator, previously deployed into the default namespace (hence the default_ prefix), we see a folder with incrementing log file numbers and another layer of symbolic links, shown in figure 8.12.

Figure 8.12 The content of one of the pod folders in /var/log/pods, which again are symbolic links to another part of the file system
Following the link into /var/lib/docker/containers yields a new challenge—the privileges are greatly restricted, and we need to use a sudo command to list the folder’s contents, as shown in figure 8.13.

Figure 8.13 The restricted contents of /var/lib/docker/containers can be seen here; note the very restrictive privileges.
If we look inside one of these folders, we find the log files shown in figure 8.14. But the last couple of steps have worked only with elevated permissions. It also helps us understand the different file paths being used in the predefined configuration. This means that in the YAML file, we need to ensure that the mounts work with appropriate permissions. It also confirms that the paths inside the containers are the same as the host.

Figure 8.14 Having overcome the restrictions, we can see the contents of /var/lib/docker/containers, which include a genuine log file rather than another symbolic link.
We should also note that minikube’s log access security is very coarse-grained, and as a result, if you can see one log, you’ll be able to access them all if you interact with the host. In a production context, this is not very desirable from a security perspective. The takeaway is if you’re sensitive about logs in a containerized environment, control the visibility more directly using patterns such as the sidecar, as discussed in chapter 7. Taking more active control of your container’s log events means you won’t be subject to how access controls are managed in Kubernetes.
Navigating through the file system makes it clear that the way Kubernetes is configured is not trivial. This brings us back to the point that the more we can monitor at the container and application levels, the easier things will be.
8.6 Configuring a Kubernetes logging DaemonSet
Given the overview, it would be reasonable to assume that we can copy the configuration YAML to establish the Kubernetes DaemonSet for logging. We can leverage the existing Docker images provided by Fluentd in our configuration. The YAML configuration will need to give specific environment variable values and mount the right parts of the file system. If we wanted the DaemonSet to also apply some customized configuration, we would need to map additional configuration files into the system.
Rather than set a lot of environment values to control the current Fluentd configuration, we can look at how we can point Fluentd to an alternative configuration file and inject the modified configuration. This also gives us a chance to address content layout in a Docker file that can impact downstream applications.
8.6.1 Getting the Fluentd configuration ready to be used
With the customized Fluentd configuration, we could deploy this by modifying the Docker build. However, a more elegant way is to exploit the features of the Kubernetes configuration. This means if we wish to alter the configuration, we only need to redeploy a configuration change rather than changing the Docker image and the subsequent steps involved in redeploying it. This is made possible because the Fluentd Docker files work by configuring Fluentd through environment variables and suitably placed additional configuration files that can be picked up through the includes statements.
With our Fluentd configuration established, we need to get it ready to be consumed by the container. We’ll do this using a Kubernetes ConfigMap, which we’ll explain a bit more shortly. We need to start by deploying the ConfigMap into Kubernetes, ready to be referenced. The ConfigMap can be included in our core Kubernetes YAML file, or we can use the Fluentd file, translate it to a suitable format, and deploy the configuration separately. This latter approach is more desirable, as we can check the configuration using the Fluentd dry-run feature we saw in chapter 3 to validate the configuration before deploying. If the configuration is embedded in the larger configuration file, the validation step won’t be possible.
The Fluentd ConfigMap is associated with the kube-system namespace to match the fact that the standard Fluentd DaemonSet is deployed into that namespace. The use of this namespace makes sense; in this case we’re configuring and deploying a Kubernetes-wide service. Listing 8.3 shows the Fluentd configuration that we want to introduce. As you can see, it sources logs from the containers and pods and sends the log events to a configurable target. We also need to note the name of the ConfigMap (fluentd-conf), as this will be referenced in the YAML file. As with the LogSimulator deployment, we’ve bundled a batch and shell script, removing any previous configuration (deploy-config.bat and .sh).
To deploy the configuration file, we need to use the minikube command:
minikube kubectl -- create configmap fluentd-conf –from-file=Fluentd/custom.conf --namespace=kube-system
If you want to confirm the deployment, use the dashboard to view the configuration and select Config Maps (from the left-hand menu). Then, in the center part of the dashboard, you’ll see all the ConfigMaps, including our fluentd-conf. The content of the ConfigMap can then be displayed by clicking on the name of our ConfigMap. You may see each line terminated with
; this is the Linux encoding of a carriage return and won’t present any issues when the file is processed.
Listing 8.3 Chapter8/Fluentd/custom.conf overriding configuration for Kubernetes
<system>
    Log_Level debug
</system>

<source>
  @type tail
  path /var/log/containers/*.log
  read_from_head true
  read_lines_limit 25
  tag deamonset
  path_key sourcePath
  emit_unmatched_lines true
  <parse>
    @type none
  </parse>
</source>

<source>
  @type tail
  path /var/log/pods/*/*.log
  read_from_head true
  read_lines_limit 25
  tag deamonset2
  path_key sourcePath
  emit_unmatched_lines true
  <parse>
    @type none
  </parse>
</source>

<source>                                        ❶

  @type tail
  path /var/lib/docker/containers/*.log
  read_from_head true
  read_lines_limit 25
  tag deamonset3
  path_key sourcePath
  emit_unmatched_lines true
  <parse>
    @type none
  </parse>
</source>

<match *>
    @type forward
    <buffer>                                    ❷

      buffer_type memory
      flush_interval 2s
    </buffer>
    <server>
      host "#{ENV['FLUENT_FOWARD_HOST']}"       ❸
      port "#{ENV['FLUENT_FOWARD_PORT']}"
    </server>
</match>
❶ This source is part of the secured file system and needs the privileges set to allow Fluentd to read.
❷ We’ve set a very short-lived buffer so we can see the events flowing through quickly; given our deployment, the networking overheads aren’t an issue.
❸ Allows the addressing of the server to be driven through the Kubernetes configuration file
Passing content to the container through Kubernetes
Kubernetes provides a range of ways to share content into a container as a mount path. The number of options is such that Kubernetes in Action has several chapters dedicated to the subject. Essentially, the different techniques can impact whether the container can modify the file system, whether the storage has persisted beyond the container's life, and so on. A ConfigMap is immutable (read-only), which is ideal for our scenario. The contents of a ConfigMap can be consumed through environment variables, command-line values, and files, depending upon the options used. However, they are limited in size, so they may not be suitable if you wish to pass over a log file to be replayed.
When sharing files into Kubernetes-managed containers, we must be mindful that any content already in the folder (volume) of the container receiving the shared folder will effectively get overwritten with the shared content from Kubernetes. So, pushing new configurations into the container needs to be done carefully. For example, replacing just the Kubernetes.conf file in the standard Docker setup wouldn’t be wise because it shares a common folder with all the configuration files. By adopting the approach used in the containers of putting the new configuration files into a different location and modifying the path to the configuration file Fluentd picks up via the environment variable, we protect ourselves from such issues. This means if we wanted, we could include the standard Kubernetes and Prometheus configurations and then replace them when necessary.
8.6.2 Creating our Kubernetes deployment configuration
Let’s adapt and deploy that standard Fluentd repository DaemonSet for our minikube environment. To do that, we need to download the file locally, as we need to make a couple of tweaks. This can be done by using either a wget command on the raw view (http://mng.bz/OGpE) or by using the git clone command. My preference is wget (it’s the easiest way to retrieve lots of things in Docker files, etc.), which looks like
wget https://raw.githubusercontent.com/fluent/fluentd-kubernetes-daemonset/master/fluentd-daemonset-forward.yaml
We need to then make the following additions and modifications:
-
Set the values for the location of our Fluentd node that we want to forward the log events to. This means we should replace the text
REMOTE_ENDPOINTwith the address or IP of the host machine (e.g.,192.168.1.2). The value for theFLUENT_FOWARD_PORTalso needs to be changed from18080to28080.This is to reflect the port being used in our Fluentd node configuration.In a production setup, we would always recommend this be a DNS address. That way, any changes in the environment or scaling Fluentd with load balancing are masked from the configuration. This will require understanding how DNS is handled within Kubernetes, which is not a subject for this book.
-
Add the environment variable
FLUENTD_SYSTEMD_CONFinto theenvsection of the YAML, and set its value to"FALSE". -
Override the
FLUENTD_CONFenvironment variable in the same section so that it points to ourcustom.conffile we’ve supplied via the ConfigMap. -
Add a
securityContextsection to the container’s part of the YAML file with theprivilegedattribute set totrueto overcome the previously identified permissions challenge. -
Add the
volumeMountentry for our ConfigMap so that the path is defined as expected. This means adding to thevolumeMountssection an additional name calledconfig-volume, amountPathof/fluentd/etc/custom. -
We then reference the volumes section as an additional entry with the name of
config-volume(linking the volumes andVolumeMounts) with an attribute ofconfigMap,which is then referenced byname, which we previously set up asfluentd-conf.
As we have tailored the existing configuration, you will still reference the Docker image defined by the Docker file at http://mng.bz/p2dz. The actual Docker image will come from Docker Hub at http://mng.bz/QWvG. The result of tailoring the Kubernetes YAML file can be seen in the following listing.
Listing 8.4 Chapter8/Kubernetes/fluentd-daemonset.yaml modified for our requirements
apiVersion: apps/v1
kind: DaemonSet
metadata:
  name: fluentd
  namespace: kube-system
  labels:
    k8s-app: fluentd-logging
    version: v1
spec:
  selector:
    matchLabels:
      k8s-app: fluentd-logging
      version: v1
  template:
    metadata:
      labels:
        k8s-app: fluentd-logging
        version: v1
    spec:
      tolerations:
      - key: node-role.kubernetes.io/master
        effect: NoSchedule
      containers:
      - name: fluentd
        image: fluent/fluentd-kubernetes-daemonset:v1-debian-forward     ❶

        env:
          - name:  FLUENT_FOWARD_HOST                                    ❷

            value: "192.168.1.2"
          - name:  FLUENT_FOWARD_PORT
            value: "28080"
          - name: FLUENTD_SYSTEMD_CONF
            value: "FALSE"
          - name: FLUENTD_CONF                                           ❸
            value: "custom/custom.conf"
        resources:
          limits:
            memory: 200Mi
          requests:
            cpu: 100m
            memory: 200Mi
        volumeMounts:
        - name: varlog
          mountPath: /var/log
        - name: varlibdockercontainers
          mountPath: /var/lib/docker/containers
          readOnly: true
        - name: config-volume                                            ❹

          mountPath: /fluentd/etc/custom/
        securityContext:                                                 ❺

          privileged: true
      terminationGracePeriodSeconds: 30
      volumes:
      - name: varlog
        hostPath:
          path: /var/log
      - name: varlibdockercontainers
        hostPath:
          path: /var/lib/docker/containers
      - name: config-volume                                              ❻
        configMap:
          name: fluentd-conf
❶ We continue to reference the prebuilt Fluentd Docker image setup for managing logging for Kubernetes.
❷ The IP and port for the log events to be forwarded to, set by using environment variables
❸ Overrides the location of the configuration file to be used when Fluentd starts up
❹ Defines the mount location that the container will see. This path is then mapped to a file system outside of Kubernetes, giving us assurance the logs can be safely retained.
❺ The additional security setting so that the container can access the restricted folders and files we saw when exploring the host server
❻ Maps the volume to the ConfigMap that was loaded into Kubernetes earlier
8.6.3 Putting the implementation of a Fluentd for Kubernetes into action
Using the understanding gleaned from chapters 3 and 7 and exploiting the existing Fluentd configuration files for the DaemonSet (see http://mng.bz/XWZv), construct a simple single configuration file that tails any relevant files from the Kubernetes cluster. As the log events are collected, forward them to the Fluentd node previously used with the Docker log driver configuration.
A simple Fluentd configuration has been provided in the download pack as shown in listing 8.4, which we will utilize for the following steps. Still, there is nothing to stop you from substituting your configuration into the next steps.
8.6.4 Deploying to minikube
Before deploying the DaemonSet, we should start our local Fluentd instance ready to receive log events. This is the same step as we have done many times before with the command
The next step is to deploy to Kubernetes our DaemonSet:
Again, we’ve made a batch and shell script in the download pack called deploy -deamonset.bat or .sh, which will remove any preexisting deployment and push the current configuration into Kubernetes. You can confirm the DaemonSet’s deployment for the other assets using the dashboard by selecting the menu option for Daemon Sets (in the left-hand navigation menu under Workloads); this should list fluentd. Clicking on the title will show the details of the pod containing our container.
If Kubernetes has been in a steady idle state, then we may not see any logs immediately. We can address this by redeploying our LogSimulator configuration as we had did earlier in the chapter using the script deploy-log-sim-k8. This will quickly result in various events from Kubernetes being sent across, including the stdout log events from the LogSimulator container. We can see an example of the output in figure 8.15.

8.6.5 Tidying up
Having run Kubernetes and retrieved various Docker images and minikube assets, you’ll reach a point where you want to clear or refresh the environment. One of the simple but excellent features is that minikube will completely wipe the environment with a single command to release resources because you’ve finished, or reset and start again if you want to validate everything again. This is done with the command
8.7 Kubernetes configuration in action
We have established a basic configuration that gives us a sight of the log events within a Kubernetes environment. However, the configuration isn’t enterprise-ready. To get to enterprise readiness, we will need to improve the configuration. Your challenge is to identify the changes necessary and take the provided configurations and amend them as necessary.
8.7.1 Answer
The changes you have identified should include the following points:
-
The tail source is not recording its tracking position in the file; thus, a restart could duplicate log events.
-
The recorded
pos_fileneeds to be mapped to a mount point so that if the pod is restarted, the position information is not lost. -
The tail configuration needs to address this issue of log rotation being managed.
-
The additional Kubernetes metrics and Prometheus information should be available and controlled through the configuration.
-
The Kubernetes core components (in the kube-system namespace) should have their logs tagged separately to hosted applications and the receiving end separating out the tags.
-
Exploit the Kubernetes plugin to tag the log events with the additional metadata.
-
Tune the caching in Fluentd to be more production-friendly and take into account the resources provided by Kubernetes.
8.8 More Kubernetes monitoring and logging to watch for
We have addressed the core logging considerations for Kubernetes, but there are additional areas you should be aware of that may need further consideration. Kubernetes is continuing to evolve and be extended rapidly. As a result, some features may not be provided, as the deployment being run on is not the latest iteration, or if you’re using a managed service, the service provider may have implemented certain features differently as the different capabilities are typically API-led. And, of course, you may wish to overlay Kubernetes with a mesh framework, like Istio or Linkerd, that will have its own logs. We believe the following areas are the most valuable areas to track with core Kubernetes.
8.8.1 Node monitoring
So far, we have focused on the core logs involved with our containers. But you may wish to also address the monitoring of the health of the underpinning of the Kubernetes node. There are various options around this, including using Fluentd or Fluent Bit on the native node and monitoring the server’s raw statistics. However, this may not be allowed in some environments. Kubernetes also provides an additional DaemonSet for a service called the Node Problem Detector.
The node problem DaemonSet is an optional add-on for minikube, and some other prebuilt Kubernetes clusters provided by cloud vendors and others take this approach. As a result, the DaemonSet needs to be enabled. The Node Problem Detector monitors the kernel log file and reports on specific issues based on the configuration, which can be overridden with a ConfigMap, in the same manner as we have modified the Fluentd configuration. The detector includes an exporter element that sends the information to different endpoints, including the Kubernetes API server and the Stackdriver, which integrates to our Fluentd Daemon.
More information on this service can be found at https://github.com/kubernetes/node-problem-detector.
8.8.2 Termination messages
Within the configuration of a pod, it is possible to configure the recording of information relating to a pod’s termination. So in the event of an abnormal termination, it is possible to perform a retrospective diagnosis. Within a container configuration, Kubernetes can be given a path to where the termination messages are in a container using the property terminationMessagePath (which is defaulted to /dev/termination-log). We need to verify that the Kubernetes configuration ensures the log event is directed to a location picked up by Fluentd or that Fluentd knows how to retrieve this information from Kubernetes. More information on this can be found at http://mng.bz/y4aB.
Summary
-
The default Docker log driver works in such a way that trying to track its log files directly using standard Fluentd plugins isn’t possible (e.g., use of compression).
-
Fluentd can be used as a log driver for Docker, making accessing and using Docker log events a lot easier.
-
Fluentd GitHub repository includes predefined DaemonSet configurations. Alternative Fluentd configurations are also made available in prebuilt images to accommodate OS differences and the possibility of routing logs directly to services such as Elasticsearch.
-
Kubernetes configurations such as minikube are complex, with levels of indirection through symbolic links making it difficult to determine which files are the real logs if we want to monitor.
-
Using the power of Kubernetes’s ConfigMaps, it is possible to tailor or extend the out-of-the-box Fluentd configuration. So, a prebuilt Fluentd Docker image will capture log events and send them to a different Fluentd node.