
Location Analytics Project Development
First it helps to understand the steps involved in assessing and then implementing a location analytics project. In the next chapter, I’ll tell you about a retail real estate marketing project that my consulting group Beitz and Daigh Geographics, Inc. worked on and you will see these steps first hand. But first let’s look at the basic steps in a location analytics project.
Here is a basic outline of the steps in the process:
- Start with your questions and goals
- Determine your study area
- Assess your data requirements
- Assess your software and 3rd party services need
- Check the budget to see if it all works
- Create a phased approach if necessary
- Perform the analysis and recalibrate as necessary
- Evaluate results
- Create a plan to communicate and act on your findings
Project Start
Once you have recognized an opportunity to use location analytics then it’s time to get your project going. If you work for a large organization be careful to not let the scope get too big for your project. Often companies get stuck at the beginning of a project by creating an unusually large scope of work. If the scope gets very large, then break the project into phases so you can get the project going. Taking it slow by implementing a solid phase 1 will go a long way toward your success. I have seen many companies try and do too many things at one time, and they end up doing nothing partially well. Then you have a bunch of half-done phases trying to connect and it turns into a disaster. You may also consider creating a request for proposal (RPF) that details your requirements. This way you can shop the RPF to several companies to better compare pricing, timing, and approaches. If you are doing this project internally then it still helps to have a scope of work or project goals document. This way you can clearly communicate the goals of the project, stay on task, and highlight areas where the project needs improvement.
Study Area
Determine your study area early. There is nothing worse than creating a great project only to have your client come back and ask “But what about this state or that city?” Set clear expectations early on what and where the project will cover. Sometimes your study area will be determined by the data available. You may want to slightly broaden your study area depending on the project. For example, a South Carolina project could include Charlotte, NC and Augusta, GA because those cities have a direct effect on cities in South Carolina that are close by.
Data
Next you need to evaluate the data required for your project. If you need data for your project, then you need to determine where it’s coming from and how much it will cost. Do this first by evaluating what data sources and data subscriptions you have in-house. Are there other departments in the organization that have data you can use or data that they can create for the project?
Government entities are great sources of data since they often have the budgets, staff, and the need to create and maintain large diverse spatial data sets. Most cities and counties have data sets that deal with infrastructure and property. Many states maintain data sets on aerial imagery, contours, soils, and wetlands. If this data is free, then it is usually available for download at the organization’s website. If the organization charges for data, then there are usually instructions on cost and who to contact to get the data. Florida, North Carolina, and California are three states where data is often readily available and free at the state and county levels. If you have a relatively small study area, then going county by county for parcel data might be feasible. Or if you only need the locations of grocery stores within a small city then you could build this data set as well easily by collecting all the names and addresses of the stores and geocoding them into the GIS.
But what if you need parcels for several states? Or if you need the entire portfolios of a retailer’s locations? Private companies have many great data sets available to help with these needs. If you need retailer locations, then AggData, Chain XY, Trade Dimensions, and Chain Store Guide are great companies to consider. With over 6,000 layers in 35 countries, AggData has one of the largest retailer databases on the market today. With a premium subscription to AggData, this data is also accessible via Esri ArcGIS Online. What this means is that if you are working in Esri ArcGIS Desktop or Esri ArcGIS Online then you can directly import these retailer layers without the need to geocode the raw files. If you are looking for parcel data then Real Estate Portal USA, Digital Map Products, and Corelogic are worth checking out. Maponics is a data provider company that has some great neighborhood, social place, and school attendance zone boundary GIS layers. Companies like Trulia, Redfin, eHarmony, and Angie’s List use data sets like these to better help their customers engage with their services.
Demographics data is another data set that many companies use for location analytics projects. Much of this basic data is free from the census, but it can be difficult to assemble into a GIS program and it lags the current year estimates and projects provided by other companies.
In a move to strengthen its presence in the business sector, Esri purchased the demographic company CACI in 2002 and used it to create a business information systems solutions division called Esri BIS (which has since been folded into Esri). Today Esri provides demographic data in its Business Analyst Desktop and its Business Analyst Online products. Users can access this demographic data at the various census geographies by viewing it in a color coded (thematic) map or by calculating it for trade areas such as a radius or drive time. STI: PopStats, provided by Synergos Technologies, Inc., is another demographic provider and they are very popular with the real estate site selection community. With quarterly updates, STI: PopStats helps businesses to see where the growth is taking off, compared to other companies that provide only annual updates. Other demographic data providers include Applied Geographic Solutions (AGS) and Nielson.
Demographic data is collected and referenced at the various census geographic entities. A basic understanding of these entities will help in planning a location analytics project. Census Blocks are the smallest level of geography that data is collected at. At this level you get data on population, households, and housing units. The next level up is Census Block Groups. It’s at this level where you find the most detail with the most demographic variables. If you are working on a project and you need to aggregate data on a radius or drive-time, then you really need to be working with Census Block Group data.
The Federal Deposit Insurance Corporation (FDIC) has great data sets for banks. This data set not only has all the major bank locations, but it also has data on the annual branch office deposits. Banks themselves can use this data to explore markets for new branches. They can also explore if a specific branch’s deposits are increasing or decreasing abnormally compared to the peer banks in the market. Shopping center companies and real estate developers can also use this data to help lure new banks to new or existing developments. A market where the banks have strong deposits or where bank deposits have dramatically increased recently will be a prime market for new bank locations.
The National Center for Education Statistics also has great location data available for public and private schools. These data sets can easily be geocoded, and it includes the number of students and teachers per school. School data is great because it helps show the nodes of activity in a market for families. Retailers take note of this data when working on market planning for new stores. Homebuyers also should take note of this data if they are looking to avoid a street that is frequently traveled in the morning and afternoon by buses and parents transporting students.
ArcGIS Online by Esri has many layers that you can use either as backgrounds or analysis layers. This service also allows users to create new data sets by “geo-enriching” their existing data. For example, if you need to highlight all the stores in an area with high income, but you don’t have the latest demographic data then you can “geo-enrich” your data by adding demographics. There is a minimal cost for this through the ArcGIS Online credits payment system, but the cost here is usually not a big concern unless you deal with very large data sets. In the case of large data sets there are other solutions available such as Esri Business Analyst for the desktop. This is an expensive program, but users can run as many demographic requests as the want without having to pay credits on ArcGIS Online.
Tapestry Segmentation1 data by Esri is another data source to keep in mind for your projects. This data is available down to the block group level and classifies residential neighborhoods into 67 unique segments based on socioeconomic and demographic characteristics. These 67 segments are rolled up into 14 LifeModes in order to summarize the data at a high level. Organizations will find it easier to adopt the 14 LifeModes for the simple reason that they are easier to remember if you are dealing with the general population. If you are only targeting the top two or three LifeModes then it helps to understand the segments that make up those LifeModes. Here is an example of the LifeMode “Uptown Individuals”:
- Young, successful singles in the city
- Intelligent (best educated market), hard-working (highest rate of labor force participation) and averse to traditional commitments of marriage and home ownership
- Urban denizens, partial to city life, high-rise apartments and uptown neighborhoods
- Prefer debit cards to credit cards, while paying down student loans
- Green and generous to environmental, cultural, and political organizations
- Internet dependent, from social connections to shopping for groceries (although partial to show rooming)
- Adventurous and open to new experiences and places
- And then within the LifeMode “Uptown Individuals” you find the segment “Laptops and Lattes.”
Segment: Laptops and Lattes (within LifeMode Uptown Individuals)
General
- Households: 1,240,000
- Average household size: 1.85
- Median age: 36.9
- Median household income: $93,000
Who Are We?
Laptops and Lattes residents are predominantly single, well-educated professionals in business, finance, legal, computer, and entertainment occupations. They are affluent and partial to city living—and its amenities. Neighborhoods are densely populated, primarily located in the cities of large metropolitan areas. Many residents walk, bike, or use public transportation to get to work; a number of work from home. Although single householders technically outnumber couples, this market includes a higher proportion of partner households, including the highest proportion of same-sex couples. Residents are more interested in the stock market than the housing market. Laptops and Lattes residents are cosmopolitan and connected—technologically savvy consumers. They are active and health conscious, and care about the environment.
You can find the full profile with maps and graphs here: http://downloads.esri.com/esri_content_doc/dbl/us/tapestry/segment10.pdf
If you are marketing a product or service to well educated, 30-somethings, living in the city, and who are technically savvy, then this is your group. You would have to study all the profiles in each LifeMode to determine which ones fit your target audience. Or better yet if you have existing data on where your best customers are located then you can use GIS to determine the most represented LifeModes and Segments for your customers who spend the most money. This analysis will show you the top segments for your existing best customers. You can then focus your marketing dollars in those areas that contain your target LifeModes and Segments. Another way to work with Tapestry data is to aggregate the LifeModes and/or Segments by retail spending totals. This is particularly helpful to those in shopping center and retail businesses. For example, if you have a lifestyle center site and you want to show a retailer who the customers are in the surrounding area. You take the site and create a 10-mile radius, then you aggregate or take a summary table for the LifeModes in that radius by retail spending. What you then get is a table that details what LifeModes are the highest spenders in the 10-mile trade area. Of course, this does not account for tourists or anyone living outside the 10-mile radius for that matter, but it does give you a snapshot of the retail spending by LifeMode segment. Figure 2.1 is an example of grocery spending by LifeMode percentage. You can see here that the High Society LifeMode accounts for 30.42 percent of the grocery (or food at home) spending in the 8 minute drive time trade area.
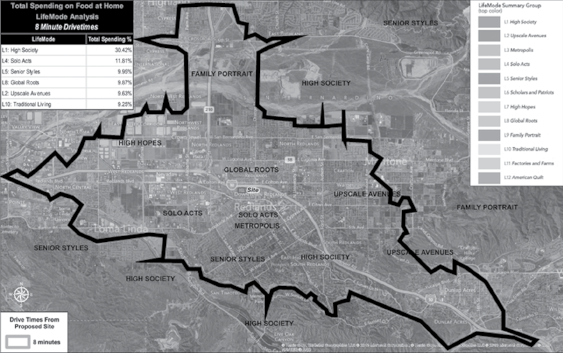
Figure 2.1 Total spending on food at home by LifeMode percentage
Directory of Major Malls is another data source to keep in mind if you are working in the shopping center sector. This data set contains the locations and information on all significant shopping places in America. Depending on your project needs you could use this data in a variety of ways. Since each location has the square footage you can use the GIS to visualize markets and see where the larger centers are located. Users can also use this data to compare the demographics of a potential shopping center site to the other centers in the market.
Data Sources (Links Current at Time of Publication)
FDIC: https://www2.fdic.gov/idasp/warp_download_all.asp
National Center for Education Statistics—Public Schools: http://nces.ed.gov/ccd/schoolsearch/
National Center for Education Statistics—Private Schools: http://nces.ed.gov/surveys/pss/privateschoolsearch/
Esri Tapestry: http://doc.arcgis.com/en/esri-demographics/data/tapestry-segmentation.htm#ESRI_SECTION1_87F5D845F8E04723AE1F4F502FF3B636
AggData: www.aggdata.com
Chain XY:chainxy.com
Chain Store Guide: https://chainstoreguide.com/
Directory of Major Malls: http://shoppingcenters.com/
Medicare Physician List: https://data.medicare.gov/Physician-Compare/National-Downloadable-File/s63f-csi6
Evaluate Your Software and 3rd Party Services Need
There are many GIS software packages out there for consideration and you need to choose carefully based on your project and data needs. I include data here again because many GIS software packages have various data packages included as well. I’m not going to go into all the packages, but I will give details on the package that I currently use when working with clients.
Here at Beitz and Daigh Geographics we use software and data (including demographic data) from Esri. As an Esri business partner, our location analytics solutions revolve around Esri technology. The desktop software package called Esri Business Analyst is an extremely powerful program. Business Analyst Desktop comes with demographic data and a large selection of tools to perform and display spatial analysis. Business Analyst Desktop also integrates with the web-based Esri ArcGIS Online. ArcGIS Online extends the desktop by providing literally thousands of base maps and data sources for use in the desktop GIS. ArcGIS Online also provides a web-based platform to share your GIS projects. Once you publish a project to ArcGIS Online then you can share that interactive map with other users who can access it via a computer, tablet, or other mobile device. ArcGIS Online also provides a good selection of analysis tools and “geo-enrichment” features. Geo-enrichment provides users the opportunities to add attributes to features. Attributes include items such as the slope of a property or the demographics of a radius. In addition to best in class demographics for the United States and Canada, Esri recently added a significant amount of international countries bringing the total amount of countries available to 137 at the time of the printing of this book.
Depending on the size of your project and the size of your organization you may want to outsource your entire project instead of investing in the software, data, and personnel. This decision is purely based on how often your organization will have to perform this analysis and if you want to develop this expertise in-house. If your core business is not GIS or location analytics focused or if you don’t have the funds to sustain a GIS department then you may want to select a location analytics partner to work with. Coming from the Esri world, I would recommend finding a good Esri Business Partner. Our group Beitz and Daigh Geographics would be happy to evaluate your project and if it doesn’t fit our profile then we would be happy to recommend another group for your organization to work with.
Getting Started
If you are over budget on your project, then consider a phased approach. Projects of this nature tend to get big at the beginning and often get stuck in “analysis paralysis.” The best way to move forward is to phase in the project into steps. Step one needs to be something that gets you going and provides some results that everyone can see. Then for phase 2 you have more information, and often this new information brings up new questions to ask. Phase 2 can be tweaked to incorporate your phase 1 findings, and then the project gets smarter as it moves forward.
After your project is complete, then you need to communicate your results and determine an action plan based on your findings. Often with location analytics projects your results will be map based or web-map based. By creating a web-map of the data created in your findings the stakeholders in the project have a way to explore the findings interactively. It’s also a good idea at this point to find a resulting actionable item from the study that can be used to benefit the business. By acting on your findings you can validate the purpose of the project. Then you can also incorporate the results of taking action into your next phase 2.