
Chapter 10: Real-Time Monitoring and Resource Management of a Kubernetes Cluster
The availability of services is one of the critical components of the Confidentiality, Integrity and Availability (CIA) triad. There have been many instances of malicious attackers using different techniques to disrupt the availability of services for users. Some of these attacks on critical infrastructure such as the electricity grid and banks have resulted in significant losses to the economy. One of the most significant attacks was an attack on Amazon AWS Route 53 infrastructure that resulted in the disruption of core IT services all over the world. To avoid such issues, infrastructure engineers monitor resource usage and application health in real time to ensure the availability of services offered by an organization. Real-time monitoring is often plugged into an alert system that notifies the stakeholders when symptoms of service disruption are observed.
In this chapter, we will look at how you can ensure that services in the Kubernetes cluster are always up and running. We will begin by discussing monitoring and resource management in monolith environments. Next, we will discuss resource requests and resource limits, two concepts at the heart of resource management in Kubernetes. We will then look at tools such as LimitRanger, which Kubernetes provides for resource management, before shifting our focus to resource monitoring. We will look at built-in monitors, such as Kubernetes Dashboard and Metrics Server. Finally, we will look at open source tools, such as Prometheus and Grafana, that can be used to monitor the state of a Kubernetes cluster.
In this chapter, we will discuss the following:
- Real-time monitoring and management in monolith environments
- Managing resources in Kubernetes
- Monitoring resources in Kubernetes
Real-time monitoring and management in monolith environments
Resource management and monitoring are important in monolith environments as well. In monolith environments, infrastructure engineers often pipe the output of Linux tools such as top, ntop, and htop to data visualization tools in order to monitor the state of VMs. In managed environments, built-in tools such as Amazon CloudWatch and Azure Resource Manager help to monitor resource usage.
In addition to resource monitoring, infrastructure engineers proactively allocate minimum resource requirements and usage limits for processes and other entities. This ensures that sufficient resources are available to services. Furthermore, resource management ensures that misbehaving or malicious processes do not hog resources and prevent other processes from working. For monolith deployments, resources such as CPU, memory, and spawned processes are capped for different processes. On Linux, process limits can be capped using prlimit:
$prlimit --nproc=2 --pid=18065
This command sets the limit of child processes that a parent process can spawn to 2. With this limit set, if a process with a PID of 18065 tries to spawn more than 2 child processes, it will be denied.
Similar to monolith environments, a Kubernetes cluster runs multiple pods, deployments, and services. If an attacker is able to spawn up Kubernetes objects such as pods or deployments, the attacker can cause a denial-of-service attack by depleting resources available in the Kubernetes cluster. Without adequate resource monitoring and resource management in place, unavailability of the services running in the cluster can cause an economic impact to the organization.
Managing resources in Kubernetes
Kubernetes provides the ability to proactively allocate and limit resources available to Kubernetes objects. In this section, we will discuss resource requests and limits, which form the basis for resource management in Kubernetes. Next, we explore namespace resource quotas and limit ranges. Using these two feature, clusters, administrators can cap the compute and storage limits available to different Kubernetes objects.
Resource requests and limits
kube-scheduler, as we discussed in Chapter 1, Kubernetes Architecture, is the default scheduler and runs on the master node. kube-scheduler finds the most optimal node for the unscheduled pods to run on. It does that by filtering the nodes based on the storage and compute resources requested for the pod. If the scheduler is not able to find a node for the pod, the pod will remain in a pending state. Additionally, if all the resources of the node are being utilized by the pods, kubelet on the node will clean up dead pods – unused images. If the cleanup does not reduce the stress, kubelet will start evicting those pods that consume more resources.
Resource requests specify what a Kubernetes object is guaranteed to get. Different Kubernetes variations or cloud providers have different defaults for resource requests. Custom resource requests for Kubernetes objects can be specified in the workload's specifications. Resource requests can be specified for CPU, memory, and HugePages. Let's look at an example of resource requests.
Let's create a pod without a resource request in the yaml specification, as follows:
apiVersion: v1
kind: Pod
metadata:
name: demo
spec:
containers:
- name: demo
The pod will use the default resource request for deployment:
$kubectl get pod demo —output=yaml
apiVersion: v1
kind: Pod
metadata:
annotations:
kubectl.kubernetes.io/last-applied-configuration: |
{"apiVersion":"v1","kind":"Pod","metadata":{"annotations":{},"name":"demo","namespace":"default"},"spec":{"containers":[{"image":"nginx","name":"demo"}]}}
kubernetes.io/limit-ranger: 'LimitRanger plugin set: cpu request for container
demo'
creationTimestamp: "2020-05-07T21:54:47Z"
name: demo
namespace: default
resourceVersion: "3455"
selfLink: /api/v1/namespaces/default/pods/demo
uid: 5e783495-90ad-11ea-ae75-42010a800074
spec:
containers:
- image: nginx
imagePullPolicy: Always
name: demo
resources:
requests:
cpu: 100m
For the preceding example, the default resource request is for 0.1 CPU cores for the pod. Let's now add a resource request to the .yaml specification and see what happens:
apiVersion: v1
kind: Pod
metadata:
name: demo
spec:
containers:
- name: demo
image: nginx
resources:
limits:
hugepages-2Mi: 100Mi
requests:
cpu: 500m memory: 300Mi hugepages-2Mi: 100Mi
This specification creates a pod with a resource request of 0.5 CPU cores, 300 MB, and hugepages-2Mi of 100 MB. You can check the resource request for a pod using the following command:
$kubectl get pod demo —output=yaml
apiVersion: v1
kind: Pod
metadata:
creationTimestamp: "2020-05-07T22:02:16Z"
name: demo-1
namespace: default
resourceVersion: "5030"
selfLink: /api/v1/namespaces/default/pods/demo-1
uid: 6a276dd2-90ae-11ea-ae75-42010a800074
spec:
containers:
- image: nginx
imagePullPolicy: Always
name: demo
resources:
limits:
hugepages-2Mi: 100Mi
requests:
cpu: 500m
hugepages-2Mi: 100Mi
memory: 300Mi
As you can see from the output, the pod uses a custom resource request of 0.5 CPU cores, 300 MB of memory, and 100 MB of 2 MB hugepages, instead of the default 1 MB.
Limits, on the other hand, are hard limits on the resources that the pod can use. Limits specify the maximum resources that a pod should be allowed to use. Pods are restricted if more resources are required than are specified in the limit. Similar to resource requests, you can specify limits for CPU, memory, and HugePages. Let's look at an example of limits:
$ cat stress.yaml
apiVersion: v1
kind: Pod
metadata:
name: demo
spec:
containers:
- name: demo
image: polinux/stress
command: ["stress"]
args: ["--vm", "1", "--vm-bytes", "150M", "--vm-hang", "1"]
This pod initiates a stress process that tries to allocate memory of 150M at startup. If no limits are specified in the .yaml specification, the pod runs without any issues:
$ kubectl create -f stress.yaml pod/demo created
$ kubectl get pods NAME READY STATUS RESTARTS AGE demo 1/1 Running 0 3h
Limits are added to the container section of the yaml specification for the pod:
containers:
- name: demo
image: polinux/stress
resources:
limits:
memory: "150Mi"
command: ["stress"]
args: ["--vm", "1", "--vm-bytes", "150M", "--vm-hang", "1"]
The stress process fails to run and the pod runs into CrashLoopBackOff:
$ kubectl get pods
NAME READY STATUS RESTARTS AGE
demo 1/1 Running 0 44s
demo-1 0/1 CrashLoopBackOff 1 5s
You can see that the pod was terminated with an OOMKilled error when you described the pod:
$ kubectl describe pods demo
Name: demo
Namespace: default
...
Containers:
demo:
Container ID: docker://a43de56a456342f7d53fa9752aa4fa7366 cd4b8c395b658d1fc607f2703750c2
Image: polinux/stress
Image ID: docker-pullable://polinux/stress@sha256:b61 44f84f9c15dac80deb48d3a646b55c7043ab1d83ea0a697c09097aaad21aa
...
Command:
stress
Args:
--vm
1
--vm-bytes
150M
--vm-hang
1
State: Waiting
Reason: CrashLoopBackOff
Last State: Terminated
Reason: OOMKilled
Exit Code: 1
Started: Mon, 04 May 2020 10:48:14 -0700
Finished: Mon, 04 May 2020 10:48:14 -0700
Resource requests and limits are converted, mapped to docker arguments – —cpu-shares and —memory flags – and passed to the container runtime.
We looked at examples of how resource requests and limits work for pods, but the same examples apply to DaemonSet, Deployments, and StatefulSets. Next, we look at how namespace resource quotas can help set an upper limit for the resources that can be used by namespaces.
Namespace resource quotas
Resource quotas for namespaces help define the resource requests and limits available to all objects within the namespace. Using resource quotas, you can limit the following:
- request.cpu: The maximum resource request for CPU for all objects in the namespace.
- request.memory: The maximum resource request for memory for all objects in the namespace.
- limit.cpu: The maximum resource limit for CPU for all objects in the namespace.
- limit.memory: The maximum resource limit for memory for all objects in the namespace.
- requests.storage: The sum of storage requests in a namespace cannot exceed this value.
- count: Resource quotas can also be used to limit the count of different Kubernetes objects in a cluster, including pods, services, PersistentVolumeClaims, and ConfigMaps.
By default, cloud providers or different variations have standard limits applied to the namespace. On Google Kubernetes Engine (GKE), the cpu request is set to 0.1 CPU cores:
$ kubectl describe namespace default
Name: default
Labels: <none>
Annotations: <none>
Status: Active
Resource Quotas
Name: gke-resource-quotas
Resource Used Hard
-------- --- ---
count/ingresses.extensions 0 100
count/jobs.batch 0 5k
pods 2 1500
services 1 500
Resource Limits
Type Resource Min Max Default Request Default Limit Max Limit/Request Ratio
---- -------- --- --- --------------- ------------- -----------------------
Container cpu - - 100m - -
Let's see an example of what happens when resource quotas are applied to a namespace:
- Create a namespace demo:
$ kubectl create namespace demo
namespace/demo created
- Define a resource quota. In this example, the quota limits the resource request CPU to 1 CPU:
$ cat quota.yaml
apiVersion: v1
kind: ResourceQuota
metadata:
name: compute-resources
spec:
hard:
requests.cpu: "1"
- Apply the quota to the namespace by using the following command:
$ kubectl apply -f quota.yaml --namespace demo
resourcequota/compute-resources created
- You can check whether the resource quota is applied successfully to the namespace by executing the following command:
$ kubectl describe namespace demo
Name: demo
Labels: <none>
Annotations: <none>
Status: Active
Resource Quotas
Name: compute-resources
Resource Used Hard
-------- --- ---
requests.cpu 0 1
Name: gke-resource-quotas
Resource Used Hard
-------- --- ---
count/ingresses.extensions 0 100
count/jobs.batch 0 5k
pods 0 1500
services 0 500
- Now, if we try to create two pods that use 1 CPU, the second request will fail with the following error:
$ kubectl apply -f nginx-cpu-1.yaml --namespace demo
Error from server (Forbidden): error when creating "nginx-cpu-1.yaml": pods "demo-1" is forbidden: exceeded quota: compute-resources, requested: requests.cpu=1, used: requests.cpu=1, limited: requests.cpu=1
Resource quotas ensure quality of service for namespaced Kubernetes objects.
LimitRanger
We discussed the LimitRanger admission controller in Chapter 7, Authentication, Authorization, and Admission Control. Cluster administrators can leverage limit ranges to ensure that misbehaving pods, containers, or PersistentVolumeClaims don't consume all available resources.
To use limit ranges, enable the LimitRanger admission controller:
$ ps aux | grep kube-api
root 3708 6.7 8.7 497216 345256 ? Ssl 01:44 0:10 kube-apiserver --advertise-address=192.168.99.116 --allow-privileged=true --authorization-mode=Node,RBAC --client-ca-file=/var/lib/minikube/certs/ca.crt --enable-admission-plugins=NamespaceLifecycle,LimitRanger,ServiceAccount,DefaultStorageClass,DefaultTolerationSeconds,NodeRestriction,MutatingAdmissionWebhook,ValidatingAdmissionWebhook,ResourceQuota
Using LimitRanger, we can enforce default, min, and max limits on storage and compute resources. Cluster administrators create a limit range for objects such as pods, containers, and PersistentVolumeClaims. For any request for object creation or update, the LimitRanger admission controller verifies that the request does not violate any limit ranges. If the request violates any limit ranges, a 403 Forbidden response is sent.
Let's look at an example of a simple limit range:
- Create a namespace in which a limit range will be applied:
$kubectl create namespace demo
- Define a LimitRange for the namespace:
$ cat limit_range.yaml
apiVersion: "v1"
kind: "LimitRange"
metadata:
name: limit1
namespace: demo
spec:
limits:
- type: "Container"
max:
memory: 512Mi
cpu: 500m
min:
memory: 50Mi
cpu: 50m
- Verify that the limitrange was applied:
$ kubectl get limitrange -n demo
NAME CREATED AT
limit1 2020-04-30T02:06:18Z
- Create a pod that violates the limit range:
$cat nginx-bad.yaml
apiVersion: v1
kind: Pod
metadata:
name: nginx-bad
spec:
containers:
- name: nginx-bad
image: nginx-bad
resources:
limits:
memory: "800Mi"
cpu: "500m"
This request will be denied:
$ kubectl apply -f nginx-bad.yaml -n demo
Error from server (Forbidden): error when creating "nginx-bad.yaml": pods "nginx-bad" is forbidden: maximum memory usage per Container is 512Mi, but limit is 800M
If a LimitRanger specifies a CPU or memory, all pods and containers should have the CPU or memory request or limits. LimitRanger works when the request to create or update the object is received by the API Server but not at runtime. If a pod has a violating limit before the limit is applied, it will keep running. Ideally, limits should be applied to the namespace when it is created.
Now that we have looked at a couple of features that can be used for proactive resource management, we switch gears and look at tools that can help us monitor the cluster and notify us before matters deteriorate.
Monitoring resources in Kubernetes
As we discussed earlier, resource monitoring is an essential step for ensuring the availability of your services in your cluster. Resource monitoring uncovers early signs or symptoms of service unavailability in your clusters. Resource monitoring is often complemented with alert management to ensure that stakeholders are notified as soon as any problems, or symptoms associated with any problems, in the cluster are observed.
In this section, we first look at some built-in monitors provided by Kubernetes, including Kubernetes Dashboard and Metrics Server. We look at how we can set it up and discuss how to use these tools efficiently. Next, we look at some open source tools that can plug into your Kubernetes cluster and provide far more in-depth insight than the built-in tools.
Built-in monitors
Let's look at some tools provided by Kubernetes that are used for monitoring Kubernetes resources and objects – Metrics Server and Kubernetes Dashboard.
Kubernetes Dashboard
Kubernetes Dashboard provides a web UI for cluster administrators to create, manage, and monitor cluster objects and resources. Cluster administrators can also create pods, services, and DaemonSets using the dashboard. The dashboard shows the state of the cluster and any errors in the cluster.
Kubernetes Dashboard provides all the functionality a cluster administrator requires in order to manage resources and objects within the cluster. Given the functionality of the dashboard, access to the dashboard should be limited to cluster administrators. The dashboard has a login functionality starting v1.7.0. In 2018, a privilege escalation vulnerability (CVE-2018-18264) was identified in the dashboard that allowed unauthenticated users to log in to the dashboard. There were no known in-the-wild exploits for this issue, but this simple vulnerability could have wreaked havoc on many Kubernetes distributions.
Current login functionality allows logging in using a service account and kubeconfig. It is recommended that service account tokens should be used to access Kubernetes Dashboard:

Figure 10.1 – Kubernetes Dashboard
To allow a service account to use the Kubernetes dashboard, you need to add the cluster-admin role to the service account. Let's look at an example of how a service account can be used to access the Kubernetes dashboard:
- Create a service account in the default namespace:
$kubectl create serviceaccount dashboard-admin-sa
- Associate the cluster-admin role with the service account:
$kubectl create clusterrolebinding dashboard-admin-sa --clusterrole=cluster-admin --serviceaccount=default:dashboard-admin-sa
- Fetch the token for the service account:
$ kubectl describe serviceaccount dashboard-admin-sa
Name: dashboard-admin-sa
Namespace: default
Labels: <none>
Annotations: <none>
Image pull secrets: <none>
Mountable secrets: dashboard-admin-sa-token-5zwpw
Tokens: dashboard-admin-sa-token-5zwpw
Events: <none>
- Use the following command to fetch the token for the service account:
$ kubectl describe secrets dashboard-admin-sa-token-5zwpw
Name: dashboard-admin-sa-token-5zwpw
Namespace: default
Labels: <none>
Annotations: kubernetes.io/service-account.name: dashboard-admin-sa
kubernetes.io/service-account.uid: 83218a92-915c-11ea-b763-42010a800022
Type: kubernetes.io/service-account-token
Data
====
ca.crt: 1119 bytes
namespace: 7 bytes
token: <token>
- Use the service account token to log in to the dashboard:

Figure 10.2 – Kubernetes dashboard login
Using Kubernetes Dashboard, administrators have insight into resource availability, resource allocation, Kubernetes objects, and event logs:
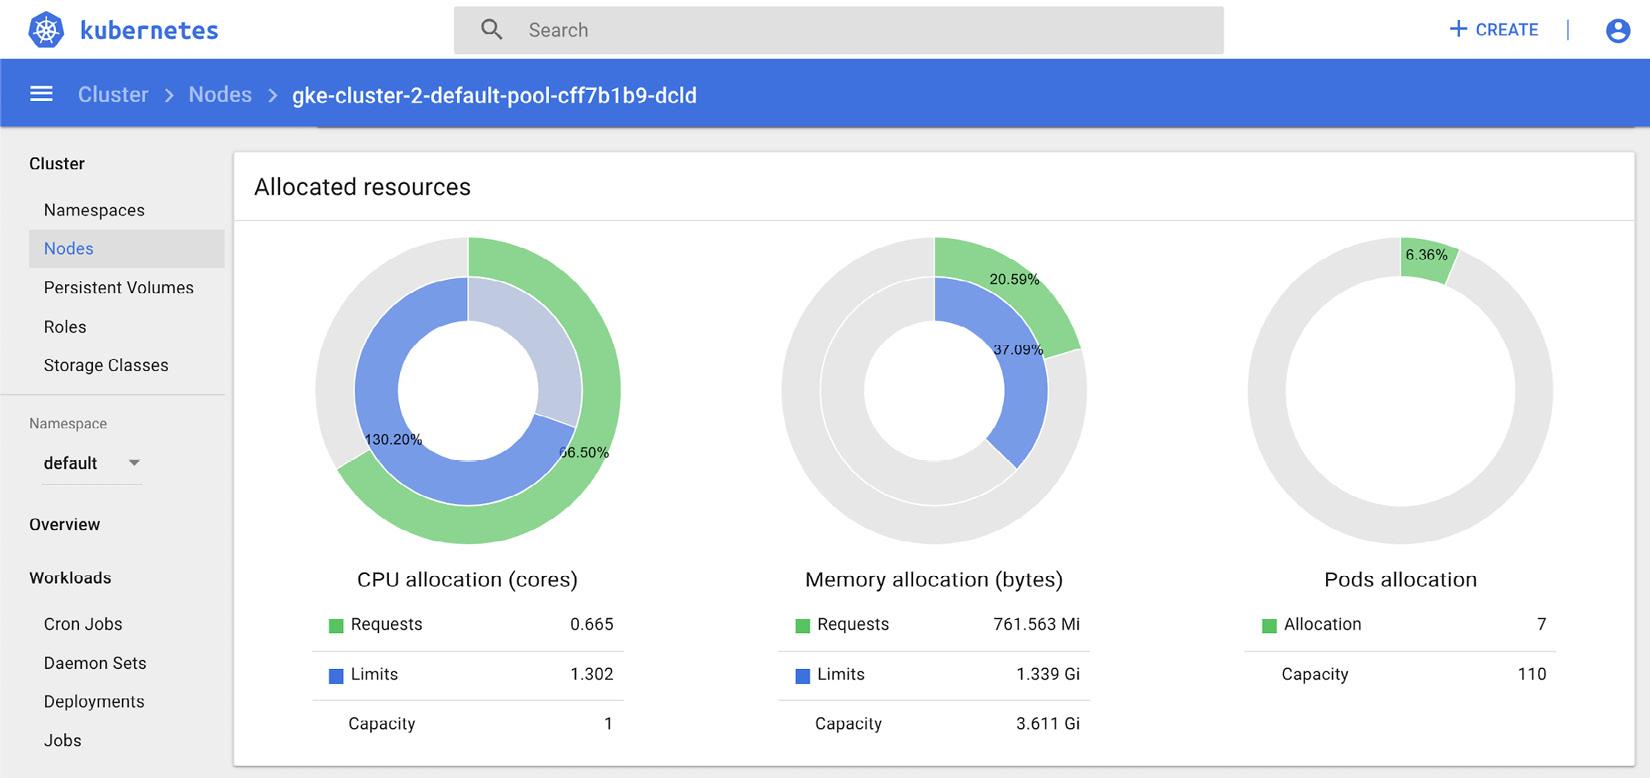
Figure 10.3 – Kubernetes Dashboard – resource allocation
The preceding screenshot shows resource allocation on a node for resource requests and limits. The following screenshot highlights the events for a node on the Kubernetes dashboard:
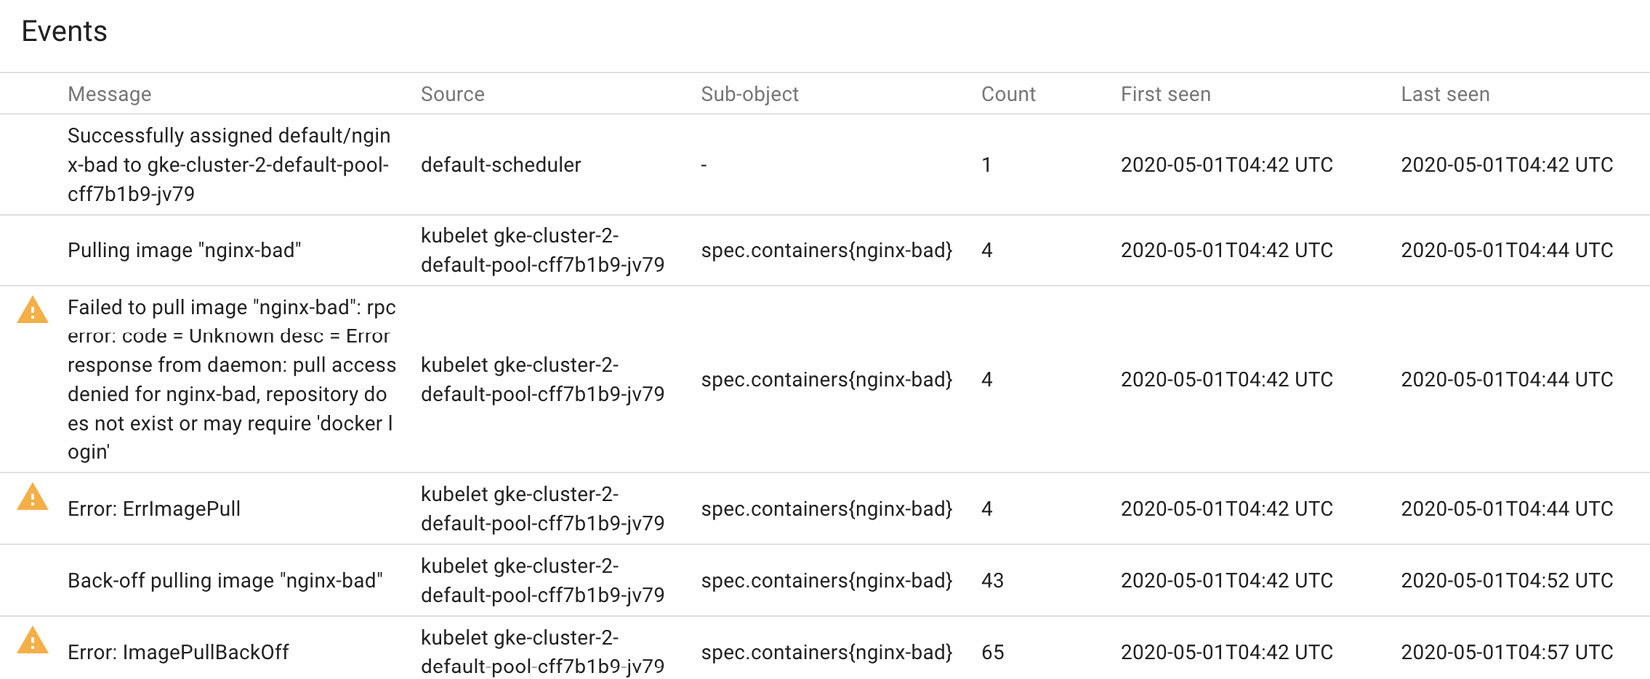
Figure 10.4 – Kubernetes Dashboard – event logs
Kubernetes Dashboard runs as a container on the master node. You can see this by enumerating the Docker containers on the master node:
$ docker ps | grep dashboard
a963e6e6a54b 3b08661dc379 "/metrics-sidecar" 4 minutes ago Up 4 minutes k8s_dashboard-metrics-scraper_dashboard-metrics-scraper-84bfdf55ff-wfxdm_kubernetes-dashboard_5a7ef2a8-b3b4-4e4c-ae85-11cc8b61c1c1_0
c28f0e2799c1 cdc71b5a8a0e "/dashboard --insecu…" 4 minutes ago Up 4 minutes k8s_kubernetes-dashboard_kubernetes-dashboard-bc446cc64-czmn8_kubernetes-dashboard_40630c71-3c6a-447b-ae68-e23603686ede_0
10f0b024a13f k8s.gcr.io/pause:3.2 "/pause" 4 minutes ago Up 4 minutes k8s_POD_dashboard-metrics-scraper-84bfdf55ff-wfxdm_kubernetes-dashboard_5a7ef2a8-b3b4-4e4c-ae85-11cc8b61c1c1_0
f9c1e82174d8 k8s.gcr.io/pause:3.2 "/pause" 4 minutes ago Up 4 minutes k8s_POD_kubernetes-dashboard-bc446cc64-czmn8_kubernetes-dashboard_40630c71-3c6a-447b-ae68-e23603686ede_0
The dashboard process runs with a set of arguments on the master node:
$ ps aux | grep dashboard
dbus 10727 0.9 1.1 136752 46240 ? Ssl 05:46 0:02 /dashboard --insecure-bind-address=0.0.0.0 --bind-address=0.0.0.0 --namespace=kubernetes-dashboard --enable-skip-login --disable-settings-authorizer
docker 11889 0.0 0.0 11408 556 pts/0 S+ 05:51 0:00 grep dashboard
Ensure that the dashboard container is running with the following arguments:
- Disable insecure port: --insecure-port enables Kubernetes Dashboard to receive requests over HTTP. Ensure that it is disabled in production environments.
- Disable insecure address: --insecure-bind-address should be disabled to avoid a situation where Kubernetes Dashboard is accessible via HTTP.
- Bind address to localhost: --bind-address should be set to 127.0.0.1 to prevent hosts from being connected over the internet.
- Enable TLS: Use tls-cert-file and tls-key-file to access the dashboard over secure channels.
- Ensure token authentication mode is enabled: Authentication mode can be specified using the --authentication-mode flag. By default, it is set to token. Ensure that basic authentication is not used with the dashboard.
- Disable insecure login: Insecure login is used when the dashboard is available via HTTP. This should be disabled by default.
- Disable skip login: Skip login allows unauthenticated users to access the Kubernetes dashboard. --enable-skip-login enables skip login; this should not be present in production environments.
- Disable settings authorizer: --disable-settings-authorizer allows unauthenticated users to access the settings page. This should be disabled in production environments.
Metrics Server
Metrics Server aggregates cluster usage data using the Summary API exposed by each kubelet on each node. It is registered with kube-apiserver using kube-aggregator. Metrics Server exposes the collected metrics through the Metrics API, which are used by the horizontal pod autoscalar and the vertical pod autoscalar. kubectl top, which is used to debug clusters, also uses the Metrics API. Metrics Server is specifically designed for autoscaling.
Metrics Server is enabled by default on some Kubernetes distributions. You can enable it on minikube by using the following command:
$ minikube addons enable metrics-server
You can check whether Metrics Server is enabled by using the following command:
$ kubectl get apiservices | grep metrics
v1beta1.metrics.k8s.io kube-system/metrics-server True 7m17s
Once Metrics Server is enabled, it takes some time to query the Summary API and co-relate the data. You can see the current metrics by using kubectl top node:
$ kubectl top node
NAME CPU(cores) CPU% MEMORY(bytes) MEMORY%
minikube 156m 7% 1140Mi 30%
$ kubectl top pod
NAME CPU(cores) MEMORY(bytes)
nginx-good 0m 2Mi
Similar to other services and components, Metrics Server also has configuration parameters. In production clusters, make sure that Metrics Server does not use the --kubelet-insecure-tls flag, which allows Metrics Server to skip verification of certificates by the CA.
Third-party monitoring tools
Third-party monitoring tools integrate in Kubernetes to provide many more features and insights into the health of Kubernetes resources. In this section, we will discuss Prometheus and Grafana, which are the most popular monitoring tools in the open source community.
Prometheus and Grafana
Prometheus is an open source instrumentation and data collection framework developed by SoundCloud and adopted by CNCF. Prometheus can be used to see time series data for different data points. Prometheus uses a pull system. It sends an HTTP request called a scrape, which fetches data from the system components, including API Server, node-exporter, and kubelet. The response to the scrape and the metrics are stored in a custom database on the Prometheus server.
Let's see how Prometheus can be set up to monitor a namespace in Kubernetes:
- Create a namespace:
$kubectl create namespace monitoring
- Define a cluster role to read Kubernetes objects such as pods, nodes, and services and add the role binding to a service account. In this example, we are using the default service account:
$ cat prometheus-role.yaml
apiVersion: rbac.authorization.k8s.io/v1beta1
kind: ClusterRole
metadata:
name: prometheus
rules:
- apiGroups: [""]
resources:
- nodes
- nodes/proxy
- services
- endpoints
- pods
verbs: ["get", "list", "watch"]
- apiGroups:
- extensions
resources:
- ingresses
verbs: ["get", "list", "watch"]
- nonResourceURLs: ["/metrics"]
verbs: ["get"]
$ kubectl create -f prometheus-role.yaml
clusterrole.rbac.authorization.k8s.io/prometheus created
Now, we create a role binding to associate the role with the default service account:
$ cat prometheus-rolebinding.yaml
apiVersion: rbac.authorization.k8s.io/v1beta1
kind: ClusterRoleBinding
metadata:
name: prometheus
roleRef:
apiGroup: rbac.authorization.k8s.io
kind: ClusterRole
name: prometheus
subjects:
- kind: ServiceAccount
name: default
namespace: monitoring
- Prometheus uses ConfigMap to specify the scrape rule. The following rule-scrapes the kube-apiserver. Multiple scraps can be defined to fetch metrics:
$ cat config_prometheus.yaml apiVersion: v1
kind: ConfigMap
metadata:
name: prometheus-server-conf
labels:
name: prometheus-server-conf
namespace: monitoring
data:
prometheus.yml: |-
global:
scrape_interval: 5s
evaluation_interval: 5s
scrape_configs: - job_name: 'kubernetes-apiservers'
kubernetes_sd_configs:
- role: endpoints
scheme: https
tls_config:
ca_file: /var/run/secrets/kubernetes.io/serviceaccount/ca.crt
bearer_token_file: /var/run/secrets/kubernetes.io/serviceaccount/token
relabel_configs:
- source_labels: [__meta_kubernetes_namespace, __meta_kubernetes_service_name, __meta_kubernetes_endpoint_port_name]
action: keep
regex: default;kubernetes;https
- Create a deployment for Prometheus:
spec:
containers:
- name: prometheus
image: prom/prometheus:v2.12.0
args:
- "--config.file=/etc/prometheus/prometheus.yml"
- "--storage.tsdb.path=/prometheus/"
ports:
- containerPort: 9090
volumeMounts:
- name: prometheus-config-volume
mountPath: /etc/prometheus/
- name: prometheus-storage-volume
mountPath: /prometheus/
volumes:
- name: prometheus-config-volume
configMap:
defaultMode: 420
name: prometheus-server-conf
- name: prometheus-storage-volume
emptyDir: {}
- Once deployment is successful, port forwarding or Kubernetes services can be used to access the dashboard:
$ kubectl port-forward <prometheus-pod> 8080:9090 -n monitoring
This enables port forwarding for the Prometheus pod. Now, you can access it using the cluster IP on port 8080:

Figure 10.5 – Prometheus Dashboard
Queries can be entered as expressions and the results viewed as Graph or Console messages. Using Prometheus queries, cluster administrators can view the status of clusters, nodes, and services that are being monitored by Prometheus.
Let's look at some examples of Prometheus queries that will be helpful for cluster administrators:
- Kubernetes CPU usage:
sum(rate(container_cpu_usage_seconds_total{container_name!="POD",pod_name!=""}[5m]))
- Kubernetes CPU usage by namespace:
sum(rate(container_cpu_usage_seconds_total{container_name!="POD",namespace!=""}[5m])) by (namespace)
- CPU requests by pod:
sum(kube_pod_container_resource_requests_cpu_cores) by (pod)
Let's look at CPU usage by namespace for the demo cluster:

Figure 10.6 – CPU usage by namespace
Prometheus also allows cluster administrators to set alerts using ConfigMaps:
prometheus.rules: |-
groups:
- name: Demo Alert
rules:
- alert: High Pod Memory
expr: sum(container_memory_usage_bytes{pod!=""}) by (pod) > 1000000000
for: 1m
labels:
severity: high
annotations:
summary: High Memory Usage
This alert triggers an alert with a label severity of high when container memory usage is greater than 1000 MB for 1 minute:

Figure 10.7 – Prometheus Alerts
Using Alertmanager with Prometheus helps deduplicate, group, and route alerts from applications such as Prometheus and route it to integrated clients, including email, OpsGenie, and PagerDuty.
Prometheus integrates well with other third-party tools that enhance data visualization and alert management. Grafana is one such tool. Grafana allows visualization, querying, and alerting on data retrieved from Prometheus.
Let's now look at how we set up Grafana with Prometheus:
- Grafana needs a data source for ingestion; in this case, it is Prometheus. The data source can be added using the UI or can be specified using a ConfigMap:
$ cat grafana-data.yaml apiVersion: v1
kind: ConfigMap
metadata:
name: grafana-datasources
namespace: monitoring
data:
prometheus.yaml: |-
{
"apiVersion": 1,
"datasources": [
{
"access":"proxy",
"editable": true,
"name": "prometheus",
"orgId": 1,
"type": "prometheus",
"url": "http://192.168.99.128:30000",
"version": 1
}
]
}
- Create a deployment for Grafana:
apiVersion: apps/v1
kind: Deployment
metadata:
name: grafana
namespace: monitoring
spec:
replicas: 1
selector:
matchLabels:
app: grafana
template:
metadata:
name: grafana
labels:
app: grafana
spec:
containers:
- name: grafana
image: grafana/grafana:latest
ports:
- name: grafana
containerPort: 3000
volumeMounts:
- mountPath: /var/lib/grafana
name: grafana-storage
- mountPath: /etc/grafana/provisioning/datasources
name: grafana-datasources
readOnly: false
volumes:
- name: grafana-storage
emptyDir: {}
- name: grafana-datasources
configMap:
name: grafana-datasources
- Port forwarding or Kubernetes services can then be used to access the dashboard:
apiVersion: v1
kind: Service
metadata:
name: grafana
namespace: monitoring
annotations:
prometheus.io/scrape: 'true'
prometheus.io/port: '3000'
spec:
selector:
app: grafana
type: NodePort
ports:
- port: 3000
targetPort: 3000
nodePort: 32000
- The dashboard, by default, has admin as a username and password. Once logged in, you can either set up a new dashboard or import one from Grafana. To import one, you can click + > Import, where you will be presented with the following screen. Enter 315 in the first textbox to import dashboard 315 from Grafana:

Figure 10.8 – Importing a dashboard in Grafana
- This dashboard was created by Instrumentisto Team. On import, all fields on the next screen will be filled up automatically:
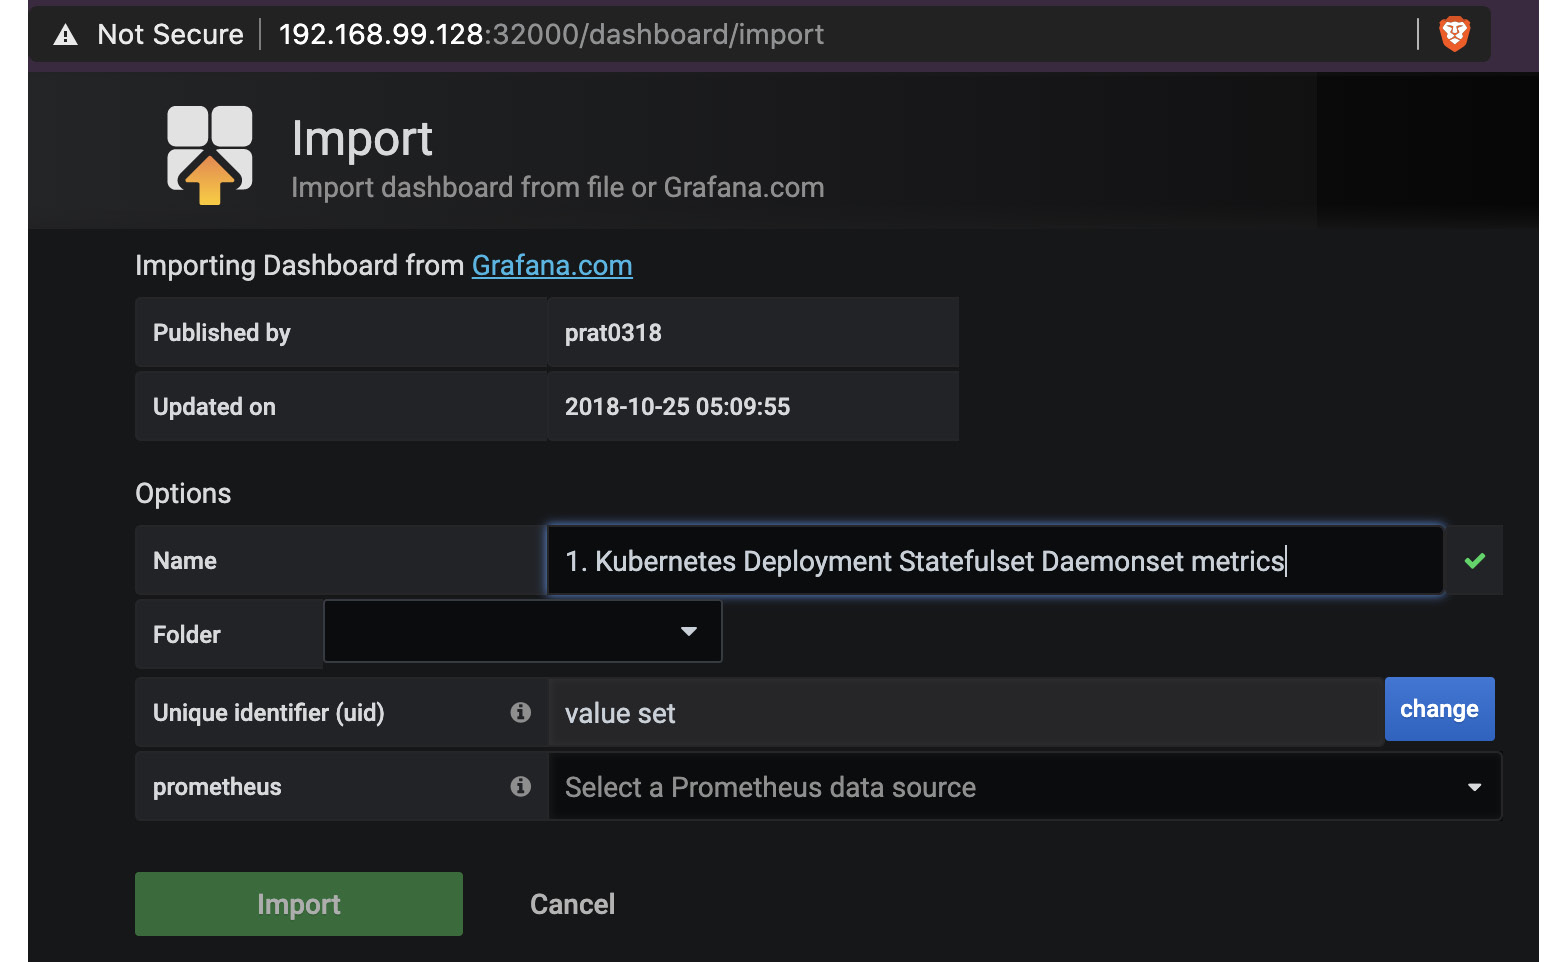
Figure 10.9 – Grafana Dashboard – 315
- A new dashboard can also be created with custom Prometheus queries:

Figure 10.10 – Custom dashboard
- Similar to Prometheus, you can set up alerts on each dashboard:

Figure 10.11 – New alerts in Grafana
There are other tools that integrate with Prometheus that make it such a valuable tool for DevOps and cluster administrators.
Summary
In this chapter, we discussed availability as an important part of the CIA triad. We discussed the importance of resource management and real-time resource monitoring from a security standpoint. We then introduced resource requests and limits, core concepts for resource management in Kubernetes. Next, we discussed resource management and how cluster administrators can proactively ensure that Kubernetes objects can be prevented from misbehaving.
We dived deep into the details of namespace resource quotas and limit ranges and looked at examples on how to set it up. We then shifted gears to resource monitoring. We looked at some built-in monitors that are available as part of Kubernetes, including Dashboard and Metrics Server. Finally, we looked at a number of third-party tools – Prometheus and Grafana – that are much more powerful and preferred by most cluster administrators and DevOps engineers.
Using resource management, cluster administrators can ensure that services in a Kubernetes cluster have sufficient resources available for operation and that malicious or misbehaving entities don't hog all the resources. Resource monitoring, on the other hand, helps to identify issues and the symptoms in real time. With alert management used in conjunction with resource monitoring, stakeholders are notified of symptoms, such as reduced disk space or high memory consumption, as soon as they occur, ensuring that downtime is minimal.
In the next chapter, we will discuss Defense in Depth in detail. We will look at how cluster administrators and DevOps engineers can supplement secure configuration, resource management, and resource monitoring with a layered approach to security. Defense in Depth will introduce more toolkits to ensure that attacks are easily detected and mitigated in production environments.
Questions
- What is the difference between a resource request and limits?
- Define a resource quota that limits the memory limit to 500 mi.
- How does limit-range differ from resource-quotas?
- What is the recommended authentication method for Kubernetes Dashboard?
- Which is the most widely recommended resource monitoring tool?
Further references
You can refer to the following links for more information on topics covered in this chapter:
- Denial-of-service attacks on electrical systems: https://www.cnbc.com/2019/05/02/ddos-attack-caused-interruptions-in-power-system-operations-doe.html
- Amazon Route53 DDoS: https://www.cpomagazine.com/cyber-security/ddos-attack-on-amazon-web-services-raises-cloud-safety-concerns/
- Limit Ranger design documentation: https://github.com/kubernetes/community/blob/master/contributors/design-proposals/resource-management/admission_control_limit_range.md
- Kubernetes Dashboard: https://github.com/kubernetes/dashboard/blob/master/docs/README.md
- Privilege escalation using Kubernetes Dashboard: https://sysdig.com/blog/privilege-escalation-kubernetes-dashboard/
- Metrics Server: https://github.com/kubernetes-sigs/metrics-server
- Aggregated API servers: https://github.com/kubernetes/community/blob/master/contributors/design-proposals/api-machinery/aggregated-api-servers.md
- Prometheus queries: https://prometheus.io/docs/prometheus/latest/querying/examples/
- Grafana documentation: https://grafana.com/docs/grafana/latest/