Chapter 5. Observability
Observability, the ability to monitor services and examine traces, is a critically important architectural capability for any event-driven distributed system. Knative leverages Istio as one of its ingress and gateway implementations. The Istio control plane has the ability to collect the telemetric information. If a few extra components—Prometheus, Grafana, and Jaeger—are installed in the cluster, then Istio is configured to send the information to them automatically. Thus, observability in Knative can be achieved by simply deploying Prometheus, Grafana, and Jaeger into your Kubernetes cluster.
In this chapter, we will explore how to deploy the observability components, gather the metrics, and explore the traces of Knative-based applications.
Before You Begin
All the recipes in this chapter will be executed from the directory $BOOK_HOME/advanced/observability, so change to the recipe directory by running:
$cd$BOOK_HOME/advanced/observability
The recipes in this chapter will deployed in the chapter-5 namespace, so switch to the chapter-5 namespace with the following command:
$kubectlconfigset-context--current--namespace=chapter-5
5.1 Deploying Prometheus and Grafana
Solution
Prometheus is used to collect metrics such as memory and CPU usage from your pods and services. The collected data can then be visualized using Grafana dashboards.
You can deploy Prometheus and Grafana using the script install-prometheus-grafana.sh:
$$BOOK_HOME/install/observability/install-prometheus-grafana.sh
It will take a few minutes for the components to be installed, and you can monitor the installation progress by watching the pods in the knative-monitoring namespace:
$watchkubectl-nknative-monitoringgetpodsNAMEREADYSTATUSAGEgrafana-5b59764965-nrms91/1Running84skube-state-metrics-5df8bcfdd5-2tksl1/1Running85snode-exporter-k62nn2/2Running84sprometheus-system-01/1Running84sprometheus-system-11/1Running84s
Discussion
One of the ways to access the Prometheus dashboard is to use Kubernetes NodePort. The Prometheus service by default is accessible only within the cluster; hence, you need to run the following command to expose the Prometheus service using NodePort:
$kubectlexposesvc-nknative-monitoringprometheus-system-discovery--type=NodePort--name=prometheus-external
Once you have exposed the Prometheus service via NodePort, you can access its dashboard via your web browser using the command:
$minikubesvc-nknative-monitoringprometheus-external
The command will open the Prometheus dashboard as shown in Figure 5-1 in a new browser window.
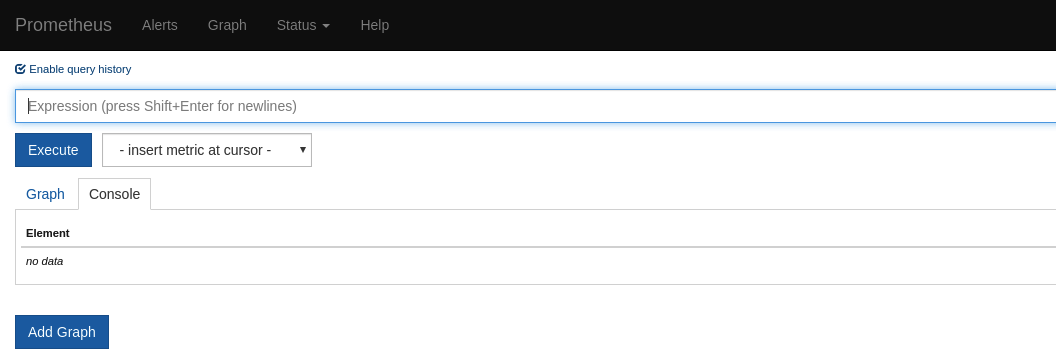
Figure 5-1. Prometheus dashboard
To open the Grafana dashboard you can use the NodePort of the Grafana service. To discover the URL of the service, run the following command:
$minikubeservice-nknative-monitoringgrafana
This command will open the Grafana dashboard in your browser, as shown in Figure 5-2.
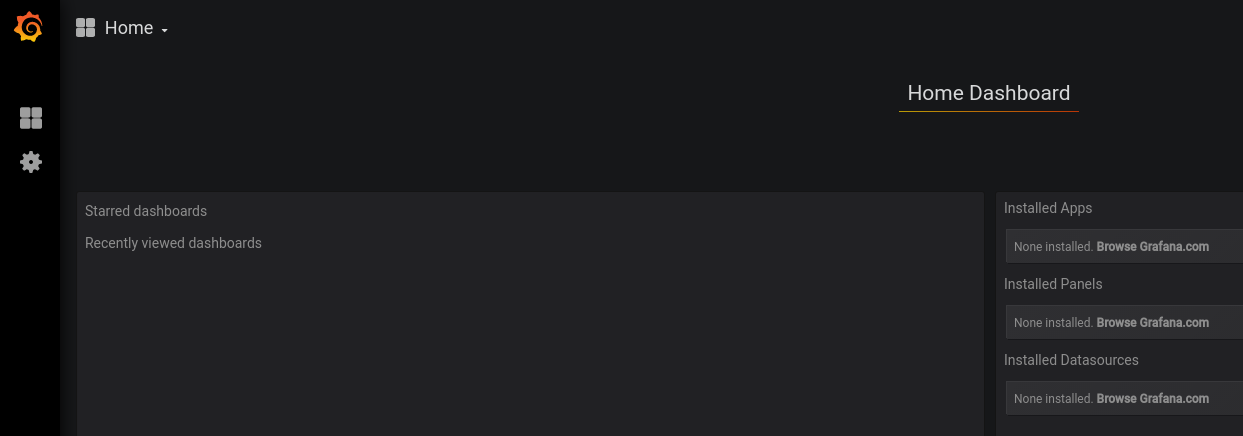
Figure 5-2. Grafana dashboard
Having successfully installed Prometheus, Knative will not automatically collect and display the telemetry information gathered using Prometheus. The following recipe shows how to configure Knative to allow the use of metrics collected via Prometheus.
5.2 Enable Prometheus for Metrics Collection
Solution
The metrics-related configurations are stored in a ConfigMap called config-observability in the knative-serving namespace. You need to patch the ConfigMap to collect metrics from your Knative pods.
Running the following patch command will update the Knative ConfigMap config-observability to use Prometheus for metrics collection:
$kubectl-nknative-servingpatchcmconfig-observability--patch"$(catconfig-observability-patch.yaml)"
Discussion
You need to verify if the patch has been successfully applied. To verify, run:
$kubectl-nknative-servinggetcmconfig-observability-oyaml
The verification command will show the following YAML output (output trimmed for brevity):
1apiVersion:v12data:3metrics.request-metrics-backend-destination:prometheus4kind:ConfigMap5metadata:6name:config-observability7namespace:knative-serving

Configures Knative to use Prometheus as the backend for metrics
5.3 Installing Jaeger
Solution
Jaeger can be used to perform end-to-end distributed tracing by propagating x-b3 headers as part of the HTTP requests.
To install Jaeger you should use its Operator. We have provided a script that automates the installation of the operator:
$$BOOK_HOME/install/observability/install-jaeger.sh
It will take a few minutes for the operator to be installed. You can monitor its progress by watching the pods in the observability namespace:
$watchkubectl-nobservabilitygetpodsNAMEREADYSTATUSAGEjaeger-operator-7b944bbb5b-gc9kp1/1Running64s
Next, deploy the instance of Jaeger with the following script:
$$BOOK_HOME/install/observability/deploy-jaeger.sh
Jaeger will be deployed in the istio-system namespace. You can watch the status of the pods in the istio-system namespace with the following command:
$watchkubectl-nistio-systemgetpodsNAMEREADYSTATUSAGEcluster-local-gateway-777dc6949c-qrn8t1/1Running71mistio-ingressgateway-6dfbbb4d95-nlw421/1Running71mistio-pilot-7bc854755d-s9rxk1/1Running71mjaeger-54bdd77545-j2v8c1/1Running15s
Discussion
Like Prometheus, the Jaeger service is not exposed outside of the cluster. We need to expose it using the NodePort to be able to access it from the minikube host. Run the following command to expose Jaeger via NodePort:
$kubectlexposesvc-nistio-systemjaeger-query--type=NodePort--name=jaeger-external
Once you have exposed the Jaeger service via NodePort, you can access its dashboard via your web browser using the command:
$minikubeservice-nistio-systemjaeger-external
This command will open the Jaeger dashboard as shown in Figure 5-3.

Figure 5-3. Jaeger dashboard
Now that you have your monitoring and tracing services ready to use, it is time to deploy and create load on some Knative Services.
5.4 Deploying Observable Test Services
Solution
In this recipe, you will deploy three Knative Services—customer, preference, and recommendation—and these services will be used in viewing the data collected as part of Knative observability.
Customer is an edge service that is configured to call preference, and preference will call recommendation: customer → preference → recommendation.
The customer service is an always-on service, so its minScale is configured to be 1; on the other hand, the preference service is configured to handle a maximum of 10 concurrent requests only and the recommendation service is left to the default Knative autoscaling configuration:
$kubectlapply-nchapter-5-fcustomer.yaml-fpreference.yaml-frecommendation.yaml
Discussion
It will take a few minutes for the services to be deployed. You can watch the pods in
the chapter-5 namespace:
$watchkubectlgetpodsNAMEREADYSTATUSAGEcustomer-gdrq8-deployment-6cd46d7c7c-mksx92/2Running6spreference-g5g7h-deployment-598696f89f-4j4bl2/2Running6srecommendation-96dxc-deployment-5df6945587-rnqwl2/2Running6s
Let’s query Knative Serving to see the deployed service URL as shown here:
$ watch kubectl -n chapter-5 get ksvc
NAME             URL                                                READY
customer         http://customer.chapter-5.svc.example.com          True
preference       http://preference.chapter-5.svc.cluster.local      True
recommendation   http://recommendation.chapter-5.svc.cluster.local  True
Tip
Try running the PromQL: container_memory_rss{namespace="chapter-5",container_name="user-container"} in the Prometheus dashboard to see how much resident set size (RSS)—that is, the nondisk memory such as heap, stack etc.—each test application container consumes.
5.5 Customizing the kubectl Output Columns
Solution
The output in the previous listing was generated using the kubectl output option custom columns file.
To generate the output as shown in the previous listing, create a text file called csv-columns.txt with the following content:
NAMEURLREADY.metadata.name.status.url.status.conditions[0].status
The column headers that will be shown in the output

The values corresponding to each column. The values can be discovered via
kubectl get ksvc <ksvc-name> -o yaml.
Discussion
In many cases you may want to trim the output columns that are returned by a kubectl command. This is useful when you want to look into only a small, specific piece of information from a bigger output.
Let’s take an example where you want to view only the Knative Service URL (Knative Route) and its READY state from the bigger kubectl get ksvc output. In those cases, you can use the csv-columns.txt file to trim the output and receive a customized output.
Before viewing the customized output try running kubectl get ksvc, observe the output, and then run the following command to appreciate the utility of using custom columns:
$ kubectl get ksvc --output=custom-columns-file=csv-columns.txt
You should notice that preference and recommendation have slightly different URLs than customer. Recipe 5.6 will explain why.
5.6 Restricting Knative Service Visibility
Problem
You want to restrict service visibility and separate services that are to be consumed outside the cluster versus services that are for internal purposes. In the case of the provided example services, customer is the edge service and therefore public, but preference and recommendation are only for invocation inside the cluster.
Solution
Knative Serving provides the label serving.knative.dev/visibility to alert the Knative Serving controller to only create local routes.
Discussion
By default, Knative Services are exposed as public routes; however, the label serving.knative.dev/visibility can be applied to the service YAML and results in a cluster.local route being generated:
apiVersion:serving.knative.dev/v1alpha1kind:Servicemetadata:name:preferencelabels:serving.knative.dev/visibility:"cluster-local"spec:template:metadata:annotations:autoscaling.knative.dev/target:"10"spec:containers:-image:quay.io/rhdevelopers/istio-tutorial-preference:v1env:-name:"COM_REDHAT_DEVELOPER_DEMOS_CUSTOMER_REST_RECOMMENDATIONSERVICE_MP_REST_URL"value:"http://recommendation.knativetutorial.svc.cluster.local"
This label will result in a local route for the
ksvc:http://preference.chapter-5.svc.cluster.local.
When you list your Knative Routes you will see that preference and recommendation have local routes with the domain name suffix as chapter-5.svc.cluster.local, while customer has a public address with example.com as the domain name suffix:
$ kubectl -n chapter-5 get rt
NAME             URL                                                 READY
customer         http://customer.chapter-5.example.com               True
preference       http://preference.chapter-5.svc.cluster.local       True
recommendation   http://recommendation.chapter-5.svc.cluster.local   True
You can call the customer service using the script $BOOK_HOME/bin/call.sh by passing the parameter customer:
$$BOOK_HOME/bin/call.shcustomercustomer=>preference=>recommendationv1fromrecommendation-96dxc-deployment-5df6945587-rnqwl:1
Grafana Dashboards
The Grafana dashboard provides a list of out-of-the-box dashboards that gather the required metrics across the entire Knative system and its components.
For the next two recipes you will be exploring only two dashboards, as shown in Figure 5-4:
-
Knative Serving - Scale Debugging
-
Knative Serving - Revision HTTP Requests

Figure 5-4. Grafana dashboards list
Autoscale Debugging
This dashboard allows you to debug the various aspects of Knative autoscaling, such as:
- Revision Pod Counts
-
This panel provides the metrics around the Knative Service Revisions and their pod counts: what is actual and what was requested.
- Resource Usage
-
This panel provides the CPU and memory usage of the Knative Service and its Revisions.
- Autoscaler Metrics
-
This panel provides the metrics around autoscaling of a Knative Service, including data points with respect to a Knative Service’s pod counts, concurrency, and Requests Per Second (RPS).
- Activator Metrics
-
This panel shows how the Knative Serving activator is responding to the scale up of dormant Knative Services with details on request count and the time it took to bring the dormant service to life.
5.7 Monitoring Autoscaling Metrics of a Knative Service
Solution
The Knative Serving - Scale Debugging dashboard in Grafana provides insight into a particular service’s scaling performance.
To simulate the metrics collection, you will run a load test with 50 concurrent requests for a time period of 10 seconds against the customer service. As the preference service can handle only 10 concurrent requests (autoscaling.knative.dev/target: "10"), you will see that preference scales up to handle the extra requests, while customer and recommendation will be able to handle the load without scaling. Run the load test by calling the script $BOOK_HOME/bin/load.sh with the customer parameter:
$$BOOK_HOME/bin/load.shcustomer
Discussion
Analyze the metrics for the preference service and discover how it performed during scaling. You can view the Knative Serving - Scale Debugging dashboard by navigating to the Grafana dashboard home and then selecting Home → Knative Serving - Scale Debugging from the list of dashboards.
Figure 5-5 shows the amount of CPU and memory that the preference service and its latest revision has consumed. In this case it is approximately 1 CPU and 500 MB of memory.

Figure 5-5. Resource usage metrics—Preference (large format version)
The screen depicted in Figure 5-6 displays the total number of pods that were used when serving the request along with the observed concurrency. Since target concurrency for the preference service is 10, the pod count will be approximately 6 to 7 pods. The observed concurrency is around 7.
The screen depicted in Figure 5-7 displays similar metrics, such as the actual and requested pod count. Whereas the preference actual pod count tends to be 0 due to the enabled scale-to-zero for the preference service, the requested pod count has spiked close to 7 when handling the load.
The screen depicted in Figure 5-8 displays the number of requests received to activate the preference service distributed by the HTTP response code. It also shows the time that the activator took in responding to the requests. Based on the load that was sent, it shows an average of 50 requests with each taking approximately 9 to 11 seconds to respond.

Figure 5-6. Autoscaling metrics—Preference (large format version)
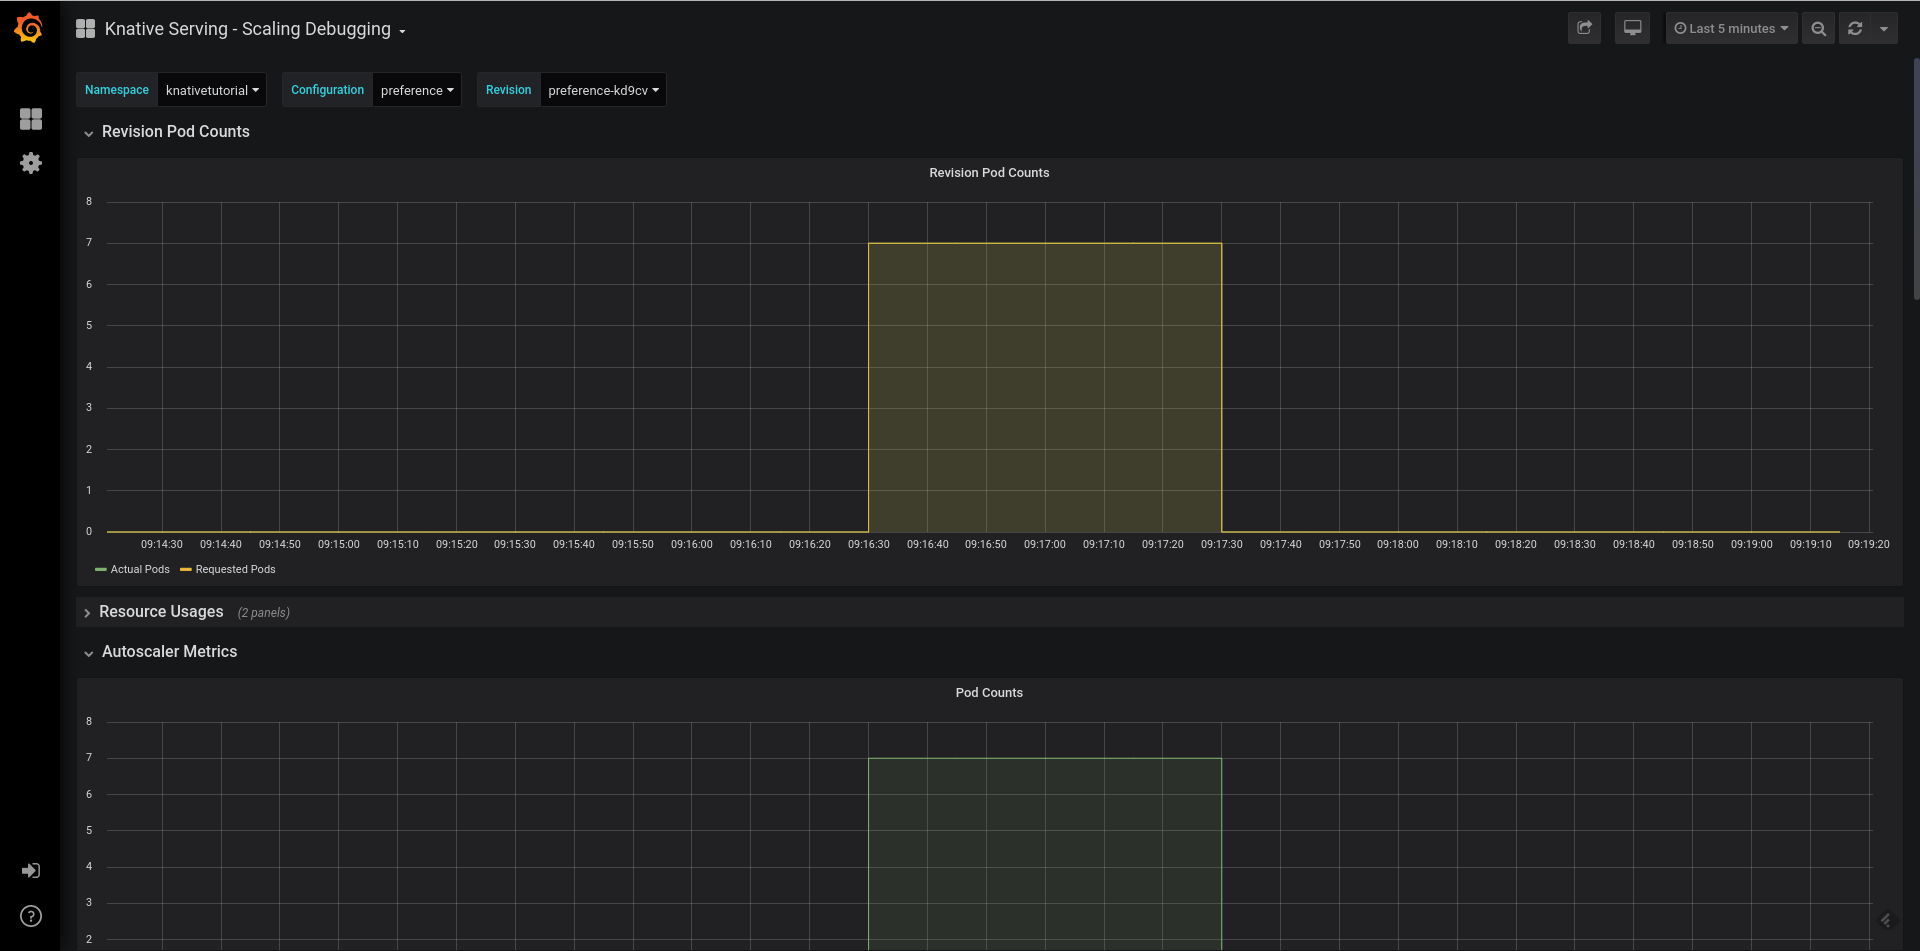
Figure 5-7. Pod counts—Preference (large format version)
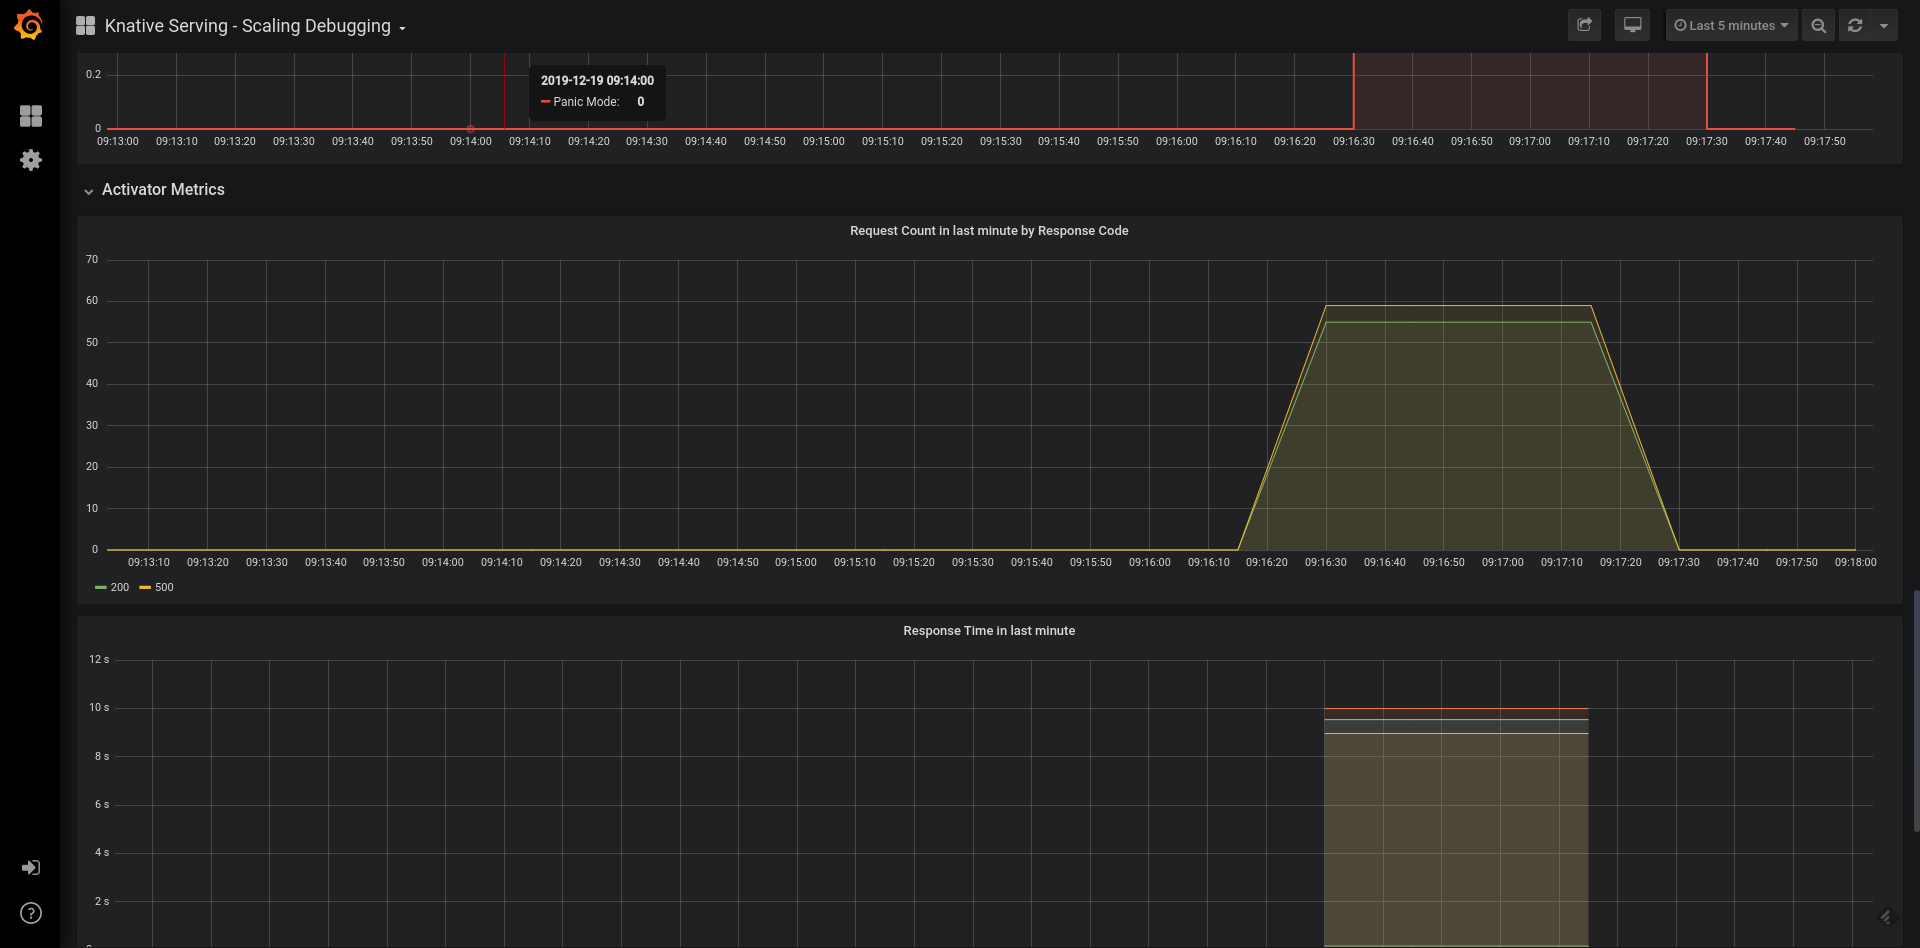
Figure 5-8. Activator metrics—Preference (large format version)
5.8 Monitoring HTTP Performance Metrics of a Knative Service
Solution
The Knative Serving - Revision HTTP Requests dashboard provides metrics for each Knative Service Revision’s HTTP requests. This dashboard has three panels:
- Overview
-
This panel provides HTTP request and response overview with metrics around Operations per second (Ops) and responses based on the HTTP response code.
- Request Volume
-
This panel provides HTTP request-centric metrics with request volumes classified by revision and response codes for each Knative Service and its Revision.
- Response Volume
-
This panel provides HTTP response-centric data with response volumes by response time and response code for each Knative Service and its Revisions.
Discussion
As customer is an edge service, it will be the ideal service for you to monitor the end-to-end request and response metrics.
Select “Knative Serving - Revision HTTP Requests” from the list of dashboards in Grafana home. You will see a screen similar to the one depicted in Figure 5-9, which has an overview of the customer service requests and responses. It also provides the metrics around requests alone categorized on request volume by revision and HTTP response codes.
The request volume–based metrics, e.g., Operations per second (Ops), will have only one revision of the customer service deployed with its average Ops being approximately 1.7. The response code-based metrics are predominantly HTTP 200 with some HTTP 5xx in the response code, which happened when the service was in a dormant state and the Knative activator was trying to scale it up.
With the dashboard depicted in Figure 5-10 you will observe percentile distribution of the customer
service responses by revision and HTTP response codes.

Figure 5-9. Request Volume metrics—Customer (large format version)

Figure 5-10. Response Volume metrics—Customer (large format version)
5.9 Tracing Knative Services with Jaeger
Solution
The Istio istio-ingressgateway automatically adds the x-b3 headers for all the HTTP requests that pass through it. With the installation and enablement of the Jaeger component, the Knative Services will generate the trace spans automatically and those spans can then be viewed in the Jaeger dashboard.
Discussion
For better clarity, it is good to clean up the existing Jaeger traces generated by previous load test runs. A simple solution to getting back to a known clean state is to simply delete the Jaeger pod in istio-system and let a new pod spin up as Jaeger stores its cached data in-memory.
You can run the following command to delete the Jaeger pod:
$ JAEGER_POD=$(kubectl -n istio-system get pod
 -l "app.kubernetes.io/name=jaeger" -o jsonpath={.items[0].metadata.name})
$ kubectl -n istio-system delete pod $JAEGER_POD
It may take a few seconds for the Jaeger pod to come back to life. You can watch the status of pods in the istio-system namespace to monitor its lifecycle.
Make sure that kubectl proxy is still running and open the
Jaeger dashboard in your web browser.
Run a single call to the customer service using the script $BOOK_HOME/bin/call.sh but passing the parameter customer to it. The call should return you a response like customer ⇒ preference ⇒ recommendation v1 from recommendation-96dxc-deployment-5df6945587-rnqwl: 1.
Use the browser refresh button to refresh the Jaeger dashboard to have the customer service listed in the Service drop-down, as shown in Figure 5-11.

Figure 5-11. Jaeger service list
Leaving all the other search options with their defaults, click the Find Traces button where you will see one trace with eight spans as shown in Figure 5-12.
Clicking the customer span as depicted in Figure 5-11 will the expand the trace to show the end-to-end details, as shown in Figure 5-12.
You should notice that the initial call to the Knative Service is routed via istio-ingressgateway, which then:
-
Forwards the call to the
customerKnative Service -
The
customerservice then callspreferencevia thecluster-local-gateway -
Finally, the
preferenceservice callsrecommendationalso viacluster-local-gateway
Based on the service flow as described earlier, Jaeger provides a critical data point as shown in Figure 5-13; the traces that show the time spent on each service hop. With these details, you can discover how transactions are flowing through your system as well as determine if there are any bottlenecks along the path.

Figure 5-12. Jaeger customer trace (large format version)

Figure 5-13. Jaeger customer trace expanded (large format version)
Tip
The exploration of logging requires a bigger cluster with more CPU and memory than the simple minikube configuration used in these recipes. If you have access to a bigger cluster, you should also review the logging capabilities following the upstream project documentation.
You now have a good understanding of configuring metrics and monitoring collection using Prometheus, analyzing the metrics via the Grafana dashboard, and identifying the bottlenecks of your services using the Jaeger trace spans. In the next chapter, you will learn how to apply Enterprise Integration Patterns using Knative and Apache Camel-K.