
CHAPTER 20
Leading with AI and Analytics
Eric T. Anderson and Florian Zettelmeyer
“How can we use AI and analytics to improve our marketing strategy and drive value?” Some form of this question routinely comes up in the analytics workshops run for leaders across industries. Even among marketing executives who are generally quite good at what they do, AI and analytics—we'll call it “AIA” here—remains a challenge for them, despite all the data they can access. In fact, in a survey of about 400 chief marketing officers, the leaders noted high barriers to using data, including lack of processes, tools, and talent for analytics.1 That's a problem, given that as a marketing leader you need to draw on data‐driven decision making to create, sustain, and grow advantage for your business in an ever more competitive market. That reality is not going to change.2
Moreover, while it may be tempting to see AIA as a problem owned by AI, analytics, or data science groups, that's simply not the case. Every business leader, including those in marketing, has to see AIA as a leadership problem, take ownership of it, and use AIA proactively as part of their approach to strategy and tactics. Doing that effectively starts with gaining a working knowledge of data science, or what we call a high data science intuition quotient (DSIQ). It's important not to confuse DSIQ with expertise in data science; rather, DSIQ is about harnessing your existing critical thinking skills to gain a feel for what good AIA looks like. Indeed, that's why the “I” in DSIQ stands for “intuition,” not “intelligence”; the latter seems like more of an inherent, instinctive attribute in contrast to intuition, which you can learn.
The mission of business professors and consultants is to raise the DSIQ of professionals across all fields and functions by helping them understand AIA concepts, tools, and frameworks, then use them to identify good (and not‐so‐good) analytics, understand where to use AIA to add value, and lead AIA initiatives capably and confidently. Doing that will ensure that you shift from uninformed or misinformed decision making to evidence‐based decisions—and help your broader organization do the same—whether you are a CMO, marketing VP, product manager, or any other marketing professional.
This chapter makes the case for raising your DSIQ as a marketer by sharing the “truth” behind a well‐known analytics story, laying out the main reasons it's critical to gain a working knowledge of AIA (with specific examples), and sharing our AIA Framework, which takes you from business objectives to outcomes using AIA as a core value driver. Finally, it presents an in‐depth marketing‐focused example of using predictive and causal analytics to move from prediction to profit.
Moneyball: What Really Happened
The “Moneyball” story of a professional baseball team's high‐impact use of analytics illuminates the relationship between leadership and AIA. Author Michael Lewis's bestselling book of the same name chronicled the Oakland Athletics’ (A's) turnaround in the early 2000s,3 motivating the use of the term Moneyball for the application of statistical analytics to sports strategy in place of intuition for activities like recruiting and trading players.
But it turns out that the way most people think of the baseball story is misguided: The use of analytics actually isn't the main driving force. So what is?
Before we answer, consider the Moneyball story's premise and plot. Billy Beane—played by Brad Pitt in the Moneyball movie—had been a struggling professional baseball player before moving to the A's scouting organization in 1990 and ascending to general manager, the top leadership role, seven years later. In that position, he oversaw recruiting of new players, with a focus on high school talent, as is the sport's norm. The focus of recruiting efforts at the time was on traditional skills such as hitting, fielding, and speed.
Beyond discerning high‐potential talent, Beane faced the challenge of a recruiting budget about 70% less than that of the A's iconic American League rival, the New York Yankees. But Beane was willing to think differently and did so in 1999 by recruiting Paul DePodesta, a Harvard economics‐degree‐holder who'd previously worked with the Cleveland Indians (now called the Guardians). Together, Beane and DePodesta revolutionized the A's recruiting approach to focus less on traditional skills and more on subtler statistics related directly to scoring runs. Their analysis suggested that on‐base‐percentage (OBP, the proportion of times a batter reaches base) and slugging percentage (the number of total bases divided by the number of at‐bats) were worth recruiting for—as much as or more than traditional metrics like batting average—and that players scoring high on these metrics could be secured less expensively because other teams weren't seeking out those statistics.
That bet paid off in a big way: The A's reached the playoffs every year from 2000 to 2003, and in 2006 the team made the American League Championship Series, the doorstep of the World Series, despite ranking 24th of all 30 Major League teams for payroll. Other teams copied Beane's approach, including the Boston Red Sox and Chicago Cubs, who soon won their first World Series titles in 86 and 108 years, respectively.
It's no surprise, then, that most people see analytics as the “star” of the Moneyball story, the force behind the now widespread use of statistics‐based decision making in every major U.S. sport. Indeed, it's easy to place data and analytics center stage in the revolution that began with Beane and the A's at the millennium's turn. In general, people believe the shift to analytics was brought about by some combination of new data, innovative statistical methods or computational capabilities, and more skilled analytical talent.
Our take on the Moneyball story suggests otherwise. For example, with regard to data, voluminous statistics had been available since the late 1800s, over a century before Beane became the A's general manager.4 Moreover, Beane and Podesta used analytical techniques based largely on regression, a statistical approach established long before and requiring only modest computing power such as that of a desktop computer. Finally, there was no evidence of more skilled analytical talent in the A's story, as the Society for American Baseball Research (SABR) had promoted application of analytics to the sport since the early 1970s, including recognition of the value of the OBP statistic that became central to Beane's success.
That leaves only one feasible solution to the mystery of what drove baseball's analytical moment: leadership. Billy Beane himself brought about the shift through his conviction regarding the power of analytics and leverage of an analytics‐rooted management approach to turn around his struggling team. So, while the data, tools, and techniques Beane used weren't new, his style of leadership was. In fact, the revolution could have come years earlier, given that all the necessary pieces were in place. But it took the right leader to believe in and lead the analytics‐fueled change. That's also the case in any business organization or industry.
Analytics and AI Are Every Leader's Problem—Here's Why
Billy Beane was the top executive at the Oakland A's. But we see AIA as every leader's problem because of their large influence on strategy, planning, culture, and all other kinds of decision making. But to really drive the point home, consider several mutually reinforcing reasons why AIA is a leadership issue, as presented in the following subsections.
AIA Requires Managerial Judgment
Leaders routinely make high‐stakes decisions, and these are increasingly based on data. Even the most experienced executives may struggle in this domain. As an example, at a thought leadership retreat for a digital‐marketing business serving the automotive industry and other sectors, the marketing VP said that a recent analytics initiative had “made the link” between digital ads and offline sales of cars—a long‐elusive association due largely to the difficulty of securing comprehensive sales data from dealers. Their team had worked with IT to track ad views and clicks, then used cookie information from a post‐sale survey to assess whether individuals had purchased an automobile after viewing an ad for it. The sales conversion chart seemed to highlight the ads’ effectiveness, as shown in Figure 20.1.
It's no surprise the executives were excited to see the conversion rate soar from less than 1% to 14% when people saw both retailer and manufacturer ads. But as most of the retreat participants considered how to leverage this evidence of ad effectiveness, another VP pointed out that people who had seen no ads (the left‐most column) were likely not searching for automobile information online, while those consumers served both retailer and manufacturer ads (right‐most column) had probably searched for cars with specific keywords manufacturers and dealers had bid on, triggering the ads.
The second VP was right: Ultimately, all the chart showed was that someone who had expressed online interest in buying a car (and thus was served digital ads) was more likely to buy a car than someone who hadn't expressed such interest—hardly an earth‐shattering insight. Indeed, the dataset the marketing team had collected offered no route to knowing if ad exposure had any effect on purchase, because it failed to meet a key requirement for a true experiment: random assignment to conditions. But nearly all the high‐level executives at the retreat failed to grasp that.

FIGURE 20.1 Digital Car Ad Sales Conversion Rate
They are not alone. Similar examples of flawed or incomplete interpretation of analyses occur in nearly every group of managers we work with. It's human nature to want to believe seemingly convincing data. In fact, the data themselves are “real” and truthful but are often misinterpreted to mean something they don't. That's where sound managerial judgment, based on a high DSIQ, is critical.
The Illusion of Insight
Another reason AIA is a leadership problem is that data can create the illusion of insight. Today, nearly every marketing manager has a dashboard that provides numerous metrics on performance. It can be tempting to believe, then, that having more data leads to better decision making. The problem with that assumption is that many marketing leaders lack data science intuition and can easily be misled by these dashboards, resulting in suboptimal decisions.
Consider the example of a marketing executive in a large B2B software company. Senior management wants to compare the performance of a new, expensive CRM system the business is testing to one that has been in place since 2018. The new CRM system has been designed to help salespeople enhance their general selling effectiveness and increase conversions of prospective enterprise customers. To test the new CRM system's performance, the executive completed a one‐month pilot in two regions, East and West, comparing the legacy and new systems on revenue per salesperson.
When the data came in, the manager was surprised to see no improvement in revenue per salesperson for the new system, as shown in Figure 20.2. Based on these results, the executive intended to recommend that senior management not invest in the new CRM system.
But it turns out that's the wrong decision. What the dashboard did not reveal was that the pilot test involved an opt‐in decision for each salesperson. The regional manager in the West strongly endorsed the new CRM system, and 90% of salespeople in the region tried the system during the one‐month trial. But the East's regional manager did not promote the new system, and only 10% of salespeople in that region adopted the system. Indeed, a closer look at the data showed that revenue in both regions increased with the CRM system (see Figure 20.3)! But blending the results from regions with very different opt‐in rates led to the “finding” of no difference in system performance. This is a subtlety that is lost without a deep understanding of how the test was set—something most decision makers don't think of as “their” problem.

FIGURE 20.2 CRM Results: 2018 versus 2022
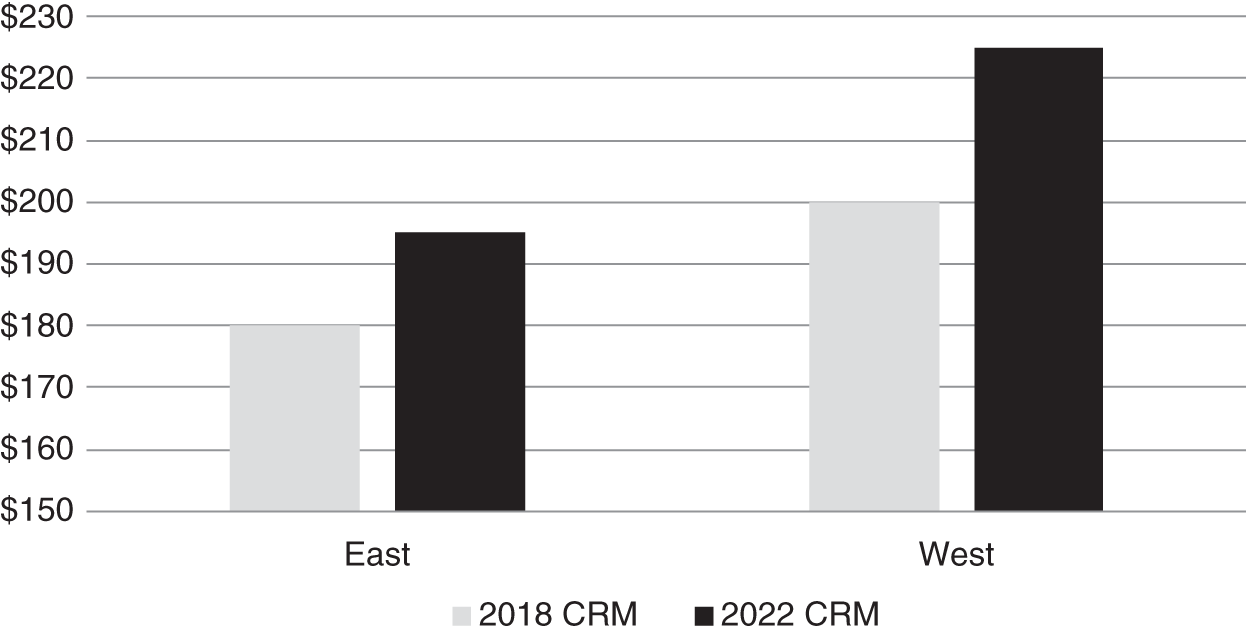
FIGURE 20.3 CRM Results by Region
That means that the initial results would have been an accurate representation of the new CRM system's performance only if the adoption rate had been identical between regions. This was far from the truth, resulting in a misguided investment recommendation. As in the digital advertising example presented earlier, the numbers were true but the conclusion was erroneous. Many marketing managers simply don't have the training or instincts to see past the numbers presented, especially when they are dealing with so much data in dashboards, presentations, and other sources. That's why you need a high DSIQ to facilitate your critical thinking and decision making related to AIA.
AIA Requires Structure, Process, and Incentive Shifts
To illustrate the tight relationship between AIA and structure, process, and incentives, we introduce Marge, a mid‐60s retired nurse from Long Island. Along with enjoying crochet, crosswords, and bingo, Marge is an avid gambler, playing slots and video poker everywhere from Atlantic City to Chicago to Las Vegas, traveling with her husband and friends on multiple annual gambling trips.
Based on Marge's presence in casinos nationwide, gaming‐business marketing teams consider her a “cross‐market gambler.” As the new millennium approached, industry stalwart Harrah's sought to target customers like Marge. It was part of the business's attempt at a much‐needed comeback. At the time, Harrah's operated casinos in large markets like Las Vegas but also in an array of smaller market regions. The business faced increasingly stiff competition from rivals like Steve Wynn's Mirage Resort and Casino—which featured Siegfried and Roy's famous white tiger show—along with Luxor, the MGM Grand, and other casinos. As a result, Harrah's gambling revenue had faltered, and marketing and other leaders sought to drive up room revenue, which required a large investment.
In this high‐stakes situation, Harrah's market research, including customer interviews, revealed that while the typical Vegas gambler restricted most of their play to that city, those patronizing Harrah's, like Marge, were more likely to be cross‐market gamblers who played year‐round across U.S. regions. Despite Harrah's strong geographic coverage, in 1998 they'd captured only 36% of all cross‐market players’ total spending.
To boost that share, Harrah's leadership sought to identify the cross‐market segment more accurately, target the segment's most profitable customers, and offer the right incentives (free rooms, food, and the like) to attract the high‐profit customers. These are three core activities of any marketing manager. Surely Harrah's marketing team could execute against these goals.
But there was a problem. At the time, Harrah's operated each casino as an autonomous business, including separate P&L and reward programs. That made property managers territorial about customers; moreover, rewards earned at a given property could be redeemed only at that property. Consequently, simply rolling out a new cross‐market rewards program would have been a doomed initiative due to the lack of supporting structure and incentives.
Luckily, strategy and marketing leaders recognized that issue and worked to shift Harrah's focus from properties to customers as the key value driver. That required development of a whole new organizational structure: Property managers now reported to the COO rather than the CEO, to reflect that customers belonged not to each casino but to the broader company. Similarly, leaders worked with technology teams on a new behavior‐tracking system underlying a “total rewards” program through which customers could use a single membership card across all Harrah's properties. They supported the program with predictive analytics to forecast customer value and create effective reward‐program incentives.
The new structure, systems, and data generated critical, actionable insights. For instance, Harrah's now understood that customers who'd begun their gaming tenure with the business had a higher lifetime value than other gamblers, so it was worth offering them larger incentives early on, even before they'd spent much at Harrah's, to ensure their loyalty.
The new strategy proved a winning bet. By 2001, Harrah's had increased its share of cross‐market spending from 36% to 42%, garnering hundreds of millions in new profits. Leadership has continued to improve the strategy to the present, using real‐time, data‐driven models to boost value—such as offering drinks and other incentives in the moment to high‐value customers facing frustrating losses at the blackjack tables. Indeed, the gaming industry considers Harrah's a story of exemplary strategy.
Harrah's challenges are common well beyond gaming and entertainment, given the presence of siloed organizations and poorly integrated systems, processes, and data across sectors—as so many leaders would confirm. To win, Harrah's had to completely remake its structure and customer strategy to ensure they could deploy analytics effectively. A high DSIQ will help you invest in the right structure, systems, and data to support your business's strategic goals and initiatives.
Analytics Requires a Problem Focus and Upfront Planning
Marketing and other executives often overlook something critical: Analytics requires starting with a business problem and a clear plan.
That's easy to forget when you're floating in a sea of data related to sales, growth, other financials, customers, and conversion, among others. The temptation becomes to go looking for something, anything, in the data that may deliver insights. But for many marketing managers, these insights are the end of the process. They uncover new information about buyer behavior and then ask themselves: “What's next?” In many cases, the process moves from data to insight and then stops. Such approaches ultimately yield little to no business value.
So, What's the Problem?
Marketers need to start with a high‐stakes business problem. Then they need to ask, “How can the data help me address this business problem and make better decisions?” Moreover, marketing leaders need to identify and frame the strategic problems that guide data analytics rather than seeing this as the domain of data scientists or IT specialists.
Owning this challenge fully means taking ownership of planning for analytics. Remember Mad Men, the award‐winning TV series focused on fictional 1960s ad agency Sterling Cooper and creative executive Don Draper? It was easy to find the advertising campaigns featured on the show—for Samsonite, Kodak, Hilton, and other well‐known brands—appealing, but where was the analytics‐based evidence of their effectiveness? There wasn't any. Advertising is just one domain where analytics is implemented after the fact at best, or never at all. As the earlier digital advertising example illustrates, you may have massive amounts of data on exposure, clicks, and purchase but still lack real evidence that a given online campaign actually worked.
What's missing from the vast majority of business plans is an AIA business plan proposing data and models to test the performance of a new strategy or initiative. Such a plan must be crafted before the launch of a new idea, which renders the analytics more feasible and implementable. Today's highest‐performing companies apply the same rigor to AIA planning as they do to executing their core business.
All of the ideas in this section make clear that AIA is a leadership problem, and every current and rising leader in marketing or any other area should aim to boost their DSIQ. That will maximize your performance with regard to understanding the validity of data‐driven business cases, framing strategic problems and planning analytics, and using analytical insights to craft changes and initiatives related to structure, process, and incentives. As we mentioned earlier, you don't have to gain expertise in data science; rather, you need a working knowledge of this domain.
The AIA Framework for Marketers
Success with analytics requires a shared understanding of AIA and a structured process for developing and implementing initiatives. The problem is that even senior leaders in data science diverge in their definitions of AI, analytics, and their relationship. Given that there's no consensus view on AIA, we've used a business‐oriented perspective built on decades of working with companies on AIA initiatives to create an AIA framework. It serves as a set of organizing principles and steps to work on AIA challenges and strategies in your organization, offering a process‐driven approach and common language around this key domain.
Most businesses struggle to craft and implement AIA projects due to a lack of understanding of fundamentals and a systematic process for linking business priorities with AIA. Existing AIA frameworks are often misguided or incomplete. For example, some view analytics maturity as the driver of business value (not always true); others fail to make key distinctions among analytics approaches (which can lead to poor business decisions); and many fail to integrate AI and analytics effectively (an important connection).
The AIA Framework for Business Decisions is a way for you to create a shared vocabulary and process for AIA while customizing it to your organization's needs. Of importance, the foundation for this framework is the traditional business decision‐making process that starts with a business objective, understanding of the problems related to that objective, and a set of business ideas leading to a decision, as depicted in Figure 20.4. Note that data and models figure into decision making, but much less than intuition does in most businesses today, hence the proportions of those components in the visual.
The goal of the AIA Framework for Business Decisions is to make the AIA layer—the “Data and Models” component—much thicker, with opportunities not only to use AIA to assess ideas but also to generate them by transforming data, through learning, into knowledge. Figure 20.5 depicts our AIA framework, nicknamed the “Lexus Grille” due to its resemblance to the distinctive fronts of cars from that automaker.
The framework provides a repeatable process connecting business outcomes with analytics‐informed decisions, enabling you to systematically replace intuition with evidence. As Figure 20.5 illustrates, the framework includes three specific types of analytics:
- Exploratory Analytics: Describing data, explaining the generation process for the data, and assessing variability within the data
- Predictive Analytics: Using AIA models to anticipate future outcomes
- Causal Analytics: Using AIA models to influence future outcomes

FIGURE 20.4 Traditional Business Decision‐Making Process

FIGURE 20.5 The AIA Framework for Business Decisions
Consider the subtle but important distinction between predictive and causal analytics by placing yourself in the shoes of a marketing leader for an online retailer like Harry's (shaving products) or Bombas (socks and other clothing) that wants to forecast demand (orders received) for the upcoming month. That requires a predictive model that anticipates future outcomes, assuming business as usual. But now suppose the CMO asks whether the firm can use a new marketing campaign to boost order volume by 5%. You've just entered the domain of causal analytics, or seeking to influence a future outcome. As this simple example suggests, predictive and causal analytics speak to different business questions; moreover, the resources each requires can differ significantly, so it's critical for leaders to understand the distinction here, which we'll illustrate further shortly.
The last parts of the framework involve making business decisions through scenario‐driven optimization and scaling the related ideas or actions organization‐wide. Rather than goals in and of themselves, think of predictive and causal analytics as inputs for optimization, thus linking analytics with the overarching business decision. For scaling, AI can play a critical role in automating learning and creating usable knowledge across the business. A word of caution is in order: Take care not to see the AIA‐generated answer as the end‐all solution; instead, integrate model‐based recommendations with your business intuition to determine the best way forward.
Applying the AIA Framework in Marketing: Propensity Versus Uplift
To bring the general concepts of the AIA framework to life in marketing, let's consider the journey of a gaming company, Creative Gaming. Imagine the business wants users to purchase an in‐app campaign called Zalon, which costs $14.99. For the past several months, the firm has run a Zalon advertising initiative that has led to about 10% of users buying the campaign.
An in‐house data science team suggests that Creative Gaming can use the historical data to identify the types of prospects who have adopted Zalon so far. Their model identifies factors like gaming skill and propensity to click on ads that are associated with campaign purchase. The marketing team then uses this model to target advertising to a set of gamers seen as most likely to adopt.
After one week, the results of the targeted advertising campaign come in, and the executives are delighted. The conversion rate for this latest offer was 12%, more than double the base rate of 5% and 20% higher than the previous advertising initiative. Clearly, the targeted advertising was working!
In modern marketing departments, this type of analysis takes place daily. It's known as “propensity modeling,” which is a key approach in predictive analytics. Note how the model used in this example seeks to identify the best prospects and then send ads to those gamers.
But Is This the Best Approach?
Your DSIQ comes into play when you recognize that maximizing ad effectiveness is not about predictive analytics but instead a causal analytics problem—and it requires a different analytics approach, namely “uplift modeling.” Uplift modeling is different from propensity modeling in that instead of asking “Which consumer is most likely to buy?” we ask instead, “Which consumers’ purchase behavior is most likely to be influenced by an ad?” For instance, if a customer is 95% likely to buy Zalon without ever seeing an ad, it may not make sense to target advertising to them. But, if a customer's chance of buying quadruples from 10% to 40% when they are shown an ad, it makes a strong case for targeting them. Uplift modeling, then, is a form of causal analytics. We ask how an action, in this case targeted advertising, will change buyer behavior.
So What Is the Best Model for a Firm to Use?
It turns out that uplift modeling maximizes profits for a firm. But it is not trivial to implement. For example, there are numerous challenges to measuring the incremental change in consumer behavior attributable to a specific campaign. Consequently, our message to marketing leaders is that they need to understand this distinction (uplift vs. propensity), assess challenges to implementation, and then guide their organization in the best direction. The AIA Framework helps leaders see the critical difference between predictive analytics (propensity models) and causal analytics (uplift models) and develop the right strategy for the business problems they want to solve.
Conclusion
There's a strong case to be made for the central message here: Analytics is a leadership problem, and as a marketing leader it's critical to raise your DSIQ, or data science intuition quotient. That's not at all about becoming a data science expert; rather, it is gaining a working knowledge of AIA to drive business value, using the ideas here and elsewhere.
Leaders who invest in this working knowledge of data science will become more effective in leading their teams through challenges large and small, identifying the types of projects where AIA delivers the greatest value, and collaborating on the execution of these initiatives. Together, these activities can transform your organization. Best of luck on your AIA journey, wherever it takes you.
Author Biographies
Eric T. Anderson is the Polk Bros. Professor of Retailing, professor of marketing, director of the Kellogg‐McCormick MBAi program, and former chair of the Kellogg Marketing Department. He holds a PhD in Management Science from MIT. His articles have appeared in top scholarly journals in marketing and economics, as well as in the Harvard Business Review and Sloan Management Review. Academic research awards (Paul E. Green Award, Weitz‐Winer‐O'Dell Award) recognize his impact on the field of marketing. His book Leading with AI and Analytics (co‐authored with Florian Zettelmeyer) was published by McGraw‐Hill in December 2020. Eric has served as marketing department editor of Management Science since 2014 and has been a member of the Canadian Tire board of directors since 2016.
Florian Zettelmeyer is the Nancy L. Ertle Professor of Marketing and former chair of the Marketing Department at the Kellogg School of Management at Northwestern University. He also founded and directs the Program on Data Analytics at Kellogg. Professor Zettelmeyer specializes in evaluating the effects of analytics and AI on firms. He teaches the MBA elective “Customer Analytics,” a key analytics course at the Kellogg School of Management. He has received numerous teaching awards and has been voted “Outstanding Professor of the Year” by Kellogg MBA students. He is a research associate of the National Bureau of Economic Research (NBER). Professor Zettelmeyer co‐directs Kellogg's “Leading with Big Data and Analytics” executive education course for senior leaders. Professor Zettelmeyer received a Vordiplom in business engineering from the University of Karlsruhe (Germany), an MSc in economics from the University of Warwick (UK), and a PhD in marketing from the Massachusetts Institute of Technology.
Notes
- 1. The CMO Survey, www.cmosurvey.org, accessed May 15, 2022.
- 2. Much of this chapter's content was adapted from Eric Anderson and Florian Zettelmeyer, Leading with AI and Analytics: Build Your Data Science IQ to Drive Business Value (McGraw‐Hill, 2020).
- 3. Michael Lewis, Moneyball (Norton, 2004).
- 4. Baseball Almanac offers data for teams and players starting in the mid‐1870s, www.baseball-almanac.com, accessed May 20, 2022.