
6
Data Analysis to Prepare for MTSS
In this chapter, we focus on creating robust data systems that allow you to monitor progress toward your vision. We focus on the importance of triangulating four types of data including outcomes data, instructional data, perspectives data, and systems data. Additionally, we recommend looking at all forms of data through an equity review to recognize the impact of your current systems on learners who have been historically excluded, marginalized, and minoritized. We also offer concrete guidance and planning tools to prepare your data culture so that you can create rapid cycles of improvement.
The Power of Lived Experiences (Kristan)
I have a memory as a child of my sister being carried away on a small inflatable mat, deep into the ocean waves. I am not even sure if it is an imagined or a true memory, but this is what my brain remembers.
It was a calm day in West Africa, and the waves were not menacing. Our family looked away for just a minute, and when we looked back she was waving her arms in fear as her little plastic floatie carried her deeper into the sea at a pace that frightened us all. My father was a strong swimmer. I remember him swimming with the power of a father's adrenaline to save his child. He snatched her back, and through the large waves, they rolled and kicked to shore. At that moment, we felt only relief.
Later, my parents would establish much more defined ground rules for the use of floatation devices in the ocean. Chiefly, they were to be used in the lagoons but never in the open ocean. What was leisurely in one setting was literally life‐threatening in a different environment. Had we had access to the internet in the early '80s, we might have looked up the conditions of the sea and undertow in that location or researched the safety of this float in that setting. Had we been experts in engineering, we could have calculated the risk scientifically and mathematically. We did not have access to that information then, but the lived experience and experiential outcome were all the data needed to change our practice.
Data Analysis
Thus far, we have discussed the importance of reviewing current initiatives, completing a thorough document review, and mapping our current resources and assets. As a next step, you will dive into data (hooray!). When used correctly, data is a tool that helps us to reflect on the outcomes of our actions. Data brings us back to Newton's Third Law of Motion: For every action, there is an equal and opposite reaction. In the world of MTSS, we argue that for every action, there is data to reflect on the reaction.
Although it may not win us popularity contests, we strongly believe that data is a driving force in making your organization work for all students. When data is not examined, or worse, when it is used incorrectly, it can also be a shield to cover areas where we are not positively impacting all learners. Unearthing data, disaggregating it to examine the impact of our actions on all learners, and sharing what we learn is the first step in creating an organization centered on meeting the needs of all of our students, not just some of our students.
Yes, yes, we know that students are more than just numbers. We are in full agreement. Data is more than numbers. We have to examine qualitative and quantitative data from multiple sources to better understand the experience of the learners and families we serve, especially those historically underserved and excluded from the best our systems offer.
The data review process can be overwhelming, so we like to think about collecting data in four categories: outcomes, instructional, perspectives, and systems (see Figure 6.1) (Massachusetts Department of Elementary and Secondary Education, Commonwealth Consulting & Novak Education, 2022, p.4-5). It is important to note that while school and district processes may vary, it is crucial to leverage the perspectives of diverse stakeholders and consistently ask, “How do we know?” to anchor data on the student experience. In many cases, we must not wait until we get all of the most aligned assessments to begin to use data to enhance our tiered supports. Rather, we use what we have and engage in our data tree development.
Outcomes Data
Looking at student outcomes, including accountability data, can provide a high‐level view of progress toward your vision and where there may be gaps in opportunities for particular students (such as in specific grade levels, subject areas, schools, or student populations). These outcome data can help you identify more targeted instructional data for a closer look at student experience in the classroom, including examining curricular materials and observing instructional strategies. Together, these data sources can help point school systems toward areas worth exploring in more detail as potential focus areas for continuous improvement. Student outcomes data may include the following, disaggregated by specific student groups:

Figure 6.1 Four categories of data
- State accountability data
- Additional measures of student achievement (screening assessments, benchmark assessments, formative assessments, performance assessments, portfolios, student work)
- Student attendance, dismissal, and discipline rates
- Course enrollment, completion, and pass/fail rates, including enrollment in advanced coursework
- Student promotion, graduation rates, and drop‐out rates
As you examine student outcomes data, find a way to summarize this data to begin to tell your organization's story. The data points shared represent your priorities. The “Sample Data Summary: Student Outcomes” on the next page is a sample of student outcomes data from a high school. The school is using existing assessments while they look to form their assessment committee to look at different universal screening measures and diagnostic assessments. Based on this data summary, what do you think their priorities are?
Instructional Data
This is data that represents the lived experiences of our students. Observing classroom instruction and reflecting on the curriculum resources shared with students is critical in multi‐tiered systems, and this must extend beyond formal educator evaluation. It is the kind of data that informs our thinking about the system's ability to meet the instructional vision that we have set. Sample data sources may include, but are not limited to:
- Observation data such as learning walks, instructional rounds, and evaluation data
- Use of high‐quality instructional materials (e.g., lesson plans, student tasks or assignments, and appropriate scaffolds)
- Results of instructional materials against a Culturally Responsive Curriculum Scorecard
Perspectives Data
School systems should use the data analysis process to speak directly to students and other stakeholders (including staff members and families) about their perspectives and experiences. Prioritizing the students with the least access to the system's vision will provide a critical perspective on what areas should be focused on for continuous improvement while helping the district center equity in its improvement efforts. Sample data sources may include:
- Stakeholder perspectives (students, families, staff/faculty, community partners) from surveys and focus groups
- Teacher attendance, retention, and churn, as well as any information from exit interviews or other perspectives on teacher culture and morale
- Local culture and climate survey data
Systems Data
Finally, system leaders can use the information unearthed in the data analysis and conversations with students and other stakeholders to identify particular systems and structures closely linked to the focus areas identified for improvement efforts. At this time, you will integrate your work from your document review process to better understand how all the components of the system fit together and impact student outcomes. In addition to the documents you previously reviewed, you may review additional system‐specific documentation such as policy handbooks, equity reviews, or staffing plans to understand where these systems are or are not being leveraged effectively. Sample data sources may include:
- Internal or external reviews such as an equity or a staffing review
- Improvement plans (Strategic Plans, Capital Plans, Tech Plans, district or school improvement plans)
- List of vendors and partners providing services (e.g., professional development and student programming)
- Policy, practice, and procedural artifacts (e.g., policy manuals, schedules, handbooks)
Equity Reviews
Whether you conduct an equity review internally or with the assistance of an outside provider, it is essential that you consider a robust approach. The goal of an equity review is to assess student access to high‐quality programs, high‐quality teaching, just discipline procedures, equitable resources, and root‐cause analysis of persistent opportunity gaps for students who have been historically marginalized. According to the National Equity Project (2022), equity is defined as reducing the predictability of who succeeds and who fails, interrupting inequitable practices that impact students, and cultivating the unique gifts, interests, and talents of every student. They note, “When we focus on equity, we expand our community's notions of who belongs, and who schooling is intended to work for, to include and care for everyone. By respecting and bridging our differences in ways that help us heal from harm, we can ensure that every child is seen, valued, and thrives.”
The National Equity Project reframes the work of districts, from approaching equity as closing achievement and opportunity gaps, to one developing systems to increase capacity to bring about more equitable outcomes and experiences. Learning for Justice (n.d) (formally Teaching Tolerance), a resource center funded by the Southern Poverty Law Center, “highly recommends” the equity audit resources available through the Mid‐Atlantic Equity Consortium (MAEC). The Mid‐Atlantic Equity Consortium (MAEC, n.d.) defines an equity review as “an equity audit specifically look[ing] at policies, programs, and practice that directly or indirectly impact students or staff relative to their race, ethnicity, gender, national origin, color, disability, age, sexual orientation, gender identity, religion, or other socio‐culturally significant factors.”
Equity reviews can be extensive or narrow in scope. The following key questions frame the review and provide an inquiry‐based approach to understanding programmatic and resource equity for a district's students. As you complete your data review and needs assessment, consider the following questions from a publication from the Alliance for Resource Equity (n.d.), “Ten Dimensions: Resource Equity Diagnostic for Districts.” Through these questions and the corresponding framework offered through the Alliance for Resource Equity (n.d.), the goal of the review is to build a “data story” around equity.
- Does the district have a specific policy, mission, and vision regarding educational equity?
- Does each student have access to high‐quality and culturally sustaining curriculum and instructional materials?
- Does each student have access to teaching practices that are engaging, culturally relevant, and standards‐aligned?
- Do the teacher and the leadership workforce reflect student diversity?
- Does the district's funding system distribute adequate funding based on student needs and enable flexible use of funds in ways that are clearly understood?
- Does each student who needs more high‐quality instructional time receive it?
- Does each student experience a safe school with transparent, culturally sensitive, and consistent expectations and discipline policies?
- Does each student have access to effective social emotional learning opportunities?
- Does each student who needs targeted social emotional and/or behavioral support receive it?
- Is each student enrolled in a school and attending classes that are racially/ethnically and socioeconomically diverse?
- Does each student attend a school that actively and meaningfully engages families?
A sample process for an equity review involves an analysis of student data (e.g., performance, attendance, course enrollment, graduation/dropout data, attendance, discipline) to explore trends. Additionally, documents can be reviewed with a lens toward equity. These documents include policies, handbooks, curriculum, professional development offerings, and budgets, similar to the process of reviewing documents for the MTSS document review. Student, family, and staff surveys are examined for patterns and trends with the aim of understanding perceptions and lived experiences. Survey data is complemented with focus group experiences with students, families/caregivers, and staff. The focus group process is a listening session where participants are invited to engage in a group conversation that focuses on three main questions. The following is a sample set of student‐facing questions created by the Education Law Clinic of Harvard Law School and the Trauma and Learning Policy Initiative of Massachusetts Advocates for Children (2019):
- What does your school currently do to help you do well?
- Is there anything that you need to do well at school that you are not getting?
- What does a class that you learn a lot in look like, sound like, and feel like?
As your district continually reflects on its strategic work, it will be important to engage all stakeholders by conducting focus groups and listening sessions. The American Institutes for Research (AIR) (2018) under the U.S. Department of Education published guidance for Equitable Family Engagement. They argue that districts need to offer structures for regular listening sessions with families. Additionally, they note the importance of involving community liaisons that capitalize on the value of community members that speak the language and are of the same culture.
By engaging in regular listening sessions, the district can capitalize on the interim success and modify strategies as needed. To conclude, the AIR (2018) document shares, “Schools and districts can successfully make family engagement more equitable and effective by implementing strategies that reflect the needs and values of the community. These strategies may need to be modified as community needs change over time, especially considering that community demographics and culture can change rapidly” (p.13).
When supporting multilingual learners and their families, family‐school collaboration involves three facets for success: (1) developing parent involvement programs that are carried out in the home language, are sustained over time, and are responsive to the cultural experiences of the families; (2) understanding the out‐of‐school experiences of children and how these may differ from the skills demonstrated at school; and (3) providing accommodations for parents of ELs to enhance the effectiveness of parent involvement activities.
It is also critical to involve your governing body in the equity review work. The following narrative is adapted from an actual equity audit review that involved a school board. It is only a small portion of an audit and may not be aligned with your organization's structure but provides a window into the implications of an equity review on district systems.
Transforming Equity Reviews Into Action
The National School Board Association (NSBA, n.d.) encourages school committees to define equity in inclusive terms. Through its own journey, NSBA adopted the following definition of equity:
We affirm in our actions that each student can, will, and shall learn. We recognize that based on factors including but not limited to disability, race, ethnicity, and socio‐economic status, students are often deprived of equitable educational opportunities. Educational equity is the intentional allocation of resources, instruction, and opportunities according to need, requiring that discriminatory practices, prejudices, and beliefs be identified and eradicated.
NSBA recognizes the critical role school committees have in accomplishing equitable outcomes for all students. School committees establish systemwide goals, adopt policy and budgets, and review and provide feedback on school improvement plans, school handbooks, and curriculum. Through each of these areas, school committees are uniquely positioned to reaffirm their commitment to equitable outcomes and to take specific actions to ensure each child thrives in the district's schools.
One of the districts we worked with shared the following goals as a result of their equity review:
- Establish an explicit vision and definition of equity. The school committee can establish its vision for equity by working with stakeholders to explicitly define the concept for the district.
- Include the school committee's vision for equity in the school committee policy manual. The school committee may wish to add a specific policy (AD) within Section A: Foundations and Basic Commitments.
- Create a policy specific to equity. The policy may provide the school board with an explicitly stated focus on educational equity, including the inclusion of equity practices in the district's strategic plan. A sample policy is shown in “Educational Equity.”
Prepare Your Data Culture
You have documents and data and fingers crossed, and the support of your governing body. Now what do you do with all of it? Alas, it is time to use data to make decisions about school and district improvement. Data‐based decision‐making is when teams of educators use formative and summative evaluation procedures to make decisions about student intervention/instruction. Throughout your improvement process, your MTSS team will engage in a strategic problem‐solving process to identify student needs and designate intervention and progress monitoring protocols. The district and school leadership teams will also use this data to evaluate districtwide and schoolwide outcomes, consider how to make programmatic and instructional decisions based on those outcomes, and use this data to inform the MTSS action plan. We have four concrete tips for supporting data‐based decision‐making in equitable MTSS:
- Set a positive data culture
- Create a comprehensive assessment map
- Design a data decision flowchart to inform tiered supports
- Create data systems
Set a Positive Data Culture
It is essential that a culture exists that supports the use of data not solely for needs assessment purposes, but to drive instructional decisions and address inequities. Staff can articulate the value of using aggregated and disaggregated data to support all students, and professional development time is dedicated to helping staff learn how to use data to drive instruction and monitor interventions. We created the following prompts for MTSS teams to reflect on data culture:
- What are your current feelings about how this district uses data to impact instruction and improvement efforts? Please be candid in your response.
- What specific steps would we need to take to make data conversations more meaningful in our ongoing work?
- What barriers do we face if we want all stakeholders to have important conversations about data and how that data impacts instruction and improvement efforts?
The conversations that result from the previous questions may impact team norms or future planning. Although it may seem unnecessary to have these discussions, we strongly recommend that you take the time to build a coherent understanding of your data culture. As a leader, you may feel as though there is a strong culture of data, but staff and families may feel differently. Consider the following possible planning implications.
- You may want to collaboratively define a vision for data use in your organization.
- You may want to provide direct professional development on the value of data and on data literacy.
- You may want to assess your organization's capacity for data culture and competency and create a related initiative or action plan item on your improvement plan based on your self‐assessment results.
Create a Comprehensive Assessment Map
An assessment map is an inventory of assessments. An assessment map should include universal screeners, diagnostic assessments, and progress monitoring tools focused on academic skill development as well as social emotional and behavioral development across all three tiers. It is critical to reflect on the assessments available to educators so you can identify potential gaps. Universal screeners identify students who may experience lower than expected academic outcomes and/or need acceleration and enrichment. Diagnostic assessments are administered to students who fall below a predetermined level in the screening assessment to provide in‐depth information about an individual student's particular strengths and needs for Tier 2 supplemental instruction and/or Tier 3 intensive intervention. Progress monitoring assessments are used to assess targeted intervention skills and to mark student progress over time. A sample assessment map for elementary literacy is in Table 6.1 and a sample assessment map for high school literacy is in Table 6.2. You may want to begin with an assessment inventory to identify any gaps. If you recognize gaps in your assessment structure, you will address this when drafting your strategic objectives. Questions to ask at this stage include:
Table 6.1 Sample elementary literacy assessment map.
| Tier 1 Assessments Universal Screeners | Tier 2 Assessments Diagnostic Assessments/Progress Monitoring Tools | Tier 3 Assessments Diagnostic Assessments/Progress Monitoring Tools |
|---|---|---|
|
|
|
Table 6.2 Sample high school ELA assessment map.
| Universal Screeners |
|
| Diagnostic Assessments |
|
| Progress Monitoring Assessments |
|
- Do you have to acquire evidence‐based universal screening tools, diagnostic assessments, and progress monitoring tools to create a data culture?
- Are the assessment maps consistent across the system within grades?
- Are assessment maps reviewed regularly to ensure they provide effective data to support students across all tiers and domains (i.e., social emotional and behavioral in addition to academic)?
- Do the assessment maps align to assessment calendars that articulate the audience, scope, and timing for each assessment?
- Are pertinent staff trained in assessment protocols and analysis for all adopted assessments articulated on the map?
Design a Data Decision Flowchart
In a multi‐tiered system of support, Tier 1 academic, social emotional, and behavioral expectations are articulated and known by all. Within Tier 1 there is a range of supports to meet the needs of all learners. In addition, there is a range of Tier 2 and 3 academic interventions (supplemental to Tier 1) targeted to specific skills/needs of the student and identified by assessment data. All instruction, interventions, and supports are evidence‐based, culturally sustaining, and universally designed. Data is used to monitor the effectiveness of interventions regularly.
When you consider the need for assessments to drive the services provided to students, creating a decision‐making flowchart or what we call a data tree may be helpful. Too often, we work with schools that do not have clear entry and exit criteria for tiered support. Working with your core team and other stakeholders to create a data tree (Figure 6.2) will help educators decide which students may need additional support.
Create Data Systems
In a well‐articulated approach, district and school‐level data systems track student performance over time. These data systems provide regular performance feedback to school teams, coaches, and individual staff for problem‐solving, professional development, and action planning. Data systems include not only the data sets/platforms but also the meeting times and protocols needed to utilize the data effectively.
The Data Wise Improvement Process, created by Harvard University, is an eight‐step model that guides teams of educators from schools or systems in working collaboratively to improve teaching and learning through evidence‐based analysis (Boudett, City, and Murnane, 2013). As school leaders, we are reminded by the Data Wise process that we can help our schools and district decide in advance what short‐, medium‐, and long‐term data we will gather and how we will gather it for future data meetings, and where we will continually loop back to determine the impact we have on all learners. Questions to ask at this stage include:
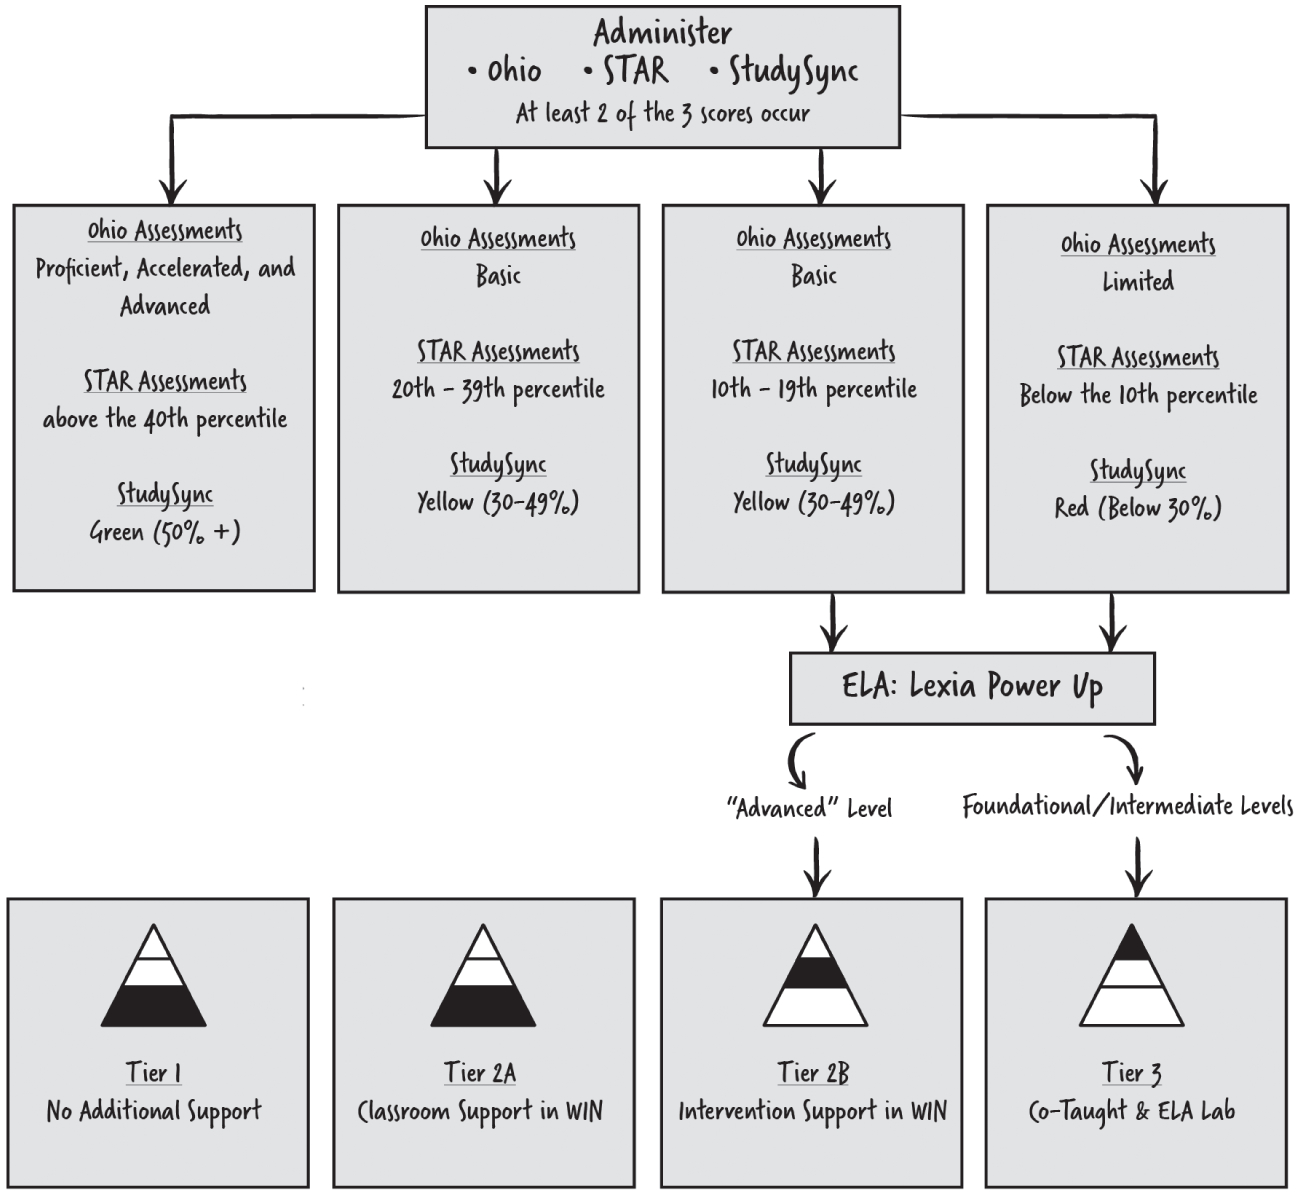
Figure 6.2 Sample data tree
- Do we have the data systems/platforms we need to track student performance over time and across multiple measures effectively?
- Do all staff have appropriate access to the data they need?
- Do our data systems effectively “talk to one another” and give us a holistic picture of student strengths and needs?
- Does the system set aside time and have defined protocols to ensure data meetings run effectively?
- Is there time to effectively use data to identify student needs and progress indicators via common planning time?
Summary
Diving deeply into data, and creating a robust data culture, is necessary as a foundation for equitable MTSS. We have to set goals for more equitable outcomes, and we need evidence‐based data tools to drive continuous improvement. Reviewing multiple forms of data is necessary to better understand district strengths and areas for improvement and will inform the self‐assessment process.
Reflection Questions
- How would you describe your current data culture on your team and districtwide? How do you know?
- Assessment maps are critical to driving continuous improvement. As you consider your suite of assessments, what are the strengths, and where are potential gaps?
- How does your district currently make decisions about student support based on data? Do you have a data decision flowchart or data tree to support this work? If so, how could the development of one help to support educators with their decision‐making?
- What would you need to change in your school or district to have a robust data system inclusive of a strong data culture, evidence‐based assessments, educators who are proficient at using data to drive instruction, time to analyze data, and adequate resources to address areas of need?