
Chapter 9
Design Considerations
9.1 Examination of Diffusion and Reaction Rates and Cell Design
When embarking on the design of a new electrochemical cell, there are numerous factors to consider at the initial stages. After deciding on the chemistry and electrolyte to be employed, perhaps the most important factor to be reviewed is that of electrodes. What electrode materials will be used as the basic structure upon which the energy storing reactions will occur?
In most electrochemical cells, the electrode participates directly in the processes. Examples of this are the lead-acid, nickel-cadmium, lithium-ion, and metal hydride cells. In the case of redox-type cells, whether they are of the full flow chemical couple devices or the static electrolyte concentration cells, the electrodes are designed to be electronically conductive but chemically inert. This property is chosen so that the system will have a relatively long life with chemically reversible reactions such that there are essentially no inherent chemical changes with a cell even after a very large number of cycles. There are very few systems that truly offer this distinctly desirable advantage. In almost all energy processes that employ chemical reactions, there are some irreversible processes that take an eventual toll on the device life.
The concentration cells offer the opportunity of circumventing most problems that beset conventional “batteries.” Electrodes are of great concern in these new types of cells because they are the “weakest link” in the operating cell life. All other processes are reversible in a practical sense. A material must be chosen that will not only be chemically inert but also inexpensive and have sufficient electronic conductivity to enable efficient performance at higher currents.
9.2 Electrodes
Electrodes are possibly the single most demanding factor in cell design and performance. The only practical material that can meet these stringent requirements is carbon. There are many forms of carbon. The most conductive is what is generally known as graphite, a crystalline consisting usually of flake-like components staked in a somewhat orderly manner, depending on its method of production. Usually, commercial graphite is produced from a carbon granular material or hydrocarbon (organic) substance that is adhered together by another carbon compound bonding agent such as a phenol resin. The raw brick thus formed is placed in an oven in which the atmosphere can be controlled, and it is baked at elevated temperatures such that the hydrogen and oxygen are mostly driven away by decomposing the brick in an inert atmosphere to prevent the combustion of the carbon materials. The result is a substance that is mostly elemental carbon in composition (about 90–99%). If the appropriate temperature controls permit, the carbon brick can become mostly graphitic in form with a relatively high specific electrical conductivity.
Depending on how the brick was initially formed in its compression, the graphite particles may be largely aligned in a specific direction, thus making the final product anisotropic in both thermal as well as electrical resistivity. Subsequently, these bricks are cut into sheets or plates anywhere upward from 1/16 inch. Even though these plates are relatively fragile (brittle) and cannot easily be managed as a sheet of metal such as copper or zinc, they are chemically inert.
Other substitutes are available, such as exfoliated graphite sheets known commercially as Grafoil. They are expensive, have little mechanical strength, and will eventually separate in liquids. Pyrolytic carbons are far too expensive and have poor electrical and mechanical properties for this application. The only other materials with desirable properties are the noble metals such as platinum and ruthenium, but they are incredibly costly for any industrial or commercial use here. Titanium and tantalum have very high chemical resistance except, in certain cases, when used as a positive electrode where oxidation is taking place. Unfortunately, their resistance to chemical attack in active devices such as batteries is low, and they also tend to be quite expensive.
Electroplating or vapor depositing Pt or Ru onto the surface of titanium as electrodes is not only fairly costly, but it also provides a failure mechanism for cells when the thin plating wears off. So, for large-scale, inexpensive systems carbon in one form or another is about the only choice.
There is another method for forming electrodes from graphite or other elemental carbon materials – compression molding or graphite electrodes bonded by suitable polymeric materials such as high molecular weight polyethylene, PVC or PVF. The resultant product of this process is a thinner, less costly, and mechanically much stronger plate. The electronic resistivity is not much less than that of an all graphite plate, usually in the range of 10–3 to 10–2 ohm-cm. Metal conductors such as copper and zinc have specific resistivity in the range of 10–6 to 10–5 ohm-cm, at least 100 to a thousand times smaller. This difference has quite an influence over the physical design of a concentration cell that employs carbon electrodes.
9.3 Physical Spacing in Cell Designs
In view of the electrical limitations of a carbon electrode, more attention than normal must be given to metallic electrodes and their size and shape.
9.3.1 Electrode Structures
Electrode properties are very critical to effective and long-life performance of any electrochemical cell. It is the component wherein the electronic conduction into and from within the cell electrons are able to pass through an external load. Thus, it is desirable to have electrodes with minimum electronic resistance and the ability to make intimate contact with the electrolyte.
Most electrochemical cells employ metallic electrodes. An example of this is the lead-acid battery, in which lead is used to conduct the current and also participate in the electrochemical processes. Fortunately, lead is not chemically attacked by the sulfuric acid solution electrolyte and, consequently, has a reasonably long life. In the redox type of systems described here, metallic electrodes are not useable because of chemical oxidation and eventual destruction, if not upon exposure to the electrolyte, then certainly with charging/discharging cycling.
As described earlier, one of the greatest goals of redox types of secondary cells is a long cycle life. It was realized that the electrodes must not directly participate in the electrochemical process, in the sense that the solid materials of which it is constructed undergo any chemical or physical change necessary to the mechanism of the storage of energy. In the cases of the zinc/bromine, vanadium, zinc/chlorine, and iron redox systems, carbon is the only practical material to use for electrodes. Carbon is electrically conductive (though not nearly as much as most metals), readily available, inexpensive, and quite inert to chemical attack by most other substances at ambient and near ambient conditions. However, there are many other problems with which one is confronted when attempting to fabricate practical electrodes.
Carbon in its elemental form is a hard, electronically conductive substance in various crystalline forms, and it is most readily seen as coal or sublimed materials resulting from the combustion of organic compounds. There are virtually innumerable solid forms of carbon, thus making it difficult to generalize the material’s physical forms and properties. For example, graphite tends to have high electronic conductivity and a structure comprised of fairly long or large crystals. “Carbonizing” organic substances with high porosity such as peach pits and coconut shells can produce another form of carbon that has an extremely large surface area. If the carbonization of such materials is properly controlled, then the product can be almost 100% carbon with extremely high porosity. These latter products usually have lower electrical conductivity than the more graphite, larger crystal structures.
Since carbon is chemically inert to attack at ordinary temperatures, it is a very attractive material for electrodes in electrochemical cells, especially in redox type of devices. It is available in great quantities, and the element is consequently very inexpensive. However, the problem of fabricating carbon into the required geometric shapes (usually flat plates) must be dealt with.
Industrial or commercial carbon used in the construction of various devices is usually available in familiar bricks, plates, rods, and cylinders. Carbon can also be made into cloths and sheets by carbonizing any organic material in controlled ovens with an inert atmosphere such as nitrogen or argon so that most of the hydrogen, oxygen, and other components of the original material are driven off without oxidizing the carbon component, thus leaving behind the original skeletal carbon structure. Carbon electrodes that are mostly used in electrolytic cells are produced from graphite granules mixed with a suitable binder. Then they are fired in an oven, thus driving off or oxidizing the binder and leaving the initial carbon particles bound together as a plate or block.
Costs of such components are essentially due to the labor, energy, and capital equipment required to perform these manufacture operations. Unfortunately carbon components that are fabricated as thin plates in this fashion are very fragile and easily fractured. Also, such carbon plate electrodes are rather porous, ranging from a minimum of 5% to 20% interconnected pores. These holes are the result of the manufacturing process. The plastic (frequently a resin of some sort) binder that is used as the glue is decomposed and largely converted to carbon during the oven baking process. The gas components of the decomposed resins escape through holes in the plaques, leaving behind a somewhat porous end product.
Another limitation of such plate electrodes is their relatively low conductivity. Most graphite plates fashioned in this manner have a specific volume resistivity in the order of 0.01 to 0.001 ohm cm or a conductivity in the range of 102 to 103 mhos-cm, which is not much different, at best, than the values for graphite itself. If a plate electrode is to be made of this material for an electrode of 10 cm by 20 cm and 0.11 cm thick, then its resistance, R, along its length from top to bottom is found as

where ρ = specific resistivity, and L and A are the length and the area, respectively, of the plate. If ρ is 10–3 ohm-cm, then the plate resistance from end to end would be approximately (10–3) × 20 × 10 × 0.11 ohms, or 0.02 ohms.
To evaluate this in terms of usefulness in a cell, we must know the electrolyte resistivity and then the cell resistance. Strong electrolytes such as HCl and NaCl have a volume resistivity of 0.5 to 10 ohm-cm, respectively, at about 1 molar concentration. Employing these figures for a typical cell with the above dimensions for the electrodes and a space between electrodes in the range of 0.10 inch, or about 0.2 cm, the electrolyte resistance of the cell (if we use an average value of 5 ohm-cm for the solution) is about 5 × 0.2 × (10 × 20)–1 = 0.005 ohms. Such a cell would have most of its resistance contributed by its electrodes. If we were to reduce the contribution of each electrode by an averaging factor of two because the current is continuous along its length, then the ratio of electrode to electrolyte resistance would be 2:1.
The above situation strongly suggests that bipolar electrodes be employed in cell design. However, that type of design presents its own set of problems. Certainly, if conduction through the electrodes is perpendicular to the surface (assuming for the present that these electrode structures are isotropic), then their contribution to cell resistance is much less. The four principal concerns in such cell arrays of bipolar electrodes are the following:
- Electrode porosity
- Mechanical strength
- Cost
- Making contacts at the end electrodes to the outside circuitry.
Carbon plate pores can be significantly reduced by vacuum impregnation with various wax or low viscosity polymers. However, the porosity cannot be brought down to zero. Hence, we must still contend with some degree of porosity. This problem manifests mostly as a chemical attack from the electrolyte on any metallic contact made along the electrode length to reduce resistance. This situation is illustrated in the half-cell of Figure 9.1 below.

Figure 9.1 Metallic contact to electrode substrates.
Establishing effective electrical contact with the graphite plate electrode is another serious problem. It is necessary to use a conductive adhesive such as graphite-loaded epoxy or silver loaded resins and epoxies. Silver provides the best (lowest resistance) bond, but it is very susceptible to corrosion upon exposure to the electrolyte via diffusion through the plate pores.
Unfortunately, as was mentioned earlier, other than platinum, ruthenium, rhodium, and perhaps gold, there are no metals that can be employed as electrodes. These are all obviously too costly, and all other metals will be chemically attacked in a short time when exposed to the cell environment and especially when used as the positive terminal of the cell where oxidation takes place during charging. The very high electronic conductivity of most metals, their ability to be formed into any shape desired, their resiliency, and usually their ease of making a good electrical connection to external circuitry make them attractive to use in cells.
Returning to the matter of carbon in its many forms, there are methods that can be employed to make use of carbon as the electronic material interfacing the electrolyte while still avoiding high costs and physical limitations of fragility and handling. That approach is the use of carbon-plastic composites. Structures of this sort have been fabricated with great success.
9.4 Carbon-Polymer Composite Electrodes
Carbon particles such as graphite flakes can be molded with a suitable binder to any shape desired. In electrochemical cell applications, flat plates are most the most common geometry. Compression molding the carbon particles with thermoplastic polymers as the binders has been employed with significant success.
An example of this is an electrode with usable conductance, mechanical strength, and acceptable porosity. Graphite particles are almost always in flat, flake-like shapes primarily because of the crystalline nature of the materials. These graphite particles are mixed with dry particles of a plastic binder in a ratio that will yield a product molded, a flat plate product that can be employed to conduct electrical current within a cell. Since the particles have flake profiles, the final product of compression molding will be a plate with anisotropy properties regarding electrical and thermal conduction and also mechanical strength.
For the present, let us examine more closely the conduction mechanism through an electrode. The mathematics of dealing with real electrodes that are anisotropy and have a distribution of particle sizes and shapes is quite difficult to handle. The mathematics that describes conduction through somewhat irregular (non-uniform) distribution of particles throughout the structure becomes even more complex to deal with. Hence, we will assume a rather simplified approach in analyzing conduction through plates by making the following assumptions:
- All graphite particles are spherical in shape, and all are of the same size.
- The binder is assumed to be amorphous and totally compliant in shape.
- The distribution of carbon is random-orderly.
We will explore only one hypothetical configuration here. It assumes that all carbon spheres are aligned vertically such that all the spheres form a series of vertical columns perpendicular to the plane of the plate after compression into a plate. To simplify the drawing and visualization of this configuration, we will also let the polymer binder assume the shape of spheres in order to show the uniform spacing, as depicted in Figure 9.2. In reality, the polymer assumes a range of irregular shapes.

Figure 9.2 Electrode cross section.
The simple illustration is meant to show a 50% carbon to a 50% polymer ratio with all particles uniformly distributed in space. It is important to note here that the thermoplastic polymer is not caused to flow around the carbon particles during compression molding.
In fact, polymer binder materials (rigid plastics) that do not easily flow as a liquid at higher temperatures are selected. This selectivity is to prevent it from encapsulating, or surrounding, the conductive particles. The compression molding is more similar to a sintering process than to a casting process.
Returning to Figure 9.2, assuming that contact is made only between carbon particles in vertical direct contact, an idealized situation would exist in which no carbon particles are in contact with each other that can provide a continuous path from the first, top layer to the bottom layer. There then can be no electrical conduction through the plate. However, the introduction of a single carbon particle (shown as a particle with an “x” in its center) in this depicted three layer configuration would enable some electrical continuity because that symmetry has been disrupted. If there are four vertical layers, then it takes at least two additional, well placed carbon particles for electrical continuity in a vertical direction. This model permits contact conduction between adjacent particles as well as vertically adjacent or contiguous carbons.
A plot of conductivity versus composition ratio of carbon to plastic has the idealized curve as shown in Figure 9.3. According to this simplified model, the conductivity would be zero until a 50% ratio was achieved, and then the conductivity would slowly and linearly rise as the ratio of carbon to plastic increased. We can approximate the shape of this curve via the following analysis.

Figure 9.3 Conduction of composites on carbon/binder ratios.
The configuration shown in Figure 9.2 is an exceedingly simple representation of an idealized situation in which all particles are assumed to have a spherical shape and there are no physical, hence no electrical, contacts between carbon spheres in any one column and those in another adjacent column. Even though it is hardly a realistic model, it does provide a first configuration that can be subjected to simple analysis. Then, if practical, we might move on to the more complex configurations and conditions that more closely approximate actuality.
Isotropy was assumed initially for the sake of simplicity. Spherical particles should exhibit some anisotropy because of the direction or compression. And, if particles are flakes or some other shape, then the longitudinal conduction might be greater than the transverse.
9.4.1 Particle Shapes and Sizes
The binder is treated as amorphous in shape even though we know that is not so. We also may assume that the resistance of contact between carbon particles is the dominant factor, or the volume resistivity of the carbon is the larger factor. We will assume for the present that all the carbon particles are spherically shaped and are all the same size. It is further assumed, for the sake of simplicity of analysis, that they are all stacked vertically, and the spheres are maximally compressed together. Even though this is hardly an entirely realistic representation, the model can serve as a starting point for developing more representative structures for analysis. It does appear that the porosity of the carbon particles is far greater than that of the binders, especially when using high molecular weight Saran (polyvinilidene chloride), Kynar (polyvinilidene fluoride), or CTFE (monochloro-trifuoro-ethylene).
These latter polymers are generally known to have low porosity and higher viscosity.
9.4.2 Metal to Carbon Resistance
In order to permit acceptable conductivity along the length of a carbon electrode for use as end electrodes in cells in bipolar arrays or in all cells in a unipolar array, it is necessary to have a metal conductor, such as copper, bonded to those electrodes along their length. Low interface, or contact resistance, between metal and carbon requires that all surfaces be clean and flattened and that the metal be in a perforated or screen form in order to maximize adherence and bonding to carbon particles. It is interesting to note here that there are few materials that will “form a bond” with carbon in the sense that it will weld or adhere in some fashion. The only approach to holding onto a carbon plate is by mechanical means. In fabricating a solid plate from carbon particles and binder, the carbon is held together by being physically trapped by the binder materials in such a fashion that they are no longer free to move about as a powder. However, they are not bound so well that the carbon particles are isolated from each other. Hence, a binder is chosen that will have poor flow characteristics under high pressure and temperature. In this manner, care is taken to prevent the polymer binder from becoming a low viscosity liquid and encapsulating a large fraction of the carbon.
When attempting to bond a metal screen to such an electrode, the intention is that the binder polymer will adhere and become entrapped in the metal perforations while still providing good contact to the carbon particles that form a large part of the total electrode. In general, this technique works quite well.
9.4.3 Cell Spacing
Let us now return to the design issue of component spacing within a cell and how that contributes to the total cell resistance.
The principal contributors to total cell resistance, RT, are the following:
- Electrode bulk (volume) resistance, Rb
- Interface resistance between electrode and electrolyte, Ri
- Electrolyte resistivity, Re
- Membrane or separator resistance, Rm
- Contact resistance between metallic leads and carbon electrodes, Rc.
These five factors are the principal contributions, but there are a few others, such as polarization effects due to electrolyte starvation and potentials resulting from the interfaces between different electrolytes, that ultimately cannot be ignored.
The total cell resistance can now be simply expressed as

Now, we can attempt to assign some realistic values to these factors. First, consider the electrode bulk resistance contribution. The electrical conduction in the electrode is considered to take place by electrons flowing down the length of the plate electrode.
As described above, the plate resistance from end to end is ρ (L/A). If an electrode were 10 cm long, 5 cm wide, and 0.30 cm (1/8 inch) thick, and if the specific resistivity of the carbon plate were set at a realistic minimum value of 0.005 ohm-cm, then its total resistance would be approximately 0.03 ohms.
Now let us look at some empirical values for the other resistance terms. The interface resistance of electrodes’ surfaces treated with wettable materials of high surface area such as microporous carbon particles can be as low as 0.005 ohms for a 50 cm2 area electrode. Adhering conductive materials to the surface of the bonded carbon plates markedly improves their ability to make more intimate contact with the water-based electrolyte. Electrolyte resistivity from Table 9.1 indicates that the resistivities are in the broad range of 1 to 10 ohm-cm, depending on the materials in solution. If we take 5 ohm-cm as a low average for the types of salt solutions such as the alkali metal sulfides and iron halides, then a cell with such salt solutions as electrolyte and spacing on each side of 0.3 inches would have a value of Re is 0.06 ohms for total electrolyte contribution to its resistance. That leaves the contact and membrane resistance contributions to be determined. Membrane resistance varies greatly depending on whether the type of structure is merely mechanically porous or ion exchange materials. In essence, the electrical resistance of separators is a tradeoff between its effectiveness as a diffusion barrier and its ability to permit transport of ions under the influence of an electric field.
Table 9.1 Resistivity of some common solutes dissolved in water*.
| Solute | Concentration, Molarity | Resistivity, Ohm-cm |
| NH4Cl | 5.6 | 1.9 |
| 3.0 | 3.8 | |
| Cu2SO4 | 0.63 | 31 |
| HCl | 2.7 | 1.6 |
| 10.8 | 1.9 | |
| KI | 0.6 | 14.7 |
| 2.4 | 3.2 | |
| Na2CO3 | 3.1 | 3.2 |
| NaOH | 3.1 | 3.1 |
| 6.2 | 3.0 | |
| H2SO4 | 1.0 | 2.55 |
| 4.0 | 1.7 | |
| ZnCl2 | 0.74 | 13.8 |
| 1.48 | 11 | |
| KOH | 2.5 | 2.7 |
| 10.0 | 1.9 | |
| Na2S | 4 | 7 |
* All measurements were made at 18°C.
9.5 Resistance Measurements in Test Cells
A very simple and direct method for measuring the contributions of the various components of total cell resistance is described below.
A test cell is constructed in which the distance of separation between the electrodes can be varied in a controlled manner. In order to determine quantitatively the resistance of the electrolyte in such a cell, a number of measurements are taken at various separations, and a plot, Figure 9.4, is made of these values. If care is taken to keep all other factors constant, the plot should be a straight line whose intersection with the ordinate, as shown in Figure 9.4, is the value of the sum of all other resistances in that cell, including interface, contact with electrical connections, and electronic contributions of the electrodes themselves.

Figure 9.4 Cell resistance versus electrode separation.
The electrolyte resistance from equation (9.1) is evaluated by taking two or more measurements at different distances:
In this instance, we normalize the values of ρ by multiplying the resistance readings by the area, A, and the expression for ρ becomes
(9.3)

or, at two different intervals, L1 and L2:
(9.4)

The next task is to separate these other factors. The interface resistance of electrode-to-electrolyte is readily obtained by inserting a typical electrode surfaced on both sides between the two cell electrodes. Assuming that the contribution of electrode volumetric, electronic resistance is negligible, the measured increase in cell resistance would be due to the interface factor.
Similarly, contact resistance can be determined by employing an electrode with a metallic conductor encapsulated between two carbon plates, and of course, surfaced in the same manner. Any difference between that resistance and the previously measured interface resistance should be due to contact between the metal and carbon plate. There are other methods for determining this latter resistance factor involving test electrodes bonded together with and without metal screens to isolate their contributions.
9.6 Electrolytes and Membranes
Figure 9.5 is a bar chart that compares the resistance at room temperature of various, relatively common diffusion barrier materials. Except for the phenolic membrane (a microporous structure with no ion selective properties), all the others are made with ion exchange materials and are largely cation transfer membranes. Along with their resistance values, electrolyte and electrode resistances are given for a measurement cell using a 2 molar NaCl solution as a special standard.

Figure 9.5 Resistance contribution of cell components.
The resistance of most membranes contributes less resistance than both electrodes and electrolyte. The lighter shaded regions show the total or sum of cell resistance for each membrane.
Table 9.1 is a partial listing of some of the more common electrolytes employed in similar devices. As one would expect, acids have the lowest resistance due principally due to the very low specific ionic resistivity of hydrogen. Furthermore, the resistivities of the compounds of the heavy elements tend towards the higher end. The concentrations of the solutes are given in molality rather than in terms of the more common molarity units.
The conductivity of our example concentration cell that makes use of Na2S is in the range of the better conducting solutes.
9.7 Energy and Power Density Compromises
Certainly, the most important properties, other than operating life and cost, of any energy system are its abilities to store energy and deliver power efficiently to a useful load. A cell design with static electrolyte is limited in its ability to deliver either of these two important characteristics because it is invariably a compromising situation to offer acceptable performance for a particular set of applications. Other than some materials variations and selection of components, the major design latitudes involve cell geometry. In particular, cell spacing has the greatest influence simultaneously on energy density, ED, and power density, PD.
As the spacing between electrodes in a concentration cell increases, the capacity of that cell with the same area of electrodes increases. In fact, the increase is linear with respect to spacing. However, the internal resistance of the cell also increases with spacing. If the cell is optimized in terms of minimum contributions to resistance by all other factors other than electrolyte, then the increase in cell resistance also increases linearly with electrode separation distance.
A quick glance at the tradeoff shows a square relationship between power density and spacing. Even though most of us are familiar with the relationships between source resistance and the efficiency of power output, it is worthwhile to briefly review the salient aspects of the subject with regard to an electrochemical cell. In the simplified circuit shown in Figure 9.6, the power, PL, delivered to the load is
(9.5)

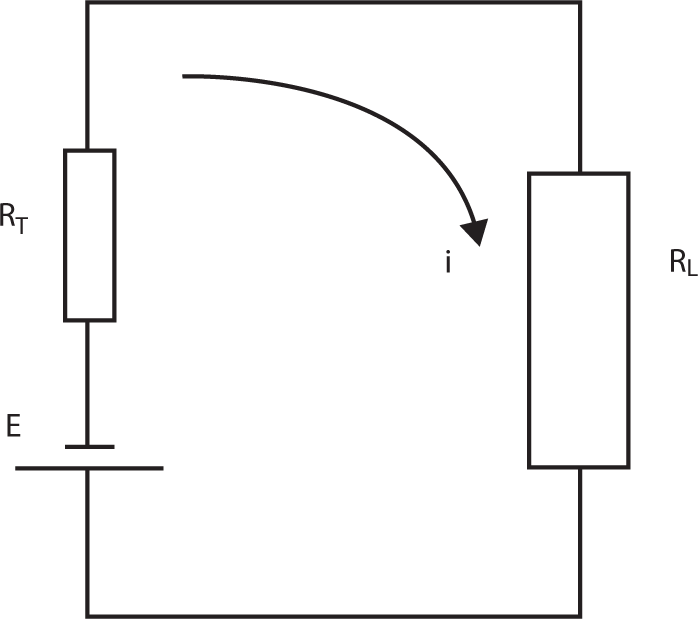
Figure 9.6 Electric current flow in a single cell circuit.
where E(Q) is the cell voltage at any time, but more appropriately, when the charge remaining in the cell is Q. RL is load resistance, and RT is total cell internal resistance.
Continuing with the mathematics,
(9.6)

and if we solve for the load voltage giving the maximum power delivered to the load by differentiating PL with respect to RL, then we obtain
(9.7)

By setting this to zero and dividing both sides by (RT + RL)–2, we obtain
(9.8)

Of course, operating a cell in such a fashion would result in half of the energy being dissipated uselessly within the cell in the form of heat. Thus, it is important to again reach a compromise between efficiency and the size of the device and PD versus ED. The tradeoff is between power delivery capabilities and energy density. Unfortunately, all devices have some amount of internal mechanism that results in energy dissipation. In this case, it is the sum of all resistances within a cell. As the spacing between electrodes increases, the ED increases, and the internal resistance due to the increased path length through the electrolyte increases also. Let us assign a ratio, β = RT/RL, to those parameters. In all cases it is desirable to have β as small as possible. As cell spacing increases, β increases. As spacing increases in the design of a cell, its ED increases as well because its charge capacity is directly proportional to the thickness of the storage region of porous carbon layers. If we neglect the contribution of the electrodes and use separators with near zero resistance, then the cell resistance can be equated to its thickness per unit area, or
(9.9)

where K is a constant of proportionality and w is the cell width.
Now, since the unit volume of cell per unit area is simply w, and the volumetric energy density is ED = Q/w, the power density can similarly be equated to the cell thickness as follows. Referring to equation (9.2) and substituting RL = RT/β, we have

which shows that as RT becomes smaller and as β becomes larger, the PD and ED increases. It becomes obvious also that as w is made larger PD diminishes and ED increases accordingly. That is demonstrated by substituting equation (9.10) into the value for RT, or
(9.11)

As we explore the various parameters and their influence on cell performance, it becomes more obvious why other approaches to cell array designs have been adopted. Since carbon is the only material that is chemically inert, electronically conductive, and reasonably inexpensive when compared to any other metal with suitable properties, the attractiveness of its use is obvious for any electrochemical cell where the material of the electrodes are not intended for participation in the energy storing processes. Conduction down the length of a carbon electrode has high resistance. Hence, the alternative immediately apparent is to insert (encapsulate) a highly conductive metal such as copper within the electrodes to conduct longitudinally, which permits the conduction through the carbon plate to take place in a low resistance manner perpendicular to its surface direction. This tactic involves making more complex electrodes more susceptible to failure. However, it is a solution to the problem.
Another approach is the full flow electrolyte cell (and arrays of cells in a module). Such a design is more complex and requires additional components, but it can solve the problems of cell imbalance while also providing a means of separating the power delivery and energy capacity characteristics of the system. The energy would be stored not within the cells but in the liquid electrolyte storage reservoirs. By such designs, the PD and ED of a cell are made independent of each other, especially if the module arrays used electrodes in stacks of cells using bipolar electrodes. As always, however, new difficulties arise, such as maintaining uniform flow through all cells and preventing electrolyte starvation in any one cell due to very different hydraulic impedance between cells in series electrically and in parallel hydraulically.
If designs with static electrolytes were to employ intermediate series cells as bipolar so that conduction would be normal to the electrode surfaces, then the need for conduction down the electrode length would be only for the end electrodes. These end plates can be quite thick or can embody a metallic backing to reduce impedance. In either case, their increased cost and weight can be amortized over a fairly large number of bipolar electrodes in an array.
9.8 Overcharging Effects on Cells
Concentration cells are essentially self-regulating. Overcharging should not result in damage to the cells, nor should any gas be evolved. Once again, let us take the case of the sulfide system. When full charge is reached in these cells, and if further charging is attempted, the cell will reduce the charging current because its internal resistance will be greatly increased by the augmented formation of free sulfur at the positive electrode surfaces. There is always the risk of the evolution of hydrogen in the decomposition of water that would eliminate the possibility of a truly hermetic seal. One solution is to employ non-aqueous solvents that would not generate hydrogen ions. The other solution is to carefully control the charging voltage so that it does not exceed the decomposition of water potentials.
9.9 Imbalance Considerations
When more than one cell is in a series array, a serious risk of cell imbalance is encountered. Since quality control does not permit an absolute match of cell characteristics in actuality, some cells will reach full charge before others. In that event, if charging continues, some cells will tend to become overcharged. In most batteries such as the lead acid, this situation is largely self-regulating because hydrogen evolves at the negative electrodes when full charge is achieved. Some deleterious effects will result, but the situation is not severe if imbalance can be minimized. A solution to this problem is either to employ non-aqueous solvents or to charge cells in parallel and discharge in series, which requires some complex and, perhaps, impractical circuitry.