5
Materials Used in Electronic Equipment and Manufacturing Perspectives*
Daniel D. München1, Pablo Dias2, and Hugo M. Veit1
1Federal University of Rio Grande do Sul, Post Graduation Program in Materials, Mine and Metallurgy Engineering (PPGE3M), Department of Materials, 9500, Av. Bento Gonçalves, Porto Alegre – RS, 91509-900, Brazil
2University of New South Wales, Faculty of Science and Engineering, School of Photovoltaic and Renewable Energy Engineering, 229 Anzac Parade, Kensington, Sydney, NSW 2052, Australia
5.1 Introduction
It is common ground that the invention of the transistor in 1947 by John Bardeen, Walter H. Brattain, and William B. Shockley provided the breakthrough for electronic equipment. Transistors, which had become less expensive than previous technology (e.g. vacuum tubes), did not burn out in service, and were much smaller and more reliable, had allowed electronics to enter all fields of human life and to provide functionalities that were unimaginable a few years before. Transistors then evolved to integrated circuits (ICs) that were manufactured with about 10 individual components on a 3 mm2 silicon chip. By 1970, the number of components was up to 1000 on a chip of the same size. In the following year, the first microprocessor was introduced, which contained all the arithmetic, logic, and control circuitry required to perform the functions of a computer’s central processing unit (CPU) (Scace 2016).
Then, by the mid-1980s, inexpensive microprocessors had stimulated computerization of an enormous variety of consumer products. Common examples included programmable microwave ovens and thermostats, washing and drying machines, television sets and self-focusing cameras, videocassette recorders and video games, telephones and answering machines, musical instruments, watches, and security systems. This widespread use of electronics has without a doubt generated advantages for society and individuals, since the performance of such devices had improved, not to mention the increase in functionalities. In addition, the following years allowed each new generation of products to reduce costs and advance in technology.
Consequently, for every new electrical and electronic equipment (EEE) with better features, aesthetics, and quality, a new discarded one has been created. According to StEP Initiative (StEP 2014), “e-waste is a term used to cover items of all types of EEE and its parts that have been discarded by the owner as waste without the intention of re-use.” Nonetheless, final disposal, e.g. landfills or dumpsites, should not be thought as the first resource, given EEE can, in many cases, be prepared for reuse after repairs or remodeling.
Before 1990, EEE was disposed of as general waste, which corresponded to dumpsites in most countries. In reality, e-waste is chemically and physically distinct from other forms of municipal or industrial waste. It contains both valuable and hazardous materials that require special handling and recycling methods to avoid environmental contamination and detrimental effects on human health. Recycling can recover reusable components and base materials, especially copper (Cu) and precious metals. However, due to lack of infrastructure, high labor costs, and restrictive environmental regulations, rich countries tend not to recycle waste electrical and electronic equipment (WEEE). Instead, it is either landfilled, or exported from rich countries to poor countries, where it may be recycled using primitive techniques and ignoring worker safety (Robinson 2009).
Since the concept of resource conservation received considerable attention in the 1990s, European governments managed WEEE by creating laws to impose responsibility to manufacturers and importers (Fan et al. 2013). Two WEEE standard categorizations were created by the European Parliament (Parliament 2012), the first was valid from 13th August 2012 to 14th August 2018 as a transitional period, and the latter from 15th August 2018 onward. However, the most cited and used in the literature is still the classification used in the transition period. Both are listed in Table 5.1 and are based on similar characteristics, collection, function, and technology of EEE. Each category includes a whole set of examples and subcategories, which sum up more than a thousand appliances.
Over the years, the literature has been focusing on this categorization regarding WEEE characterization and recycling. Therefore, a WEEE generic composition investigation is mostly avoided due to the difficulty in sampling and the wide range of materials, which change constantly with the technology evolution. Widmer et al. (2005) have reported a WEEE generic composition estimate and it is shown in Table 5.2. This content emphasizes the massive presence of metals and plastics, whose contributions are around three-quarters of the mass of every WEEE unit generated. Another generic WEEE content is reported by de Meester et al. (2019), which not only brings a simplistic view of materials but also reveals the dominant presence of metals and plastics. However, when the investigations take into account the individual categories mentioned earlier, the composition tends to vary considerably, as seen in Figure 5.1 for six of them. As a result, Sections explore materials and chemical elements that constitute the most common WEEE.
Table 5.1 WEEE categories according to the European Parliament.
| Transitional period | After 15th August 2018 |
|---|---|
|
|
Source: Based on Parliament (2012).
Table 5.2 WEEE generic material composition (%).
| Composition (%) | ||
|---|---|---|
| Material | Widmer et al. (2005) | De Meester et al. (2019) |
| Iron (Fe)/steel | 47.9 | 20.0 |
| Copper (Cu) | 7.0 | 12.0 |
| Aluminum (Al) | 4.7 | 15.0 |
| Nonferrous | 1.0 | — |
| Gold (Au) | — | 0.05 |
| Palladium (Pd) | — | 0.01 |
| Total metal | 60.6 | 47.06 |
| Flame-retardant plastics | 5.3 | 52.94 |
| Non-flame-retardants plastics | 15.3 | |
| Glass | 5.4 | — |
| Rubber | 0.9 | — |
| Wood and polymer | 2.6 | — |
| Ceramic | 2.0 | — |
| Printed circuit boards (PCB) | 3.1 | — |
| Other | 4.6 | — |
Source: Based on Widmer et al. (2005).
5.2 Large Household Appliances (LHA)
Appliances in this WEEE category subgroup appear in the literature quite often, e.g. home laundry machines, ovens and microwaves, refrigerators, stoves, and air treatment equipment, mostly in terms of volume generated. The most common materials found in these appliances are metals like Fe, Cu, Al, and steel alloys, diverse plastics and organic substances like rubber and fibers, glass and ceramics mixed with low amounts of metals in printed circuit board (PCB). Figure 5.2 shows some examples of large household appliance (LHA) and their content, in which steel and plastics are dominant.

Figure 5.1 WEEE content in percentage. LHA, Large household appliances; SHA, small household appliances; ITE, IT and telecommunication equipment; CE, consumer electronics; EET, electric and electronic tools; and TLS, toys, leisure, and sport. Note: TLS content presented in the reference reaches values above 100%.
Source: Adapted from Parajuly and Wenzel (2017).
The composition of these LHA, also called as white goods, varies considerably from product to product, especially among different brands. In addition, the “greener” or “eco-friendly” these appliances become, resource efficiency increases. The critical materials are mainly found on PCB of this type of equipment, which may contain on average 20 ppm Pd, 160 ppm silver (Ag), and 38 ppm Au (Reuter et al. 2013).
5.3 Small Household Appliance (SHA)
With no more than 50 cm of size at any dimension, these appliances are the most common in terms of quantity due to the variety of features. Design is also a major factor influencing the sale of this category since consumers are often drawn into appearances. In addition, many have been produced as “not intended to be durable” items, leading to no reuse or upgrade.
By being small in size allows it to be easily disposed of in general municipal landfills or dumpsites, as opposed to, for example, a washing machine due to size and weight. Furthermore, the infrastructure worldwide that separately collects small WEEE is inadequate, and there is significant lack of expertise related to its collection and treatment. The variety, complexity, and cost of small household appliance (SHA), along with low market demand, frequently makes reuse and recycling unviable, mostly due to the heterogeneous, compact, and difficult-to-dismantle products (Dimitrakakis et al. 2009).

Figure 5.2 Most common large household appliances composition (%). ATE, air treatment equipment; DW, dishwasher; MW, microwave oven; RA, refrigerator appliance; WM, washing machine; Other, dryers, food preparation appliance. (Goosey and Goosey 2019; Islam and Huda 2020; Menikpura et al. 2014; Oguchi et al. 2011; Reuter et al. 2013).
Source: Adapted from Goosey and Goosey (2019), Islam and Huda (2020), and Oguchi et al. (2011).
Regarding composition, plastics assume the majority of weight in percentage, followed by ferrous and nonferrous metals as Table 5.3 expresses. Among plastics, acrylonitrile butadiene styrene (ABS) and polypropylene (PP) account for 75 wt% of SHA, whereas polystyrene (PS) and polyvinyl chloride (PVC) sum up about 15 wt%. Others were found in smaller quantities, e.g. polyamide (PA) and polycarbonate (PC) (Dimitrakakis et al. 2009).
Figure 5.3 shows a few examples of SHA and their composition by weight. It is observed that plastics and Fe dominate most of the cases, followed by Al and Cu. Other metals are contained in the PCB, but in small amounts.
Table 5.3 Small household appliances generic material composition in %.
| Material composition | % | Material composition | % |
|---|---|---|---|
| Ferrous metals | 8.99 | Steel and ferrous metals | 50.10 |
| Nonferrous metals | 8.22 | Mix of plastic | 31.30 |
| Plastics | 40.70 | Motors | 7.10 |
| Rubber | 0.69 | PCB | 3.00 |
| Cables | 7.55 | Cables | 2.90 |
| PCB | 0.52 | Aluminum | 1.40 |
| Electronic components | 18.41 | Others | 3.40 |
| Others | 14.91 |
Source: Adapted from Biganzoli et al. (2015) and Dimitrakakis et al. (2009).

Figure 5.3 Small household appliances examples composition (%). PCB, printed circuit board.
Source: Adapted from Parajuly and Wenzel (2017).
5.4 IT and Telecommunications Equipment
5.4.1 Computers and Notebooks
In general, computer equipment is assembled from more than 1000 materials, citing chlorinated and brominated substances, metals, biologically active materials, acids, and polymer additives. The production of semiconductors, PCB, hard disk drives, and monitors uses particular toxic chemicals like dioxins, polychlorinated biphenyls, cadmium (Cd), chromium (Cr), radioactive isotopes, and mercury (Hg).

Figure 5.4 Precious and base computer parts metal content (g/kg).
Source: Adapted from Habib Al Razi (2016).
In terms of mounting parts, a personal computer consists of three major units: main machine (i.e. CPU, power supplier, fan, PCB, DVD-CD drive, hard disk, casing, etc.), monitor, and keyboard. A mixture of metals can be found in waste computers, such as Cu, Fe, Al, lead (Pb), zinc (Zn), nickel (Ni), tin (Sn), and even precious metals and rare-earth metals, as shown in Figure 5.4. Despite being small in absolute weight, Au, Ag, and Pd can be concentrated in an expressive amount when considering tons of this waste. In comparison, mineral ores that contain these metals have a concentration, in percentage, 0.0001 of Au, 0.01 of Ag, and 0.001 of Pd (Chagnes et al. 2016). In addition, a mixture of polymers, such as polyethylene (PE), PP, polyurethane, and others, are also present. Computers also contain ceramic materials, such as glass, and other inorganic and organic materials. In terms of other valuable metals, Cu is concentrated in significant amount for recycling purposes.
Table 5.4 shows the difference between desktop and notebook regarding the main composition materials. While plastic is nearly absent in desktop computer, in notebook it represents more than a quarter of its weight. The opposite situation is observed in relation to ferrous material given it accounts for approximately half its weight in desktop computers.
5.4.2 Monitors and Screens
Televisions, PC monitors, laptops, tablets, surveillance systems, and other applications have monitors or screens constituted mainly of light-emitting diode (LED), liquid-crystal display (LCD), or cathode-ray tube (CRT) technologies, which contain specific chemical elements to generate images. Although the evolution in technology has originated successive replacements from CRT to LCD and from LCD to LED in monitors and TV, all three are present in waste flows.
Table 5.4 Notebook and desktop computer material content (%).
| Content (%) | ||
|---|---|---|
| Materials | Notebook | Desktop |
| Plastic | 25.8 | 2.8 |
| Ferrous material | 19.5 | 47.2 |
| Aluminum material | 2.4 | — |
| Copper cable and material | 1.0 | 0.9 |
Source: Adapted from Oguchi et al. (2011).

Figure 5.5 Content of most common materials/metals in screens technology and appliances.
Source: Adapted from Cucchiella et al. (2015).
Each of these technologies has been characterized, and variations in chemical compositions have been observed in Figure 5.5. The CRT TV and monitor units are mainly composed of different kinds of glass: panel glass (strontium – Sr/barium – Ba oxides), funnel glass (leaded that covers the CRT unit), and neck glass (highly leaded that covers the electron gun) (Habib Al Razi 2016). Figure 5.6 expresses each of these three glasses’ composition. Aside from the glass, the CRT units contain Fe/steel and an expressive amount of plastic, mostly due to the tube-shaped set, which sums up to approximately 17.5 and 16.5 wt% in TV and monitors, respectively. The variety of polymers is reported to sum up to about 10 different types in CRT monitors and televisions, mostly ABS, polycarbonate blends (PC/ABS), and PS (Wang and Xu 2014). The PCB and other components are reported to account for 8 and 13 wt%, respectively, for CRT monitors (Dias et al. 2018). It is also noticed that as the technology evolved (when flat screens were introduced), lower amount of plastics as well as less glass were used.

Figure 5.6 CRT monitor oxide content (%).
Source: Adapted from Dias et al. (2018).
Indium (In) is the most important material present in LCD screens regarding recycling value. In addition, LCD screens contain other valuable materials (e.g. Cu, Au, and Ag) located in the PCB. LED screens also add gallium (Ga), germanium (Ge), and other rare metals to materials embedded into LCD, present in high concentrations in small components (Cucchiella et al. 2015). The differences in the chemical element content from one technology to the other are mainly concentrated in critical and hazardous metals. For example, from LCD to LED TV, the amount of cerium (Ce) has decreased from 0.005 to <0.001 g/unit; the same tendency was observed for europium (Eu), lanthanum (La), praseodymium (Pr), terbium (Tb), and yttrium (Y). While CRT monitors and TV contain on average 464 and 1319 g/unit of Pb, respectively, LCD and LED monitors reported 16 g/unit and zero, respectively (Cucchiella et al. 2015). Cu content remains constant throughout technologies, which is interesting from the point of view of recycling.
5.4.3 Mobile Phones (MP)
Subjected to continuous technological evolution and better services in even more sophisticated devices, mobile phones (MPs) are a part of the lifestyle of increasing numbers of people everywhere, leading to obsolescence and new acquisitions of smaller, lighter, or more modern ones. A 2016 report estimated that 80% of individuals own a mobile phone in the developing world on average, and that this figure can rise up to 98% in high-income countries (World Bank Group and Flagship 2016).
Materials contained in MP are variable based on the model and its manufacturer, with no fixed design or list of contents applicable. For this reason, the sampling characterizations may also be misleading since different/several substances might be used as additives in very low quantities or traces by different manufacturers in the production of microelectronic components, for example (Fontana et al. 2019). However, a typical MP comprises PCB, battery, front and back cases, and a display unit. Studies to date have focused on the characterization of metals within PCB, since they have the highest metal concentrations and are relatively easy to disassemble compared to other components found in MP (Liu et al. 2019). Table 5.5 shows the weight average percentage of each of these mentioned parts of a mobile phone, in which plastics is the dominant material.
Table 5.5 Average material parts (in wt%) of mobile phones.
| Mobile phone parts | Content (wt%) |
|---|---|
| Plastic materials | 33 |
| Batteries | 24 |
| Electronic parts | 23 |
| Metal parts | 11 |
| Displays | 9 |
Source: Based on Fontana et al. (2019).
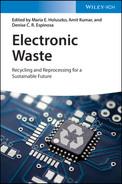
Figures 5.7 and 5.8 show metal contents reported by different authors. Both upright graphs are the continuity of the main graphs but with smaller content scale.
Figure 5.7 Mobile phones content (g/kg).
Source: Adapted from Oguchi et al. (2011) and Singh et al. (2019).

Figure 5.8 Mobile phone content (g/unit).
Source: Adapted from Cucchiella et al. (2015) and Zhang et al. (2017).
5.4.4 Printed Circuit Boards (PCB)
In spite of PCB not being an official category in the EU directive nor belonging exclusively to IT equipment, they were given their own subchapter because of their economic relevance, material diversity, and close relation with IT equipment.
Projected for mechanical support and electrical connection to the various electronic components, PCB are essential part of electronic equipment. Thermoplastic material and epoxy resin with flame retardants work as substrate, in which laminated Cu-sheets are etched. The complex mixture of polymers (plastics), silicates (Si-based), nonferrous and ferrous metals, with variable concentrations, is a challenge for recycling. The PCB weight fraction in relation to the total device varies from 2% for large electronic devices to 11% for laptop computers and up to 22% for mobile phones (Işildar et al. 2017).
Metal concentrations in PCB depend on the source, type of the board, manufacturer, and period of production, since manufacturing techniques, device-specific board designs, and soldering technologies are the main factors of diversity in PCB. Nevertheless, Cu is the predominant metal, varying in content from 15 to 35 wt% (Işildar et al. 2017). As an estimate, PCB are generally made up of 40% metals (mainly Cu, Pb, and Ni), 30% organic materials, and various inorganic oxides (ceramics) as a balance (Pietrelli et al. 2019). Other report summarizes PCB average content as Table 5.6.
The electronic components contain different metals of interest (arsenic – As, In, Ga, Ge, antimony – Sb, selenium – Se, Si, tantalum – Ta, tellurium – Te, titanium – Ti) and are attached to the conductive substrate through leads typically made of Pb/Sn alloy (up to 4–6% of the total weight) or occasionally of Au or Pd. Precious metals are used as contact material in lead relays, switchers, or sensors. Ni is used in its pure form and increasingly used in contacts as additive. Toxic metals, such as Pb, Cd, and Hg, are known to be present in the PCB of PCs (Pietrelli et al. 2019).
Table 5.6 PCB typical average content (%).
| Materials | Content (%) |
|---|---|
| Fe, Ni, Si, and Al | 29 |
| Cu | 22–27 |
| Ag | 0.2 |
| Au | 0.008–0.035 |
| Fiber glass | 30 |
| Epoxy resin | 15 |
Source: Based on Adie et al. (2017).

Figure 5.9 PCB content in g/ton of different appliances.
Source: Adapted from Pietrelli et al. (2019).
Figure 5.9 shows a PCB content, in g/kg, of internet modems, computer motherboards, and mobile phones. The “MIX” content is originated from unknown sources, according to Pietrelli et al. (2019). The amount of Cu is expressive, as expected, reaching nearly 300 g/kg, followed by other already-mentioned metals. Pb content is significantly high in the “MIX” fraction regarding its hazardous potential. Ag and Au have also occurred in significant amounts, nearly 1.7 g/kg of PCB. Figure 5.10 shows parts of a desktop computer PCB content, in which memory modules concentrate the majority of Au, while Cu is spread over the different parts of the board.

Figure 5.10 Parts of a desktop computer PCB content in g/kg.
Source: Adapted from Habib Al Razi (2016).
5.5 Photovoltaic (PV) Panels
These EEE have been recently spotlighted regarding recycling due to the fact that the first significant volumes of photovoltaic (PV) panels installed are now being discarded. Undergoing an evolution in technology, PV panels are nowadays classified in three generations: the first comprehends the monocrystalline or polycrystalline silicon panels, which differ in the purity degree of Si and, consequently, in the efficiency of energy conversion. Second generation is an arrangement of thin films deposited on a substrate (glass, stainless steel, etc.) with one or more layers. Different materials can be used to produce the thin film, including amorphous silicon (a-Si), cadmium telluride (CdTe), or copper indium gallium selenide (CIGS). Finally, the third generation includes emerging technologies such as concentrator photovoltaics (CPVs), dye-sensitized solar cells, organic cells, and hybrid cells (Padoan et al. 2019).
In terms of composition, crystalline silicon PV modules are made from the following materials, in order of mass: glass, Al frame, ethylene vinyl acetate (EVA) copolymer transparent encapsulating layer, photovoltaic cells, installation box, Tedlar® protective foil, and assembly bolts (Dias et al. 2017). Although Cucchiella et al. (2015) had not specified which type of PV panel was analyzed, the reported amount of each part, in grams/unit, is shown in Table 5.7.
The metals found by different authors in PV panels are shown in Figure 5.11. Their reports summed up 14 metals, according to the specific thin films used in layers. The evident discrepancy between the same metal contents reported by different authors can be justified due to the fact that each author considers one or another fraction of the panel, such as Al frame, metal contacts, and junction box (Padoan et al. 2019). Such fractions may or may not be included in the characterized material. In addition, it is known that the photovoltaic market is extremely heterogeneous, and the evolution of the PV technology moves toward decreasing the panel metal content, for example silver (VDMA 2019).
5.6 Lighting Equipment
Since 2010, LED have become affordable enough for general lighting and, as a result, these are expected to replace fluorescent lamps (FLs) and become the dominant lighting technology (Qiu and Suh 2019). However, FLs have still remained as the majority of lighting source in the recycling streams. Table 5.8 shows the main components found in FL lighting equipment and lamps, in which phosphorous powder is the major interest material due to the rare-earth elements contained therein, such as Eu, La, Ce, and Y (Figure 5.12). The replacement for LED lamps, which are more efficient and mercury-free, is not fully completed yet due to higher costs. LED lamps use also REE, making them possible targets for urban mining as well. The content of rare earths in LED is, however, lower when compared to FL, as Figure 5.13 expresses. The content of Y in LED used for background illumination in TV was reported to be 4.9 mg metal/display in contrast to 110 mg metal/display of cold cathode fluorescent lamps (CCFLs). For Eu the content is 0.09 and 8.1 mg metal/display, respectively (Tunsu et al. 2015).
5.7 Toys, Leisure, and Sport
Since the introduction of integrated circuits, toys have undergone a high degree of innovation and addition of technological features. A few examples include puzzles, board games, dolls, or sound and light toys that allow interaction with kids unimagined earlier, as well as educational toys. However, this integration has not been taking into account the reuse and end-of-life perspective. As for the majority of small WEEE, they have been produced as “disposable” items, not having been manufactured with upgradeability and reuse in mind (Pérez-Belis et al. 2013). This category, however, represented as little as 0.1 wt% of the arising WEEE in the EU in 2005 (Goosey and Goosey 2019).

Figure 5.11 Photovoltaic panels composition, in mg/kg. (Choi and Fthenakis 2014; Dias et al. 2016; Fthenakis and Wang 2006; Jung et al. 2016; Latunussa et al. 2016; McDonald and Pearce 2010; Pagnanelli et al. 2016; Pagnanelli et al. 2017; Paiano 2015; Savvilotidou et al. 2017).
Source: Adapted from Choi and Fthenakis (2014), Fthenakis and Wang (2006), Jung et al. (2016), and Pagnanelli et al. (2016).
Table 5.8 Components of lighting equipment (wt%).
| Components | Content (wt%) |
|---|---|
| Al | 4.0 |
| Glass | 80.0 |
| Phosphoric powder | 8.0 |
| Ferrous material | 5.0 |
| Other | 3.0 |
Source: Based on Biganzoli et al. (2015).

Figure 5.12 Rare-earth content in phosphorous powder of fluorescent lamps (in wt%).
Source: Based on Yurramendi et al. (2019).

Figure 5.13 Rare-earth oxides content (in g/unit) according to lighting type. CFL, compact fluorescent lamp; LFL (T5), linear fluorescent lamp 5/8 in. diameter; LFL T8, linear fluorescent lamp 8/8 in. diameter; LED, light-emitting diode.
Source: Adapted from Qiu and Suh (2019).
It is found that electronic components (PCB, wiring, switches, loudspeakers, LED, etc.) respond for 12.07 wt%, whereas plastic, ferrous metals, nonferrous metals, and other materials (rubber, textiles, and others) summed 87.92 wt%. Polymers such as PS, PP, and ABS are commonly found in toys. The weight of each category is shown in Table 5.9. A few other metals, such as Cr, As, Cd, Pb, and Hg, are found in some plastics parts, but quantities are within the limits established in restriction on hazardous substances (RoHSs) Directive (Pérez-Belis et al. 2013), which is responsible for restricting and setting the maximum amount of substances allowed in EEE. Toys and tools have also ranked among the most frequent brominated equipment, where more than 70% of equipment were found to contain the halogen (Hennebert 2017).
5.8 Future Trends in WEEE – Manufacturing, Design, and Demand
The global production of e-waste will change as economies grow and new technologies are developed; however, the concern with supply and demand of specific chemical elements and compounds, in recent years, has emerged as an issue. For instance, rare-earth metals, platinum group metals, Ga, niobium (Nb), Ta, In are listed as critical hi-tech metals by the USA, EU, Japan, and China, mostly due to an estimate that suggests, for example, that the use of LED in background lighting and in general will increase the demand for Ga 12 times by 2050 (Ueberschaar et al. 2017). The majority of these metals are usually produced as by-products of basic metals and will probably face scarcity of reserves in the near future. In addition, the case of rare earths demands special handling, since their minerals contain also radioactive elements.
The most prominent technology, that is pulling global demand for rare earths, is permanent magnets. Neodymium–iron–boron (NdFeB) magnets are the strongest permanent magnets commercially available today. They are used in a wide variety of applications, such as direct drive wind turbines, electric and hybrid vehicles, and are a key component of the transition toward a low-carbon energy economy (Rollat et al. 2016). Because of their unique physical, chemical, magnetic, luminescent properties, rare-earth elements are responsible for many technological advances, such as greater efficiency (performing at reduced energy consumption), miniaturization, speed, durability, and thermal stability. In recent years, their demand is particularly on rise in energy-efficient gadgets, which are faster, lighter, smaller, and more efficient. These technologies even assist in making analytical instruments smaller and more efficient (Balaram 2019). Currently (2020), few substitutes for rare earth-based materials are commercially available. In contrast to research on substitutes, research on ways of reducing rare-earth dependence has yielded more promising results. Governments and manufacturers are searching ways of diminishing or avoiding the need for rare earths (Smith Stegen 2015).
A new technology in TV, called QLED, is entering markets and being recognized as key materials for the next generation in displays due to flexible and ultra-high definition characteristics, and for color-controllable and healthy solid-state lighting. The QLED display consists of ITO anodes, lithium-doped aluminum (Li:Al)/Au cathodes, and CTLs with a QD layer, which are sandwiched between the anode and the cathode (Kim et al. 2017).
An evaluation regarding PCB of TV from 1980 to 2005 reports a content decrease in Cu, which varied between 5.1 wt% in 1980 and 12.8 wt% in the mid-1990s and decreased afterwards in PCB of newer model TV. Ag content also shows a decreasing trend, while Au composition seems to fluctuate within years. The main reason is due to thinner metal layers in new products with improved technologies and more compact designs (Adie et al. 2017).
Alongside, the concept of eco-design is getting more attention worldwide, since it supports the innovation of sustainable products. The practice focuses on minimizing material consumption and extending the lifespan of materials. At the same time, there is interest in developing new polymers for EEE that are not derived from petrochemical-based precursors, e.g. biodegradable polymer such as polylactic acid (PLA). This idea of designing with the end of life in mind (eco-design, design for disassembly, and others) has gained thrust especially due to the implementation of producer responsibility legislation such as the WEEE and RoHS Directives, since the manufacturers can reduce their liability at the end of a product lifespan by investing in its beginning (Goosey and Goosey 2019). A bamboo case used by Asus, recycled parts embodied by Dell, and As- and Hg-free in displays by Apple are a few examples of eco-design applied by IT manufacturers.
A report suggests that product eco-design, which uses tools like “Product Data Management (PDM) decisions” and “Design for X,” is better in terms of product optimal recovery strategy than recovery process technologies, like X-ray equipment that assesses the material composition and post-shredder Separation Technology. This means that the EU policy to make original equipment manufacturer primarily responsible for recovery, as implemented by the WEEE Directive, is appropriate, but more incentives are needed to reward product eco-design. From a recovery value standpoint, remanufacturing should be the prime recovery strategy, but it requires a high quality of returns. Moreover, the cost of misclassification can be high, so that for remanufacturing a PDM with reliable return quality information is needed (Zuidwijk and Krikke 2008).
Despite the benefits of eco-design, assembly for disassembly and others, EEE manufacturers from outside EU, where nonrestricted or even nonexistent environmental laws are applied, tend not to follow discretions in relation to their manufacturing processes. In most cases, singularities and specific designs are obstacles to the end-of-life WEEE that could be reused, remodeled, or easier to be recycled.
References
- Adie, G.U., Sun, L., Zeng, X. et al. (2017). Examining the evolution of metals utilized in printed circuit boards. Environmental Technology (United Kingdom) 38 (13–14): 1696–1701. https://doi.org/10.1080/09593330.2016.1237552.
- Balaram, V. (2019). Rare earth elements: a review of applications, occurrence, exploration, analysis, recycling, and environmental impact. Geoscience Frontiers https://doi.org/10.1016/j.gsf.2018.12.005.
- Biganzoli, L., Falbo, A., Forte, F. et al. (2015). Mass balance and life cycle assessment of the waste electrical and electronic equipment management system implemented in Lombardia Region (Italy). Science of the Total Environment https://doi.org/10.1016/j.scitotenv.2015.04.041.
- Chagnes, A., Cote, G., Ekberg, C. et al. (2016). WEEE recycling: research, development, and policies. In: WEEE Recycling: Research, Development, and Policies (eds. A. Chagnes, G. Cote, C. Ekberg, et al.). Amsterdan, Netherlands: Elsevier Inc.
- Choi, J.-K. and Fthenakis, V. (2014). Crystalline silicon photovoltaic recycling planning: macro and micro perspectives. Journal of Cleaner Production 66: 443–449. https://doi.org/10.1016/j.jclepro.2013.11.022.
- Cucchiella, F., D’Adamo, I., Lenny Koh, S.C., and Rosa, P. (2015). Recycling of WEEEs: an economic assessment of present and future e-waste streams. Renewable and Sustainable Energy Reviews 51: 263–272. https://doi.org/10.1016/j.rser.2015.06.010.
- De Meester, S., Nachtergaele, P., Debaveye, S. et al. (2019). Using material flow analysis and life cycle assessment in decision support: a case study on WEEE valorization in Belgium. Resources, Conservation and Recycling https://doi.org/10.1016/j.resconrec.2018.10.015.
- Dias, P., De Oliveira, E., and Veit, H. (2018). Lead hazard evaluation for cathode ray tube monitors in Brazil. Brazilian Journal of Chemical Engineering 35 (1): 43–49. https://doi.org/10.1590/0104-6632.20180351s20160367.
- Dias, P., Javimczik, S., Benevit, M., and Veit, H. (2017). Recycling WEEE: polymer characterization and pyrolysis study for waste of crystalline silicon photovoltaic modules. Waste Management 60: 716–722. https://doi.org/10.1016/j.wasman.2016.08.036.
- Dias, P., Javimczik, S., Benevit, M. et al. (2016). Recycling WEEE: extraction and concentration of silver from waste crystalline silicon photovoltaic modules. Waste Management 57: 220–225.
- Dimitrakakis, E., Janz, A., Bilitewski, B., and Gidarakos, E. (2009). Small WEEE: determining recyclables and hazardous substances in plastics. Journal of Hazardous Materials https://doi.org/10.1016/j.jhazmat.2008.04.054.
- Fan, S.K.S., Fan, C., Yang, J.H., and Liu, K.F.R. (2013). Disassembly and recycling cost analysis of waste notebook and the efficiency improvement by re-design process. Journal of Cleaner Production 39: 209–219. https://doi.org/10.1016/j.jclepro.2012.08.014.
- Fontana, D., Pietrantonio, M., Pucciarmati, S. et al. (2019). A comprehensive characterization of end-of-life mobile phones for secondary material resources identification. Waste Management https://doi.org/10.1016/j.wasman.2019.08.011.
- Fthenakis, V.M. and Wang, W. (2006). Extraction and separation of Cd and Te from cadmium telluride photovoltaic manufacturing scrap. Progress in Photovoltaics: Research and Applications 14 (4): 363–371. https://doi.org/10.1002/pip.676.
- Goosey, E. and Goosey, M. (2019). The materials of waste electrical and electronic equipment. In: Waste Electrical and Electronic Equipment (WEEE) Handbook (eds. V. Goodship, A. Stevels and J. Huisman), 231–262. Elsevier https://doi.org/10.1016/B978-0-08-102158-3.00008-2.
- Habib Al Razi, K.M. (2016). Resourceful recycling process of waste desktop computers: a review study. Resources, Conservation and Recycling 110: 30–47. https://doi.org/10.1016/j.resconrec.2016.03.017.
- Hennebert, P. (2017). WEEE plastic sorting for bromine content is essential to enforce EU regulation. International Waste Management and Landfill Symposium (Sardinia 2017), Cagliari, Italy.
- Işildar, A., Rene, E.R., van Hullebusch, E.D., and Lens, P.N.L. (2017). Electronic waste as a secondary source of critical metals: management and recovery technologies. Resources, Conservation and Recycling, December 2016. doi:https://doi.org/10.1016/j.resconrec.2017.07.031.
- Islam, M.T. and Huda, N. (2020). Assessing the recycling potential of “unregulated” e-waste in Australia. Resources, Conservation and Recycling https://doi.org/10.1016/j.resconrec.2019.104526.
- Jung, B., Park, J., Seo, D., and Park, N. (2016). Sustainable system for raw-metal recovery from crystalline silicon solar panels: from noble-metal extraction to lead removal. ACS Sustainable Chemistry & Engineering 4 (8): 4079–4083.
- Kim, J., Shim, H.J., Yang, J. et al. (2017). Ultrathin quantum dot display integrated with wearable electronics. Advanced Materials 29 (38): 1700217. https://doi.org/10.1002/adma.201700217.
- Latunussa, C.E.L., Ardente, F., Blengini, G.A., and Mancini, L. (2016). Life cycle assessment of an innovative recycling process for crystalline silicon photovoltaic panels. Solar Energy Materials and Solar Cells 156: 101–111.
- Liu, W., Ford, P., Uvegi, H. et al. (2019). Economics of materials in mobile phone preprocessing, focus on non-printed circuit board materials. Waste Management https://doi.org/10.1016/j.wasman.2019.01.044.
- McDonald, N.C. and Pearce, J.M. (2010). Producer responsibility and recycling solar photovoltaic modules. Energy Policy 38 (11): 7041–7047. https://doi.org/10.1016/j.enpol.2010.07.023.
- Menikpura, S.N.M., Santo, A., and Hotta, Y. (2014). Assessing the climate co-benefits from waste electrical and electronic equipment (WEEE) recycling in Japan. Journal of Cleaner Production https://doi.org/10.1016/j.jclepro.2014.03.040.
- Oguchi, M., Murakami, S., Sakanakura, H. et al. (2011). A preliminary categorization of end-of-life electrical and electronic equipment as secondary metal resources. Waste Management https://doi.org/10.1016/j.wasman.2011.05.009.
- Padoan, F.C.S.M., Altimari, P., and Pagnanelli, F. (2019). Recycling of end of life photovoltaic panels: a chemical prospective on process development. Solar Energy https://doi.org/10.1016/j.solener.2018.12.003.
- Pagnanelli, F., Moscardini, E., Abo Atia, T., and Toro, L. (2016). Photovoltaic panel recycling: from type-selective processes to flexible apparatus for simultaneous treatment of different types. Mineral Processing and Extractive Metallurgy 125 (4): 221–227.
- Pagnanelli, F., Moscardini, E., Granata, G. et al. (2017). Physical and chemical treatment of end of life panels: an integrated automatic approach viable for different photovoltaic technologies. Waste Management 59: 422–431. https://doi.org/10.1016/j.wasman.2016.11.011.
- Paiano, A. (2015). Photovoltaic waste assessment in Italy. Renewable and Sustainable Energy Reviews 41: 99–112. https://doi.org/10.1016/j.rser.2014.07.208.
- Parajuly, K. and Wenzel, H. (2017). Potential for circular economy in household WEEE management. Journal of Cleaner Production https://doi.org/10.1016/j.jclepro.2017.03.045.
- Parliament, E. (2012). Directive 2012/19/EU on waste electrical and electronic equipment (WEEE). Official Journal of the European Union.
- Pérez-Belis, V., Bovea, M.D., and Gómez, A. (2013). Waste electric and electronic toys: management practices and characterisation. Resources, Conservation and Recycling https://doi.org/10.1016/j.resconrec.2013.05.002.
- Pietrelli, L., Ferro, S., and Vocciante, M. (2019). Eco-friendly and cost-effective strategies for metals recovery from printed circuit boards. Renewable and Sustainable Energy Reviews https://doi.org/10.1016/j.rser.2019.05.055.
- Qiu, Y. and Suh, S. (2019). Economic feasibility of recycling rare earth oxides from end-of-life lighting technologies. Resources, Conservation and Recycling https://doi.org/10.1016/j.resconrec.2019.104432.
- Reuter, M.A., Hudson, C., van Schaik, A., et al. (2013). UNEP (2013) metal recycling: opportunities, limits, infrastructure. A report of the working group on the global metal flows to the international resource panel.
- Robinson, B.H. (2009). E-waste: an assessment of global production and environmental impacts. The Science of the Total Environment 408 (2): 183–191. https://doi.org/10.1016/j.scitotenv.2009.09.044.
- Rollat, A., Guyonnet, D., Planchon, M., and Tuduri, J. (2016). Prospective analysis of the flows of certain rare earths in Europe at the 2020 horizon. Waste Management 49: 427–436. https://doi.org/10.1016/j.wasman.2016.01.011.
- Savvilotidou, V., Antoniou, A., and Gidarakos, E. (2017). Toxicity assessment and feasible recycling process for amorphous silicon and CIS waste photovoltaic panels. Waste Management 59: 394–402.
- Scace, R.I. (2016). Electronics. Encyclopædia Britannica, Inc.
- Singh, N., Duan, H., Ogunseitan, O.A. et al. (2019). Toxicity trends in E-waste: a comparative analysis of metals in discarded mobile phones. Journal of Hazardous Materials https://doi.org/10.1016/j.jhazmat.2019.120898.
- Smith Stegen, K. (2015). Heavy rare earths, permanent magnets, and renewable energies: an imminent crisis. Energy Policy 79: 1–8. https://doi.org/10.1016/j.enpol.2014.12.015.
- StEP (2014). Solving the E-waste problem (step) white paper: one global definition of E-waste. In Step Initiative. http://collections.unu.edu/view/UNU:6120#viewAttachments (accessed 18 March 2021).
- Tunsu, C., Petranikova, M., Gergorić, M. et al. (2015). Reclaiming rare earth elements from end-of-life products: a review of the perspectives for urban mining using hydrometallurgical unit operations. Hydrometallurgy 156: 239–258. https://doi.org/10.1016/j.hydromet.2015.06.007.
- Ueberschaar, M., Otto, S.J., and Rotter, V.S. (2017). Challenges for critical raw material recovery from WEEE – the case study of gallium. Waste Management https://doi.org/10.1016/j.wasman.2016.12.035.
- VDMA (2019). International Technology Roadmap for Photovoltaic (ITRPV) – Results 2018. Germany: VDMA Photovoltaic Equipment.
- Wang, R. and Xu, Z. (2014). Recycling of non-metallic fractions from waste electrical and electronic equipment (WEEE): a review. Waste Management 34 (8): 1455–1469. https://doi.org/10.1016/j.wasman.2014.03.004.
- Widmer, R., Oswald-Krapf, H., Sinha-Khetriwal, D. et al. (2005). Global perspectives on e-waste. Environmental Impact Assessment Review 25 (5): 436–458. https://doi.org/10.1016/j.eiar.2005.04.001.
- World Bank Group and Flagship, G. (2016). Digital dividends – overview. World Development Report 2016: 1–359. https://doi.org/10.1596/978-1-4648-0671-1.
- Yurramendi, L., Gijsemans, L., Forte, F. et al. (2019). Enhancing rare-earth recovery from lamp phosphor waste. Hydrometallurgy https://doi.org/10.1016/j.hydromet.2019.04.030.
- Zhang, S., Ding, Y., Liu, B., and Chang, C. (2017). Supply and demand of some critical metals and present status of their recycling in WEEE. Waste Management 65: 113–127. https://doi.org/10.1016/j.wasman.2017.04.003.
- Zuidwijk, R. and Krikke, H. (2008). Strategic response to EEE returns: product eco-design or new recovery processes? European Journal of Operational Research https://doi.org/10.1016/j.ejor.2007.08.004.
Note
- *Received 27 December 2019.