
You can easily troubleshoot issues in WIF by enabling tracing. It works similar to WCF tracing. In this recipe, we will discuss the steps to enable WIF tracing and see how the trace information can be viewed using the svctraceviewer.exe tool.
Follow these steps, to enable WIF tracing:
- Include the following configuration section in the
Web.configfile of the RP and the STS.<system.diagnostics> <sources> <source name="Microsoft.IdentityModel" switchValue="Verbose"> <listeners> <add name="xml" type="System.Diagnostics.XmlWriterTraceListener" initializeData="C:LogWebSTS.svclog"/> </listeners> </source> </sources> <trace autoflush="true"/> </system.diagnostics>
Notice the
switchValueattribute is set toVerboseto log the detailed trace information. - Initiate a sign-in request and access resources from the RP.
- Notice that the
WebSTS.svclogfile will get generated in theC:Logfolder (a similar log file will also get generated under the folder specified in the RPWeb.configfile, if communication with the RP is successful):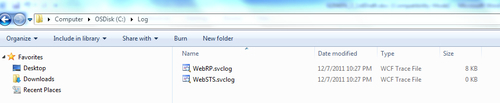
- Open the
WebSTS.svclogfile using thesvctraceviewer.exetool. The tool will show one or moreE2ETraceEventand any exceptions will get highlighted in red, as shown in the following screenshot: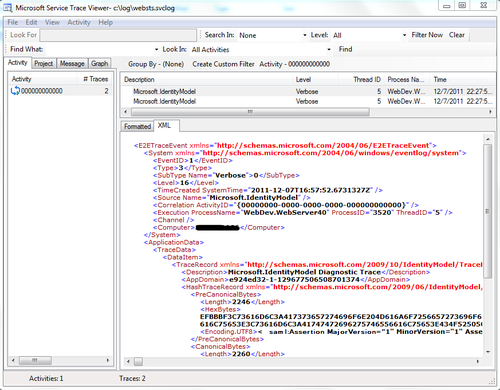
WIF tracing is a very powerful feature that enables developers of STS and RP to troubleshoot and monitor issues with WIF. Different trace types (such as ChunkedCookieHandler, HashTrace, and so on) are generated for the RP and STS under different circumstances. The MSDN article at http://msdn.microsoft.com/en-us/library/ee517282.aspx provides a detailed description of the trace scenarios for STS and RP, including federation and trust protocols.
In addition to WIF tracing, you can also use Fiddler to inspect HTTP messages and check if the tokens are getting generated appropriately. There is a nice WIF Fiddler Inspection tool available at http://identitymodel.codeplex.com/ that can be used to inspect federation messages.