
5
Managing Your Data Environment
The data elements that we capture in our transactional systems every day have enormous potential! We can generate interesting information to see whether we are still on track with our strategic objectives, how our business is doing, or how successful we are at what we do. With this gathered information and data we are able to take a variety of actions to improve our services, products, business operations, and so on. As described in Chapter 2, Unfolding Your Data Journey, we see issues with data quality and the need for data management in some form in order to advance in our data and analytics maturity.
Remember that the power of (big) data is not in the data itself but in how you use it!
Data management is the process of managing, maintaining, operationalizing, and securing your data environment. Data’s importance has grown significantly in recent decades; where we once thought data registers, metadata, or even data management were unnecessary, it now appears that data is an asset on company profit, loss, and balance sheets. As a result, as previously stated, data has enormous potential and value. This makes sense given the rapidly increasing amount of data. When working with qualitative dashboards and reports, we must consider our data environment.
To be honest, there are numerous books, methods, articles, and websites that discuss or describe data management, master data management, data governance, data quality, and other related topics. We’d like to share our hands-on approach to data management with you in this chapter. This way, regardless of how large or small your organization is, you will be able to address data management and take care of that important step in your data and analytics maturity and solve data quality issues from the start of your journey.
In this chapter, we will discuss the following topics:
- Introducing data management
- Understanding your data quality
- Delivering a data management future
- Taking care of your data strategy
Introducing data management
As previously stated (Chapter 2, Unfolding Your Data Journey), when we create information for our organization using data from our transactional systems, we encounter a variety of issues such as poor data quality, missing data, varying definitions of elementary data fields, and so on. Although business intelligence (BI) is not the cause of this problem, its use makes it painfully clear.
One of the primary reasons we should address and work on data quality issues is to save money! According to Thomas Redman’s book Getting in Front on Data, poor data quality accounts for 50% of an average organization’s operational costs. He also claims that organizations can cut 80% of their operational costs by improving data quality.
Another reason is to improve process quality and thus service quality. Customers appreciate it when a process runs smoothly the first time, and we will have happy customers. Good data is required to keep processes running smoothly and to achieve the goals that they must handle. Working on data quality is thus an important aspect not only for process improvement and progress toward error-free processes but also for a good reputation. Lower costs and satisfied customers are not the only reasons. Data is an important part of company strategy today, and thus an important asset for the company. It is possible to achieve efficiency and effectiveness in business operations by generating insights from the available data environment. Poor data quality stymies the efficient and successful implementation of data-centric business strategies, ultimately costing a company a lot of money!
Figure 5.1 describes the five fundamental points that explain the true potential of data and how to fully utilize it:
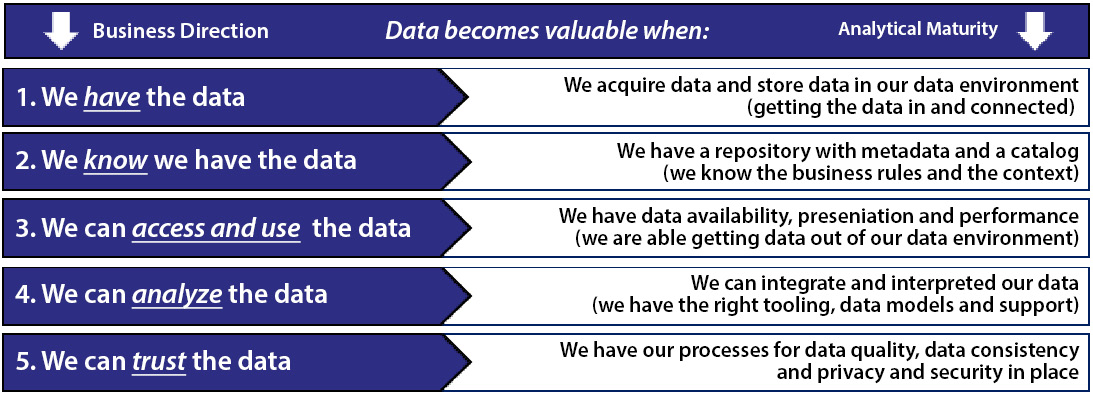
Figure 5.1 – Chart showing when data becomes valuable
By determining a data strategy that is stored, described, and accessible in order to use the data to analyze in a trustworthy manner, we must have processes in place for data quality, data consistency, privacy, and security.
Understanding your data quality
Our systems are overflowing with data to support both primary and secondary processes. This information is stored in the underlying databases of our transactional systems. We do this to support the steps in our processes and to create a large history of data in our databases. When we start extracting data, some complicated issues can occur: think of different formatting data elements, working with various platforms, or the frequency at which we can capture data. We need to take care that the extraction of data remains clean, consistent, and flowing. Unfortunately, data is not easily extracted from systems and converted into information. According to author Thomas Redman, a data element goes through two basic stages in its life:
- The moment when you first save the data element within the transactional systems
- The moment you use the data element
When we examine data thoroughly, we discover that the majority of our registered data is never used again after it is stored in our systems. When the data is of high quality, we can use it for data-informed decision-making, planning, and business processes.
The quality of data becomes apparent only when it is used to generate dashboards and reports. As previously stated, we frequently see data quality issues arise when an organization begins extracting and visualizing data, and it becomes painfully clear that we must address the elements of data management and data quality in our data and analytics processes.
By talking to business users, you are able to determine whether or not a data element is relevant for dashboards and reports. You can do this with the following types of questions:
- Is the data up to date enough for you as a business user, and can you easily access it if you need it for decision-making?
- Can you make sound decisions based on the information that is currently available?
- Is your data complete, or is there data missing that you require to complete your work?
- Is your data qualitatively correct, do you trust your data, or does the quality of your data vary?
- Is the data at your disposal relevant enough, and do you understand it?
- Can you interpret the data correctly?
Improving data quality is only possible if you look for the causes of bad data. There are three factors that influence the quality of data:
- Errors can occur when observing and recording data.
- The accessibility of data files to users at the desired location and time.
- A data element has no meaning on its own. Based on what they assume or know, business users assign meaning to data elements. The less freedom you have to interpret the meaning of a data element as you see fit, the more likely it will be correctly interpreted, understood, and applied.
Intermezzo – Starting to improve data quality in a small-scaled healthcare environment
We were able to do a project with various health care organizations a few years ago. This was a fun project because health care is a subject close to our hearts. We began with projects to truly understand what needed to be reported to authorities, as well as what needed to be improved in processes, and so on.
We began with some visualizations and reports. We discovered a data quality issue with some of the analyzed data fields from the initial visualizations and reports. To figure out what to look for, we talked with the product owner about which fields we were primary and which fields were secondary. To concentrate on the fundamentals, we identified several tables that needed to be addressed and discussed on a daily basis. For example, if you want to register a patient in the system, you’ll need their date of birth, address, urgency of the visit, gender, and so on.
These fundamental elements are required for classification and reporting to internal and external organizations. However, the accuracy of register time, dates, and so on is also important. Because data quality was not mentioned previously, we proposed adding a section to the dashboard with several elementary tables that had inconsistencies in registration quality. Figure 5.2 shows an example:

Figure 5.2 – Example of a data quality report
By including those reports, organizations were able to discuss data quality in a productive manner, and as we discovered, the data quality of those elementary fields was not only discussed but also corrected every morning! As a result, they noticed that the quality of their registrations, visualizations, and reporting was improving.
One of the most amazing moments during those times was when one of our customers told us that they were proud to see the data quality improving and that the beginning of the day was the ideal time to discuss the actions to improve.
Delivering a data management future
Many organizations want to get more returns from data and grow to a higher maturity level after delivering a solid data infrastructure and the first reports based on that new infrastructure. In practice, we see that data-informed decision-making does not succeed or even begin without the support of management and the entire organization.
Embracing data literacy will help you develop your decision-making skills, and people will learn to ask the right questions, interpret the findings, and take appropriate action. It is critical to give data management a prominent place within the data and analytics team or within your organization to ensure a steady supply of information. But keep in mind that data management is more than just buying a tool. It is, once again, a process that must be thoroughly set up in our data and analytics world. Figure 5.3 depicts the five steps in the framework that we use in our projects and the project approach. The data management framework will be described in detail in the following sections:
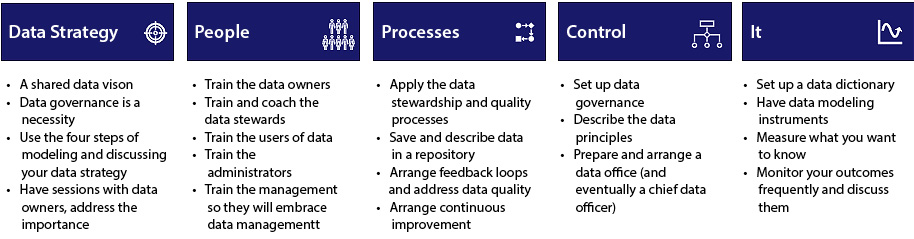
Figure 5.3 – The five-step approach of data management
When you are able to define and work on the displayed steps, you can actually begin (no matter how small the step) improving your data quality in a practical sense. Starting with the fundamental fields and adding them to your dashboards, you have the option of working to improve your data quality. Of course, the data quality reports must be discussed and actions taken; this is the human factor that is required to actually improve!
In the following section, we will go over the five steps in more detail.
Data strategy
Wanting everything is the same as wanting nothing at all. A data intake provides information on the most important technical and functional properties of a data element. By determining which data is required to measure organizational goals, you will only collect the information that is required for data-informed decision-making. This is the crucial part of creating and having a data strategy.
To be more specific, establishing a data strategy that is driven by the business strategy of an organization will help to guide all data management activities. A solid data strategy should also include people, processes, and technology to ensure that data as an asset is managed by the organization. To get attention and buy-in from the whole organization, the following steps could be considered:
- Distribute an internal questionnaire to elicit feedback, address the importance internally, and build support within your organization.
- Gather the results and set up interviews with the key players.
- Develop an approach plan and describe the actions that must be taken.
- Determine the data owners, data stewards, data architects, and the data engineers, then list them centrally.
- Discuss the norm of the levels of data quality; the system could be 95% full, but the quality is another figure that must be mentioned as well.
Getting buy-in within an organization can be arranged in several ways. We have three main points for you that can be taken care of in an easy manner:
- Provide context and explain why data management and data quality are important. This is achievable by making data quality a part of the daily operations (as we discussed in the intermezzo about a small healthcare environment in this chapter).
- Identify a challenger or an evangelist to address the issue(s) within your organization; this helps to create that needed buy-in.
- Set up communication channels to spread the word about the importance of data management and data quality (newsletters, monitoring, workshops, and so on).
Taking care of your data strategy
According to Bernard Marr’s book, Data Strategy:
As we discussed earlier in this chapter, it is no longer about the data we have at this point—it is more about your company and what you want to achieve with it. When you understand how data can assist you in activating your strategic objectives, you will be able to move forward.
Obtaining all of your data is not the way to proceed on your data journey. There are various types of data fields, and that is what you should consider before deciding what you want to use and how you want to use it. In Figure 5.4, we depict an information pyramid to illustrate how different data or information needs exist at each level of an organization. In Figure 5.4, the information and data streams are divided into three categories: Strategic, Tactical, and Operational.
Those levels have their own informational, and therefore data need. Decision-making is actually one of the three levels but varies in the level of detail, the number of targets, and so on. The bottom level is the Operational level where we will find fewer strategic decision-making reports but also more detailed information on what to do today, what my personal scores are, and so on. When we move up to the Tactical and Strategic levels, less aggregated data is required. Although the management needs to be able to ask their supporting teams for analyzing the values and target, detailed information is needed in the analysis section. But the management team needs to be able to see in one glance of an eye how the organization, department, or team is performing:

Figure 5.4 – The information pyramid
Creating a data vision
A data vision describes a set of decisions and choices made by an organization in order to map out high-level actions to achieve high-level objectives. To develop a solid data vision, we must first understand what we require in terms of data usage, including where it is stored, collected, maintained, shared, and used. To actually succeed in meeting your data and analytics goals, we need common methods and formalized primary and secondary processes. These methods and formalized processes are essential for establishing your data vision and therefore support your data strategy. We can use some common steps to achieve this, such as identifying your data, where your data is stored, how you can get your data, and if you are able to combine and enrich your data. In the following section, we will go over the steps to determining your data strategy.
Identifying your data
This crucial step, we believe, should be included in your measurement plan (functional design). When you describe the organizational goals, you should be able to locate the data you need to create visualizations or reports.
It is critical to determine what you require, how, and if you can use it. You will need to understand where it is stored, what is required to retrieve the data, what the descriptions are (the metadata), and, perhaps, if your organization is larger, you will also find data stewards and data owners.
As a general rule, if your organization truly views data as an asset and wishes to use it, your data strategy must ensure that the data can be identified, described, and used.
Discovering where your data is stored
Saving your data in a secure manner is critical for your organization and your data and analytics environment. In practice, we see data stored in small extrapolated data marts (created by any tool), such as relational schemas, star schemas, and so on.
When developing a solid data strategy, we must consider the fact that data must be accessible and shareable. When we have it in a secure location that is described and accessible, there is no need to copy the data and perform our technical magic on it over and over again.
Retrieving your data
We need to be able to retrieve data from a single point of truth, as we explain to our students and customers. Why should we rebuild connections or transformations over and over again when they have no value? The only thing that will happen is a massive increase in the number of dashboards and reports that contain various calculations that are not centrally designed or registered.
We also see a shift in which data is reused in more systems that support management decision support or business processes.
Combining and enriching data
Data integration (DI) solutions and so-called data pipelines are now commonly used to combine and enrich data. We can store structured data from our transactional systems as well as unstructured data collected primarily from external environments in our data environments.
We see in our projects that DI is not defined as a specific role within some organizations, so there is no cohesion between teams for collaboration (everybody is focused on their own bit of information or specific data integration projects). As a result, the work is mostly dispersed throughout the organization. This is a risk that we should be aware of; as organizations grow in size, you will most likely require a dedicated person to oversee the data teams. This will be covered further in our People section.
We discussed four steps to define the way we think about the data strategy and where we should focus our efforts. Keep in mind that sharing data in the form of pulling data from a data warehouse or other data storage and other types of environments is required. We should always approach it from a business necessity rather than a technical or IT necessity. For extracting, integrating, and transforming data, the needs and desires of the business must always come first.
The good news is that we’ve seen some fantastic data integration solutions where we can go data shopping. We can select datasets from a data environment in a webstore-like environment using those tools.
When we can work with data and integrate it into our environments, we can discuss data quality and even justify targets for our data quality levels from a governance standpoint.
Setting the standard
Only when the standard is known can data quality be measured. What are the content expectations, and is it absolutely necessary? Is 80% sufficient? Remember that while the systems may be completely filled, the quality of the data is unaffected. We can determine the desired business rules and standards through a series of structured workshops/interviews or questionnaires. As a small example, data entry is done by operations, and that data is stored in our databases. When we have 100 fields that need to be filled by our operations, we could expect a data filling or storage rate of 90%. But data entry and storage is one thing—that could be 90%—but the quality is often much lower—as low as 60%.
Determining the standard is a decision that must be made by management (support) in order to place data management on the strategic management agenda.
The end result will be that we will have a solid data strategy and will be able to measure our organizational goals. However, the human factor in this case is the next necessity that we must address, in order to identify why data is required, who is interested, and so on. As a result, we must consider that there are various types of roles within an organization, which are described in the following section.
People
People are required within an organization; they collaborate with transactional systems to support our primary and secondary processes, and all of them could (and should) be interested in data and contribute to improving data quality. This is determined by the person’s position within the organization and the type of work they perform. In this section, we will discuss the various types of roles that can be addressed if you want to improve data quality in your organization. Taking care of those roles, or implementing those depends totally on an organization. From our perspective, a bigger organization could obtain all those roles, but a smaller organization could have less roles, or combined roles.
Who has an interest in improving data quality depends on their position within an organization:
- When registering data in an organization’s transactional systems, an employee wants as little administrative burden as possible. They may wish to perform their duties with greater pleasure and less stress. In fact, it should be as simple as possible.
- Managers (at all levels) appreciate good reports that are based on good data quality (after all, dirty data in is dirty data out), and they would like to benefit from fewer repetitions, checks, or errors in data recording while performing data-informed decision-making.
- The data owner is in charge of the data in a specific data domain. A data owner is responsible for ensuring that information within their domain is properly managed across multiple systems and business activities.
- The data steward is a broad-minded data specialist who serves as a liaison between IT and the business within an organization. The data steward ensures that the data is correct, complete, and of high quality. They accomplish this with the assistance of the data owner, to whom they report.
- Data Architects should meet with the management teams and help to determine the method to gather the data that is required and how to organize it. The Data Architect reviews and analyzes the data environment of an organization, taking care of the planning of future data bases and help to investigate and implement technical solutions to manage data for their organization and its data users.
- A Data Engineer is someone who works in a variety of tasks from building systems to collecting and managing data, creating data models that convert raw data into usable information that others (Business Analysts, Data Visualization Specialists, and so on) within the organization can use. A Data Engineer works closely with the Database Administrators (DBA) and the Data Architect.
When an organization hires a chief data officer (CDO) (usually in larger organizations), the CDO is ultimately in charge of the entire organization and is a member of the management team. They assist organizations in transitioning to a digital, but most importantly, information-driven way of working.
In the following section, we will go into greater detail about the roles of the data owner, data steward, and CDO, as we see a growing need for more organizations to professionalize their data strategy and the need for those typical data office roles.
Data owner
The data owner is responsible for the data within a specific data domain, such as a data owner for HR data or facility management data. A data owner is responsible for ensuring that the information in their domain is properly managed across multiple systems and business activities.
As a result, the data owner must understand who the company is, what it wants, and how it is structured. The data owner understands the systems, which systems are used, who is responsible, and that data quality is critical in order to provide consistent and correct information to your end customers across your various channels.
Data steward
The data steward is a broad-minded data specialist who acts as a liaison between IT and the business within the organization. A data steward’s responsibilities include ensuring the data’s correctness, completeness, integrity, and quality. In addition to the data owner, they play a specific role in discussing data quality topics with the employees of that specific department.
On the one hand, the data steward is a source of information for all types of data-related questions. On the other hand, with the available data sources, they are constantly searching for (new) possibilities.
They understand the meaning and reliability of data, as well as its applications. The data steward is familiar with the company’s processes, data sources, and the organization and its customers. They maintain the connection between customers and the organization by analyzing and presenting data in the best possible way.
Chief Data Officer (CDO)
The CDO is ultimately responsible for an organization’s digital transformation, but most importantly, for an information-driven way of working. Aside from being a data-focused manager, they are also a data evangelist who double-checks the figures and numbers on the dashboards and inspires the organization to work from the standpoint of data-informed decision-making. The CDO must ensure that data is managed correctly and oversees data management activities.
If this position is filled with sufficient mandate and decisiveness, the CDO will be able to quickly demonstrate their value to the organization. In short, the CDO is the driving force behind an intelligent and data-informed organization.
By telling the story over and over, you build support and spread the importance of good data. Make certain that everyone in the organization understands why you should work on data quality, which obstacles to expect, and where opportunities for improvement exist.
You are able to achieve this by doing the following:
- Providing information on data quality (high-over and showing trends)
- Maintaining conversations with key players in your organization
- Planning and delivering workshops on the importance of data quality (showing the numbers, discussing the trends, and so on)
- Planning and delivering workshops on the proper registration of data elements (and explaining the importance of good registration, and so on)
Processes
A BI environment requires information that is consistent, integrity, trustworthy, and meaningful. As a result, the data quality process aims to achieve and maintain high data quality, ensuring better information for your business.
If you want to start improving your data quality, we can categorize the data quality forces as follows: data discovery, profiling, rules, monitoring, correction, and quality reporting.
In Figure 5.5, we see the six-step model in more detail:
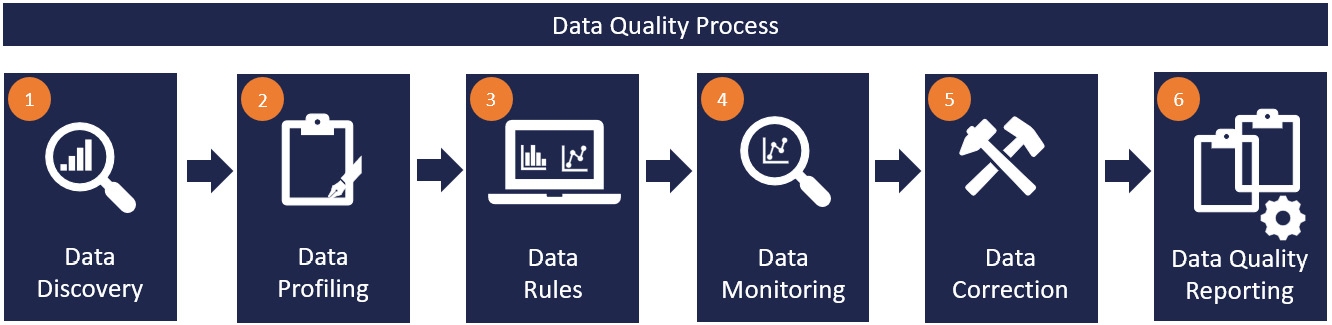
Figure 5.5 – The data quality process
Data discovery
When you begin gathering requirements for mapping out the required information, there are ways to design what is important for your organization based on your organization’s objectives (see Chapter 6, Aligning with Organizational Goals).
The next step is to identify the basic data fields for each process. What is important is that decisions must be made about whether or not to address data quality (for example, you tackle an elementary field, a less important field—perhaps because it is not used for decision-making, for example). See, for example, the story of pre-washing in Chapter 2, Unfolding Your Data Journey.
Data profiling
Data profiling is a method for data analysis that can give a quick insight into the value, structure, and quality of data. In Figure 5.6, we introduce you to several techniques that are involved in data profiling:

Figure 5.6 – Data profiling
With the different techniques described, it is possible to generate insight to determine how far data deviates from the norm. Data can also be examined for quality issues. These signals define the scope of the following step: improving data quality!
In today’s data world, it is also possible to use algorithms to visualize data quality. This can be a fairly simple algorithm that depicts outliers in the data—for example, detecting peaks and troughs of customers based on the first few digits of the postal codes. Peaks and dips in the collected, stored data can indicate a data quality problem.
Or, from a data science perspective, a neural network (NN) that predicts the value of an attribute based on other data elements, such as an algorithm that predicts a salary based on the age of a person, how many hours per week the person works, and the job title. The next step is then to compare the predicted salary with the registered salary.
It is also possible to easily detect another example of duplicate customers with an algorithm or, for example, place names, province names—Province of North Holland, Prov Noord-Holland, Province of NH, and so on. When you are able to detect anomalies, you will be able to identify and correct them in a sufficient way. When an algorithm such as this is trained well, it is possible to filter out a big amount of errors in no time; in this way, machine learning (ML) can make a radical difference. Data fields that should in any case be checked include the following elements so that a valid statement can be made with regard to data quality:
- Technical name
- Functional name
- Minimum value
- Maximum value
- The number of duplicates
- The number of numeric fields
- The number of NULL fields
- The number of rows
- The number of unique fields
Which fields must be checked or are fundamental for your data-informed decision-making must be determined per process, source, dashboard, or report so that we can focus on the correct data quality aspects. Aside from the previously mentioned elements, the following controlling aspects must be considered:
- Individuality (for example, a customer number may only appear once, or a social security number belongs to one person)
- Completion (postal code 999999 or 9999XX; this, of course, differs per country)
- Integrity (data that is referenced, for example, when entering an order for a customer; first, check whether the entered customer number exists)
- Reliability (date of birth of a person in system A does not match the date of birth of system B)
- Date logic (for example, 20220101/01JAN22/01-JAN-2022).
- General logic (house numbers should never begin with 0)
- Business or industry logic (for example, does a broker sell 100,000 houses per day?)
- Discontinuity (is the data still important for our data-informed decision-making or do we have to set a break from a certain period in time?)
- Meaning (Has logic that is not directly traceable been applied? Is there a mutual agreement? For example, an asterisk after the customer’s name indicates that the customer relationship has ended. This must be communicated to your data and analytics department.)
- Incomplete data (data not yet registered)
- Misusage of data fields; the data field is used for a purpose for which it was not designed and obtained, and so on
A method for conducting your research could be as follows: Determine what the quality issues are using data research. Investigate the data by performing a fault cluster analysis, for example (based on eliminating possibilities that could cause a fault to occur). Alternatively, conduct an event analysis (studies when the data is used and where errors can occur).
Then, determine the impact on the organization (what is fundamental and what is not).
Data rules
Applying data rules can be done from two types of perspectives: a technical point of view and a business perspective.
From a technical perspective:
- Using business rules in the data environment’s transformation layer (data warehouse, for example)
- Identifying errors and taking the necessary corrective actions
- Determining warnings and, if applicable, taking the necessary actions
- Creating automated feedback loops (for example, checking fields and linking this directly back to the business user via—for example—mailing)
- Beginning feedback loops (so that they can return to the agenda on a daily/weekly basis, or visual performance management—making data quality visible on monitors, for example)
- Reporting and correction (for example, by sending e-mails, making reports, and putting issues on the agenda)
- Configuring actions at the software vendor (making fields mandatory)
- Implementing data entry training to eliminate errors during registration
Intermezzo – a data quality issue causes problems
We created an amazing ServiceDesk application some time ago (back in 2008). We were able to analyze the data, from incident to machine, to see the software that was implemented on that machine and which provider we had to address the question to after working on the project, which was amazing! The management was completely unfamiliar with the transition from high aggregations to such a detailed level. Not having to wait 15 days for reports from our administration office, but having direct insight and more proactive actionability on the first of the month saved a lot of money at the time (and yes, a very positive business case!).
So, at the time, we were mostly walking around with a laptop, and we could easily show the facts displayed on the dashboard. However, if we wanted to know which machines had issues, we had to have the configuration ID (CI) of that machine, but if the CI was not a required field, you can imagine what happened during that time. However, by shortening the feedback loop, displaying the results, and preaching about the importance of data quality, we were able to help everyone understand why we needed to fill that CI. At the very least, data quality was on the team’s mind.
We ended up with a 99% qualitative CI filling in our system and were able to improve the machines that were causing problems.
Data monitoring
Monitoring allows for insight into the developments and trends of data storage and data quality. It is possible to detect an increase or decrease in the number of fields to be registered by monitoring the storage of those fields that are leading, or elementary, for example. We have an example displayed in Figure 5.7, with a suggestion on how to track the data storage within the transactional systems. This enables structural issues to be addressed directly at their source. These measurements must be repeated on a regular basis, not only during management meetings but also in regular discussions with business users:
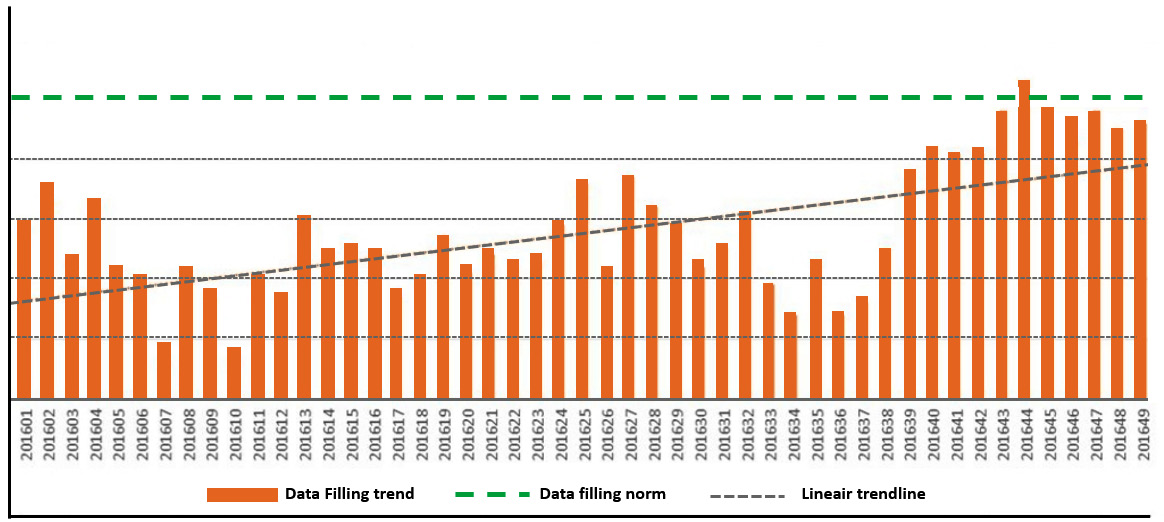
Figure 5.7 – Data storage monitoring
Data correction
Data correction is the step of cleaning, organizing, and migrating data so that it is properly protected and serves its intended purpose. It is a misconception that data correction means deleting business data that is no longer needed.
With regard to data that does not meet the standard, it is necessary to discuss whether the data should be cleaned, enriched, duplicated, and/or standardized. Addressing these issues can be done partly with the help of automated conversion rules and partly manually. Nevertheless, it should also be discussed with the data owners so that they are able to address data issues with their teams. This also forms the basis for the design of the data warehouse and data quality reports, which we will cover next.
New solutions are on the rise; with those new techniques, you will be able to show the data in—for example—a table, highlight the data, and give the opportunity to your dashboard and reports to correct the data on the fly! The new technology helps to see, correct, and restore the data back again in the original source systems. This technique is called write-back. Figure 5.8 shows an example of correcting budget figures:

Figure 5.8 – Using a write-back functionality
With this new technology, we are able to address, discuss, and correct data quality even better, and all of this from a pragmatic point of view.
Data quality reporting
Tracking, reporting, visualizing data, creating data flows, and monitoring data quality are all critical steps in monitoring data quality. This step requires determining which items can be converted automatically and which should be corrected by business users. Figure 5.9 is a standard data warehouse environment design with some steps (5) that can be added in a more simple and accessible manner:
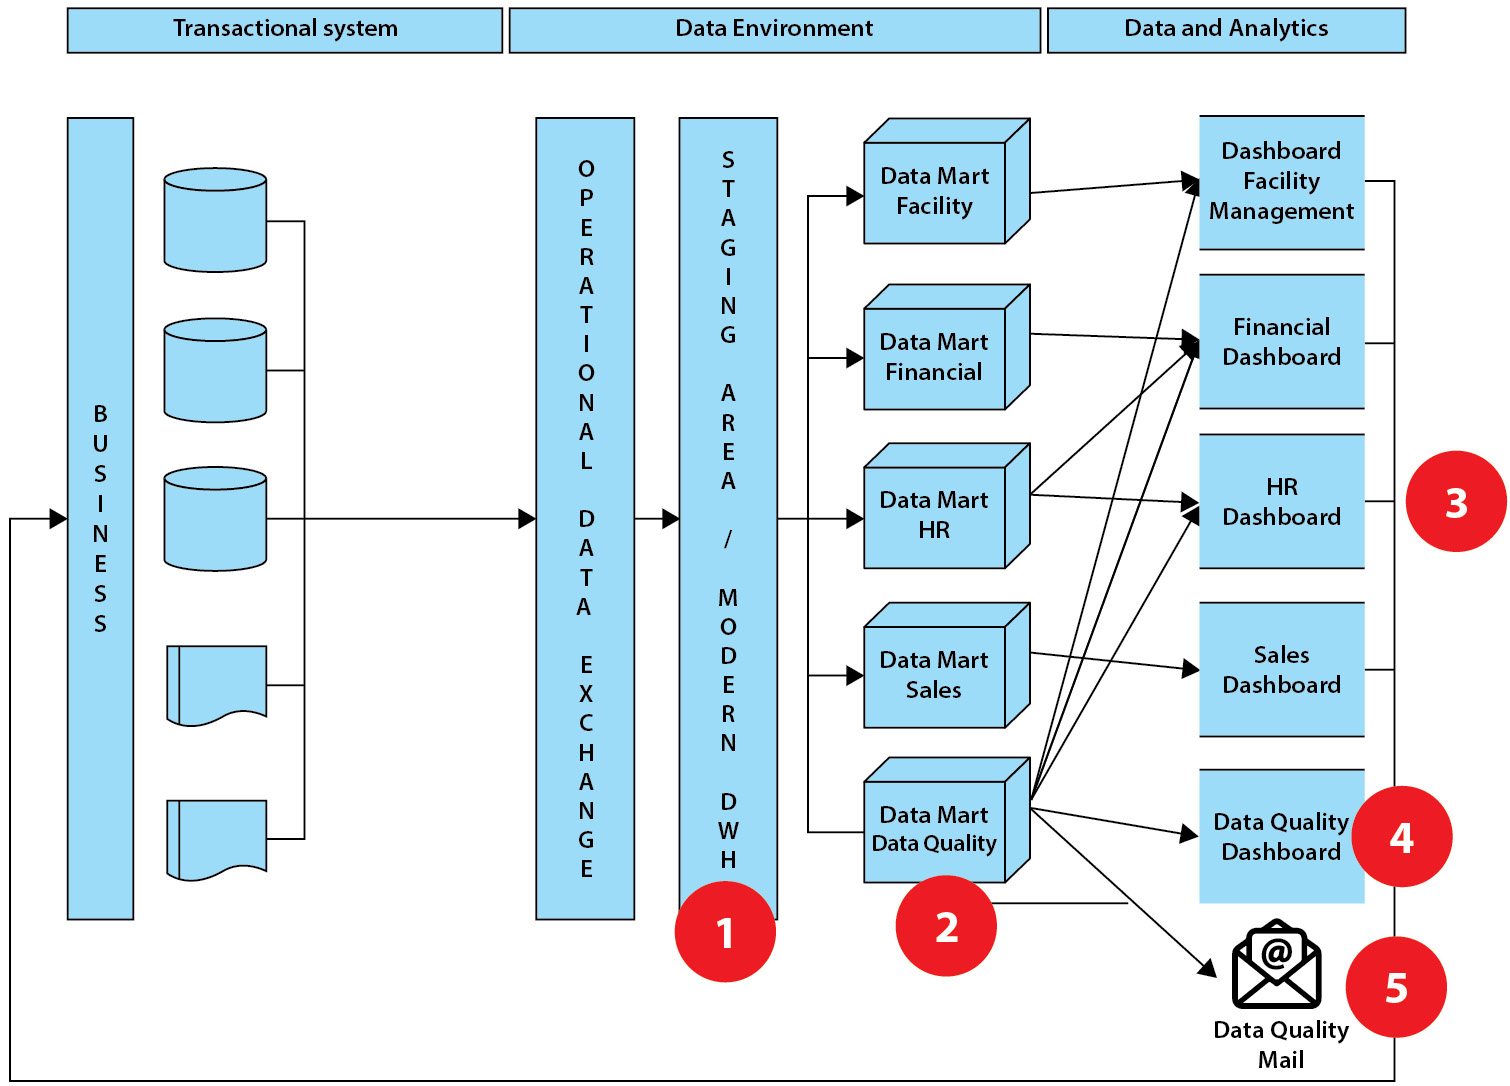
Figure 5.9 – Standard data warehouse setup with quality checks
In this example, we have included five points that can be addressed to improve the quality of your data:
- In the first step, errors and warnings can be set in the data environment, followed by transformations, corrections, or cleansing activities (business rules).
- Errors and warnings can be collected in a separate data mart (dataset for one specific process) and reported separately to the business and management.
- Reports on data quality can be included in operational dashboards. These can then be discussed from the standpoint of visual performance during stand-ups or startup meetings.
- A separate dashboard on data quality will be created, with elements such as data growth, error growth, and so on.
- Some tools allow you to send automated emails requesting that data fields in the source systems be changed.
You can easily start setting up the processes one by one by organizing your data environment in such a way that data management has a place and a prominent role within your data and analytics team(s).
Improving the quality of data
Monitoring, continuous improvement, and visualization in a data quality dashboard provide insights into the organization’s data quality development and trends. Any structural issues can be dealt with directly at the source. Figure 5.10 shows elements that we can track when our data environment is properly configured, as well as data elements for monitoring our data environment:

Figure 5.10 – Data quality dashboard
This screenshot contains elements that we have discussed in this chapter. These metrics will need to be discussed on a regular basis, not only during management meetings but also during regular discussions with business users. Only in this manner can we address data quality while also improving it.
Control
Control typically refers to an organization’s integrated and controlled processing of data on both a strategic tactical and operational level in order to achieve the desired quality and availability. The process of organizing, cataloging, locating, storing, retrieving, and maintaining data are the subjects of data management.
Control measures can be set up in various ways that mostly depend on the type of organization:
- Operational management or through the CDO (first line)
- An advisory function that assists line management in risk management, compliance, and planning and control (often the second line)
- A possible third line that oversees the first and second lines
- Consult with the organization’s controller about where hard and soft measures can best fit in
Data office
A data office is simply the team responsible for ensuring that the data within an organization best supports the organization’s objectives. At the highest level, the data office ensures that a comprehensive data vision and strategy are in place and being implemented. A data strategy is made up of three distinct topics:
- Data governance
- What are the critical data points for the organization? The data office ensures that these are visualized, described, and taken care of in accordance with the data governance principle.
- The data office creates a data policy and manages data quality and masters (the organization’s critical data elements).
- Transformative: It seems a bit strange to address the importance of a CDO being transformative. To clarify this is not that hard. Companies such as Amazon, Booking.com, Airbnb, and others are digital in their origin and use data and analytics beyond our imagination. Transforming from a traditional to a digital and data-focused organization is a radical process and causes significant organizational and cultural change. This is exactly why a CDO cannot be missed in this type of transformation within an organization. Some factors for that digital transformation include the following:
- It is vital that the business strategy and the data strategy are linked; the CDO and the data office will be responsible for this.
- Examining and prioritizing which data is critical for measuring business strategy and ensuring that processes and datasets are consistent.
- Measuring and monitoring storage, quality, and so on. Furthermore, this must be discussed at (strategic) management team meetings.
- Implementing, supporting, and monitoring the organization’s most critical data roles (data owners and stewards).
- Data empowerment. Because data does nothing on its own, organizational data literacy must be about people. Data means working with business users to get them excited about data and to help them develop their skills. In practice, this translates to the following:
- Implementing a data literacy framework, creating a plan, and securing high-level sponsors
- Ensuring continuous (self-)development and motivating business users
- Assisting business users in working with data and insights so that they develop the right mindset to want to work with data and insights (instead of having to)
- Collaborating with HR to create or purchase training materials and courses
IT
This section contains several technical options for organizations. We decided to highlight some critical topics that organizations should address in order to advance in their data management or data quality processes.
Data dictionary
To be able to register metadata (the glue that holds everything together) and thus speak a universal data language, data definitions must be recorded centrally. A data definition clarifies the meaning and naming of data, such as by storing (and using) table and attribute names and describing their meaning. A universal data language is analogous to two people (or systems) communicating; they understand each other better because they use common data definitions.
An important basis in data architecture is the recording of metadata in a metadata repository. This repository contains definitions of systems, datasets, concepts, data models, and data flows (data lineage) together. It is powered by the dictionary and a data modeling tool. The data architecture ensures that systems can exchange meaningful data and that systems, reports, and analyses build on good data.
Standardizing concepts and definitions
It is important to address and understand what is going on during the first data and analytics projects. It is important to speak the same data language and understand the definition of a data field, but also how the net revenue is calculated. We have seen many times in our projects that profit or revenue is calculated in several ways, therefore it is necessary to focus on standard descriptions and definitions. The resulting concepts should be recorded in a dictionary, which can simply be a list of concepts or a thesaurus that also includes how the global interrelationships between the concepts are described.
A data dictionary or company thesaurus can be completed in a variety of ways, including software solutions, Excel overviews, and solutions within data and analytics solutions. To explain it a little more in detail, we will tell you the story of one of our projects in the next intermezzo.
Intermezzo – data definitions are necessary!
We were working on a project a while back to create a new informational stream between two source systems. Those two source systems were created using different technologies. We were supposed to construct a direct message transport from the source system where the notification was received to the second source system. It was necessary to plan a visit and pass by someone to check and discuss some things from this second source system.
However, the addresses in the two systems did not match because they were interpreted and programmed differently in both systems. So, occasionally, a person passing by the client went to the wrong address, and the client was fined for not being home.
There was a connection between the governmental systems (where people in a municipality lived) in this source system, but a person could be officially registered somewhere but be living at another address.
In this case, we advised the project members and client to return to the drawing board and discuss the data fields that needed to be transported correctly from one system to the other.
Data modeling instruments
A data modeling tool is required from an IT standpoint not only to keep track of the data pipelines but also to serve the right information areas with the help of a created data environment. We will not recommend any software because this book is not about tools and is completely agnostic. The tools out there in the world are amazing, and usable for all organizations. What you choose is determined by the type of organization and the tools that are already in place. To be honest, there is no such thing as a bad tool in the world; choose wisely and remember that it is fine to have more than one tool—it is just important to understand where each tool is used and what is built with it! You can then grow beyond your wildest dreams.
Summary
Recognizing that poor data quality or a lack of data management can lead to a number of issues. In addition, if you do not have a data vision or data strategy that supports your organizational objectives, your organization is likely to focus on the wrong (non-relevant) objectives. Having a data strategy and a clear vision of where you want to go with your data and analytics plans can help an organization advance in its data and analytics maturity.
We now have a better understanding of data, data management, and data quality after reading this chapter. We have provided you with a five-step framework that includes data strategy, data people, data processes, data control, and data IT steps.
The data quality process is divided into five steps: discovering what data you need, profiling, rules (cleansing, correcting, and so on), monitoring the filling data elements in your source systems, and, finally, the amazing part where we see that you can actually measure your data quality. We concluded with the last section of this crucial chapter, in which we discussed IT. Remember—if your data foundation and data quality aren’t correct, your reports will never be!
In the following chapter, we will discuss organizational goals and how important it is to design, measure, and display them in such a way that an organization can track its strategic objectives.