12
OpenShift Multi-Cluster Security
In Chapter 8, OpenShift Security, we discussed some important aspects you may consider for defining and implementing security policies for your OpenShift cluster. We went through aspects such as authentication and authorization, certifications and encryption, container and network isolation, and others. If you haven't gone through that chapter yet, we encourage you to take a look now before reading this one.
Implementing security policies on OpenShift is important, but not really complicated in general – most policies’ configuration is straightforward and well documented. Things become more complicated when you scale your infrastructure to several clusters though. How can you be sure that all the containers that run on top of several clusters are using secure and certified base images? Do you know how compliant all your environments are according to industry and regulatory standards such as PCI and HIPAA? To help you to monitor and maximize your OpenShift and Kubernetes clusters’ security, we will introduce in this chapter Red Hat Advanced Cluster Security (ACS).
Therefore, you will find the following topics covered in this chapter:
- What is Red Hat Advanced Cluster Security?
- Red Hat Advanced Cluster Security installation
- Adding secured clusters
- Policies and violations
- Vulnerability management
- Risk profiling
- Configuration management
- Network segmentation
Let’s dive into it now!
What is Red Hat Advanced Cluster Security?
Red Hat Advanced Cluster Security, also known as StackRox, is a Kubernetes-native security tool that provides the following features:
- Policies and violations: Defines security policies and has a report of all violation events in real time. You can define your own policies and/or use dozens of policies that come out of the box.
- Vulnerability management: Detects known vulnerabilities in your clusters to give you the weapons you need to remediate and prevent security issues.
- Risk profiling: Assesses the risk of your environment and classifies applications according to their security risk.
- Compliance: Reports the compliance of your clusters according to some industry-standard security profiles.
- Configuration management: Helps you to make sure your deployments follow the security best practices.
- Network segmentation: Views the network traffic between different namespaces and allows you to create Network Policies to restrict and isolate traffic.
Recent research conducted by KuppingerCole recognized Red Hat Advanced Cluster Security as the overall leader in the Kubernetes security segment. It is indeed a great product that is included with the Red Hat OpenShift Plus offering, which we will discuss in more detail in the next chapter. In the Further reading section of this chapter, you can find a link to KuppingerCole’s research.
We encourage you to experiment with ACS if you have an active OpenShift Plus subscription or reach out to Red Hat’s account team that covers your company for more information about it.
Red Hat Advanced Cluster Security installation
The installation process of ACS is similar to what you have seen in the last chapter with ACM: through an Operator. However, you can also install it using Helm charts or the roxctl CLI. In this book, we will use the Operator installation; if you want more information about the Helm or roxctl installation process, refer to the official documentation. You can find links to the official documentation in the Further reading section of this chapter.
To install ACS using the operator, proceed as follows.
Prerequisites
Operator installation
Follow the next steps to get the ACS operator ready for use:.
- Access the OpenShift Web Console using the Administrator’s perspective.
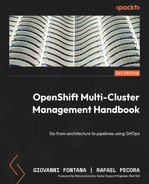
- Navigate to the Operators | OperatorHub menu item.
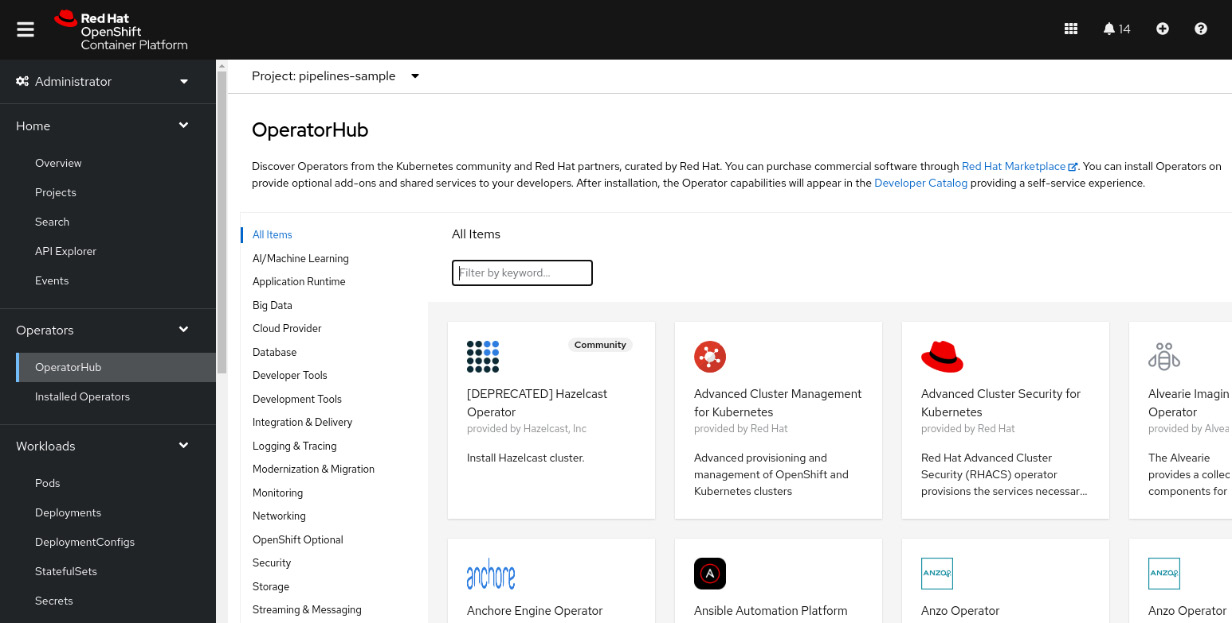
Figure 12.1 – OperatorHub
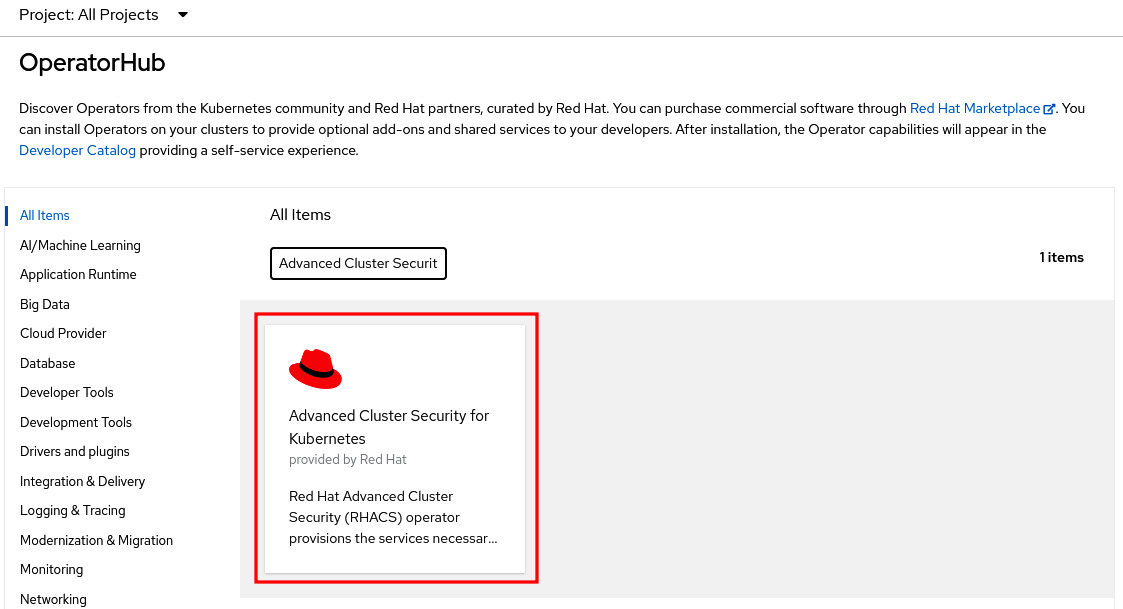
Figure 12.2 – Advanced Cluster Security for Kubernetes on OperatorHub
- Click on the Advanced Cluster Security for Kubernetes tile and on the Install button to see the Install Operator screen.
Figure 12.3 – Installing Advanced Cluster Security for Kubernetes
- Don’t change the default namespace (rhacs-operator).
- Select Automatic or Manual for the upgrades Approval Strategy. If you select Automatic, upgrades will be performed automatically by the Operator Lifecycle Manager (OLM) as soon as they are released by Red Hat, while in Manual, you need to approve upgrades before being applied.
- Select the proper Update channel. The latest channel is recommended as it contains the latest stable and supported version of the operator.
- Click the Install button.
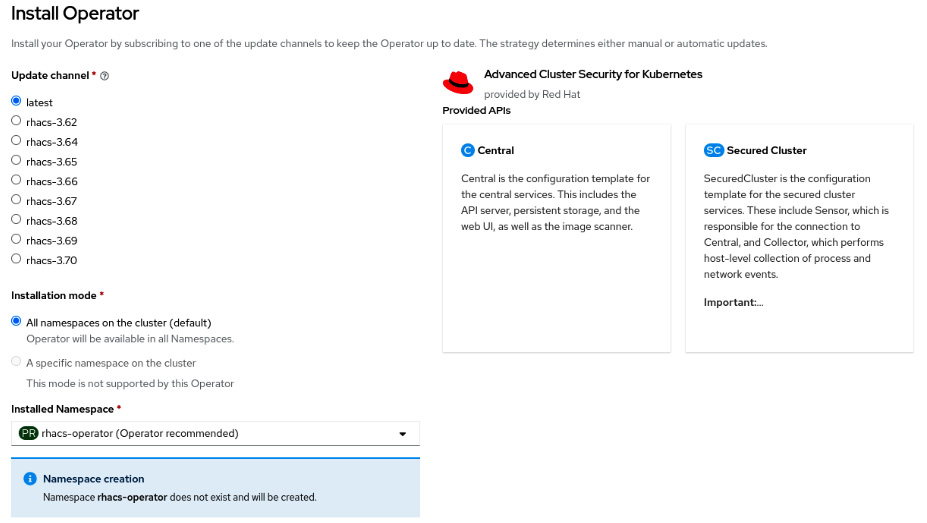
Figure 12.4 – Installing the operator
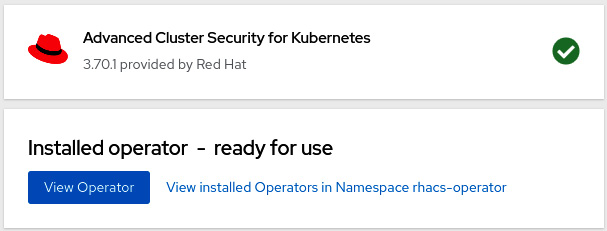
Figure 12.5 – Operator installed
Now that we have the operator installed, the next step is to deploy the ACS Central custom resource. See next how to do it.
ACS Central installation
We can now go ahead and deploy a new ACS Central instance:
- Click on the View Operator button or navigate to the Operators | Installed Operators menu and click on Advanced Cluster Security for Kubernetes.
- Access the Central tab and click on the Create Central button.
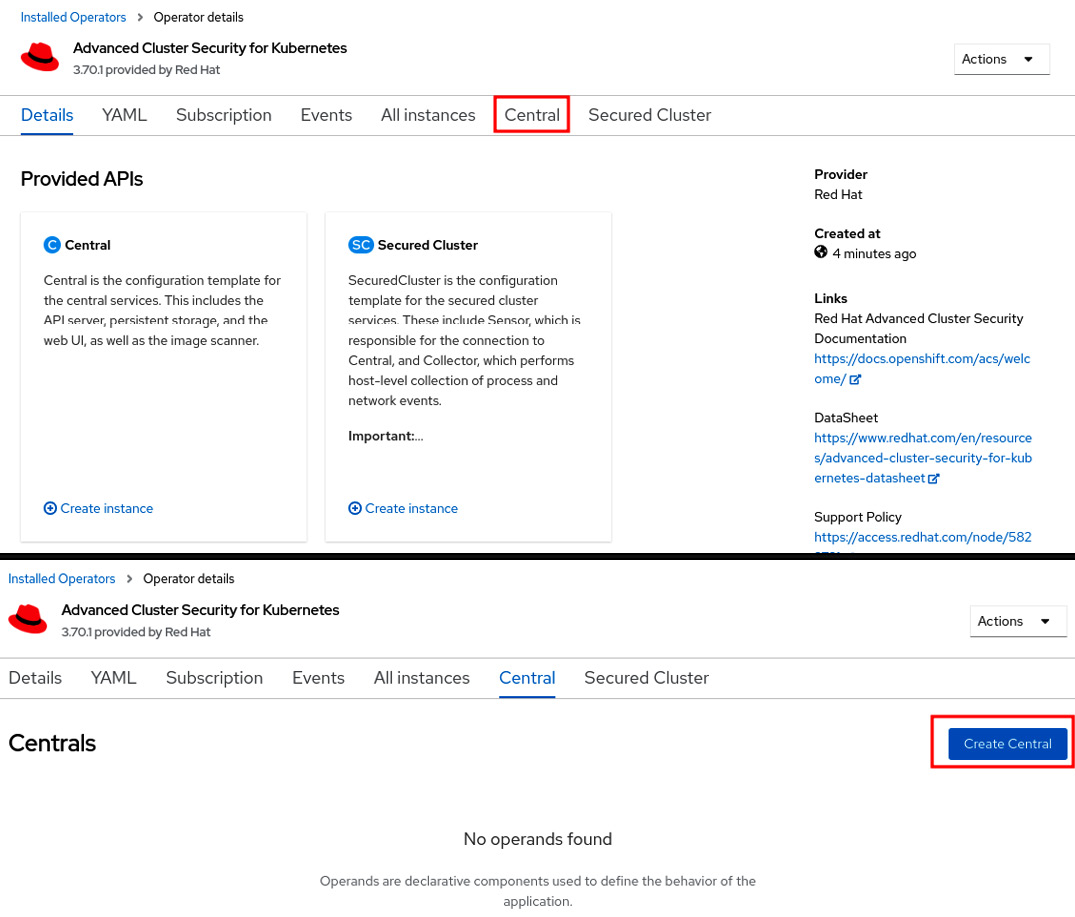
Figure 12.6 – Creating a new ACS Central instance
- Usually, no changes are needed, so leave the default values and click on the Create button. Check out the link in the Further reading section of this chapter for product documentation for more information if you need to configure some advanced settings.
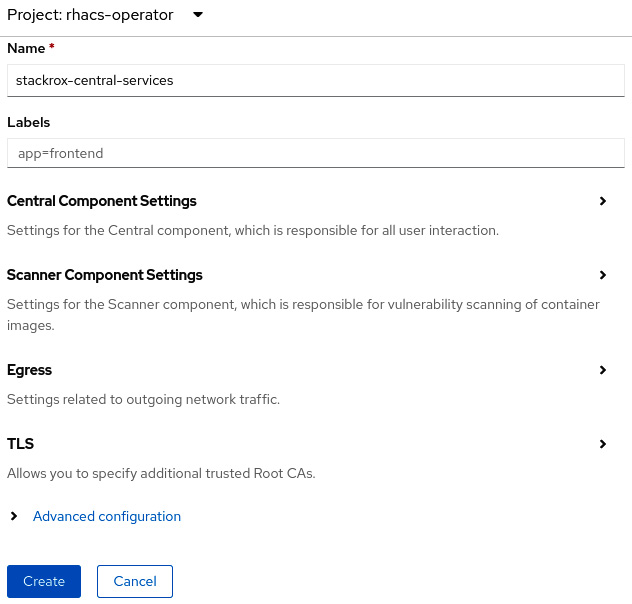
Figure 12.7 – Create ACS Central
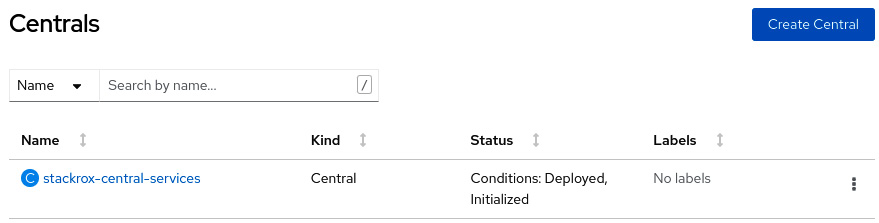
Figure 12.8 – ACS Central installed
- To access the recently created ACS Central portal, you need to first get the admin credentials. To do so, navigate to Workloads | Secrets in the rhacs-operator project and click on the central-htpasswd secret.
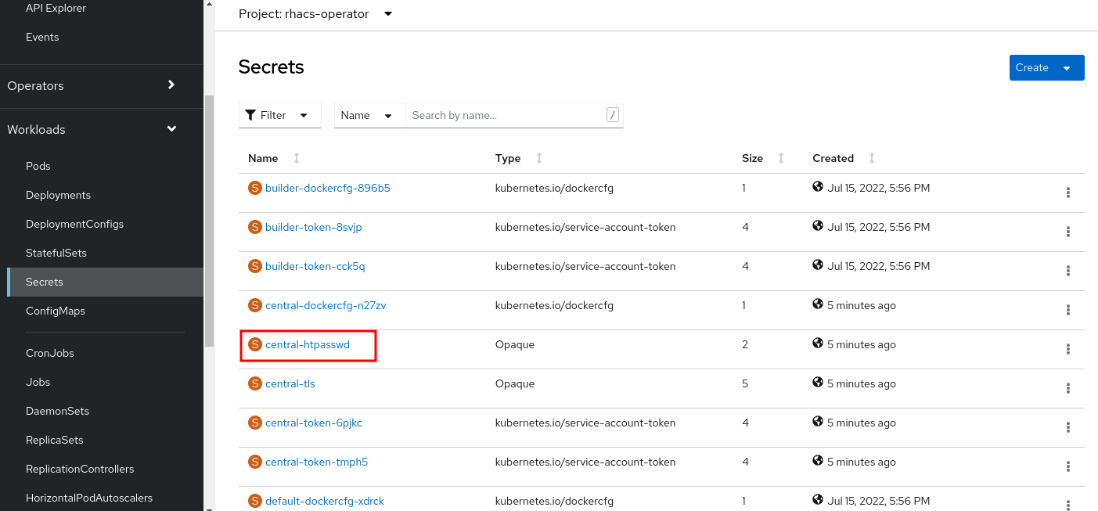
Figure 12.9 – Admin credentials secret
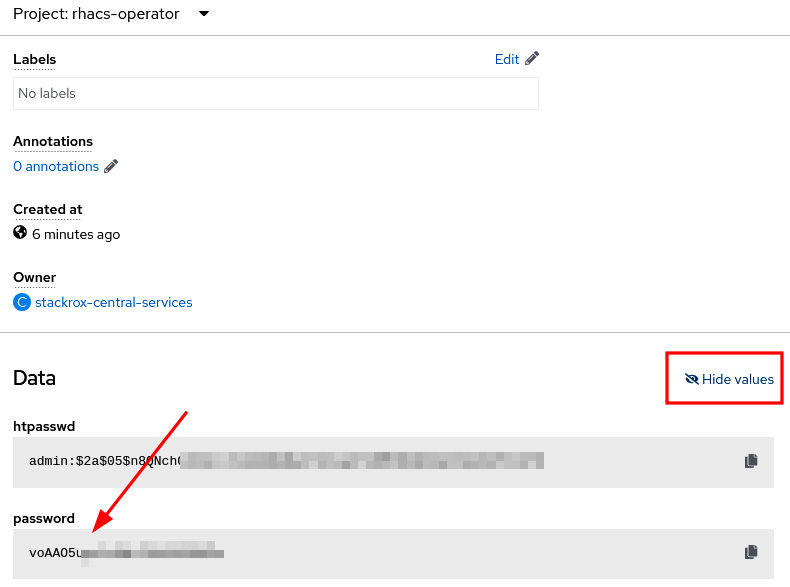
Figure 12.10 – Copy the admin password
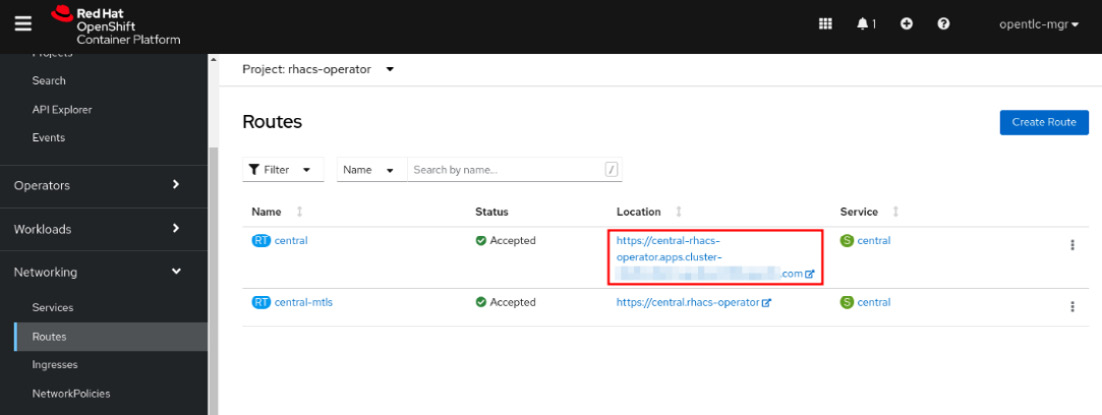
Figure 12.11 – ACS Central URL
- Use the admin username and the password you copied from the secret.
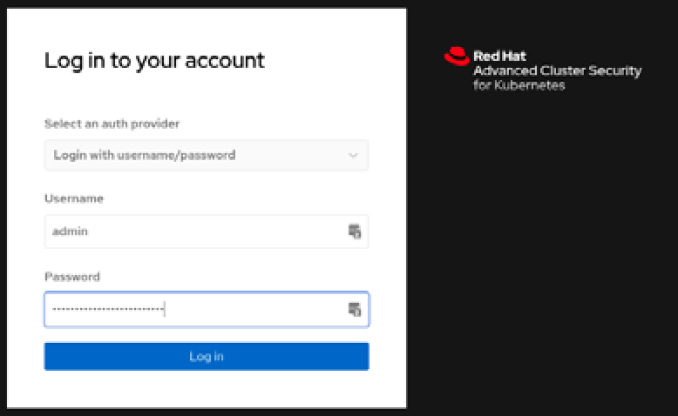
Figure 12.12 – Red Hat ACS login page
You now have Red Hat Advanced Cluster Security installed. You will notice though that we don’t have any clusters under ACS management. We will add a managed cluster (also known as secured cluster) in the next steps.
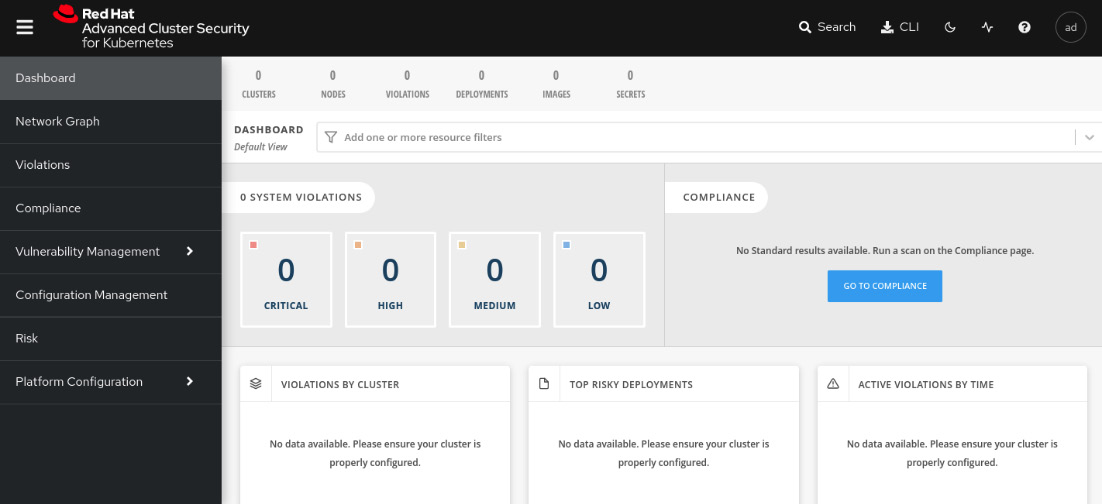
Figure 12.13 – Red Hat ACS initial page
Continue reading to see how to add secured clusters on ACS.
Adding secured clusters
Secured cluster is the term used to refer to a cluster under ACS management. ACS Central works as a control plane where you will create the policies and visualize violations, compliance, and all the features that we will walk through later in this chapter; while an ACS secured cluster is a set of ACS processes (AdmissionControl, Scanner, Sensor, and Collector) that run on managed clusters to monitor and enforce policies.
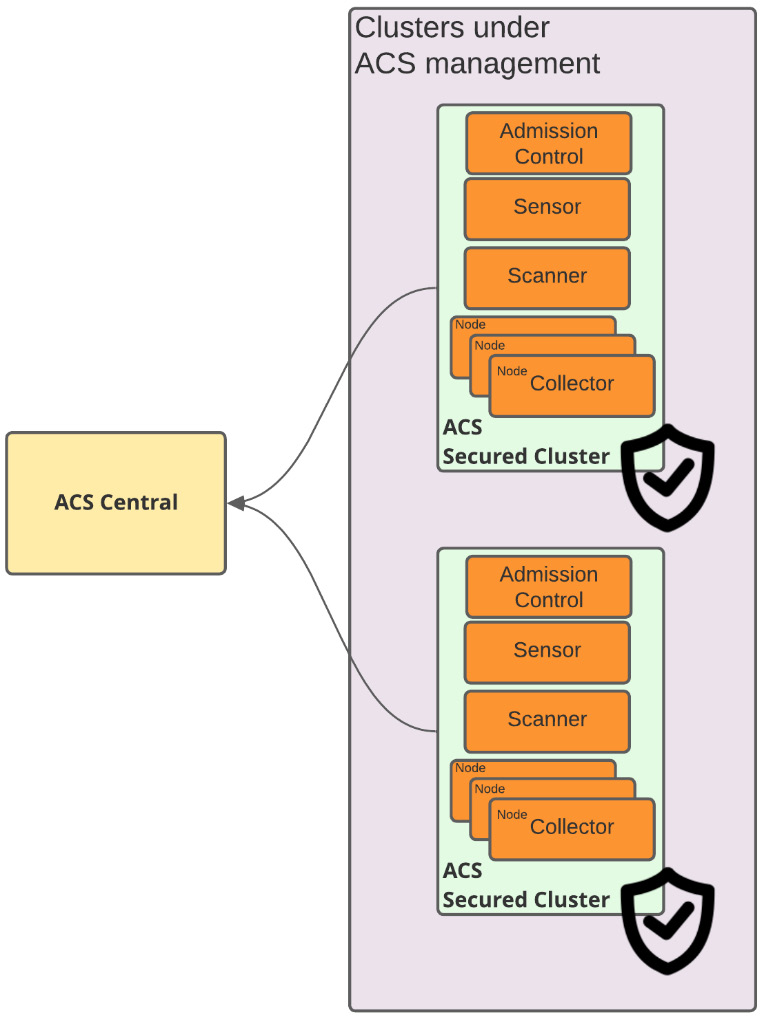
Figure 12.14 – ACS Central/secured cluster
The process of adding secured clusters on ACS Central comprises the following steps:
- Generate an init bundle on ACS Central.
- Run the init bundle.
- Create a SecuredCluster custom resource in the ACS operator.
To perform the previous steps and add a secured cluster, run the following steps in ACS Central:
- Access the Platform Configuration | Integrations menu:
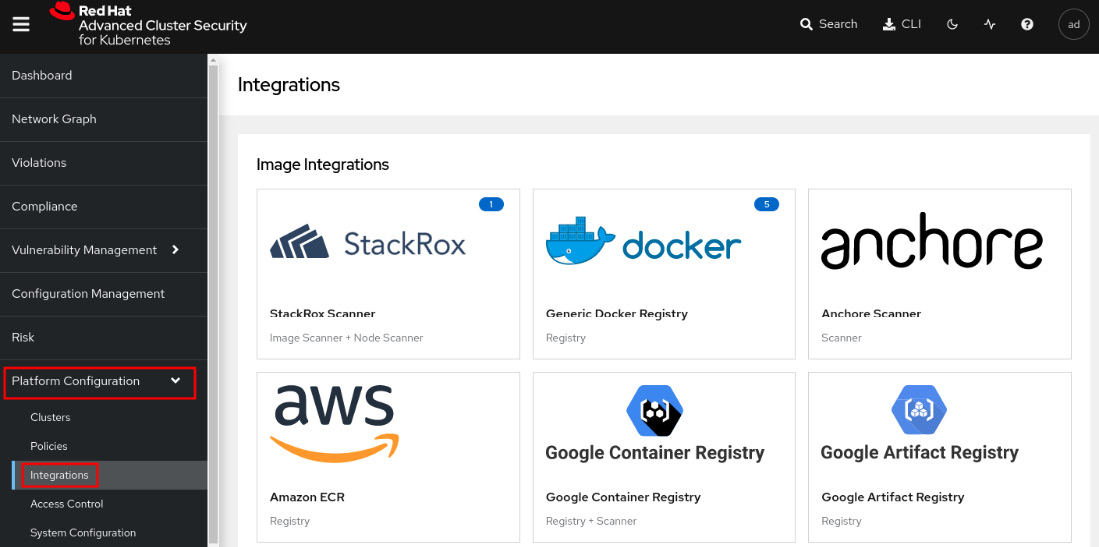
Figure 12.15 – Generating an init bundle
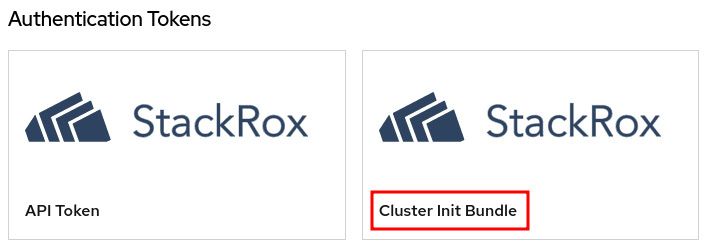
Figure 12.16 – Generating an init bundle
- Click on Generate bundle, give it a name, and click on the Download Kubernetes secrets file button:
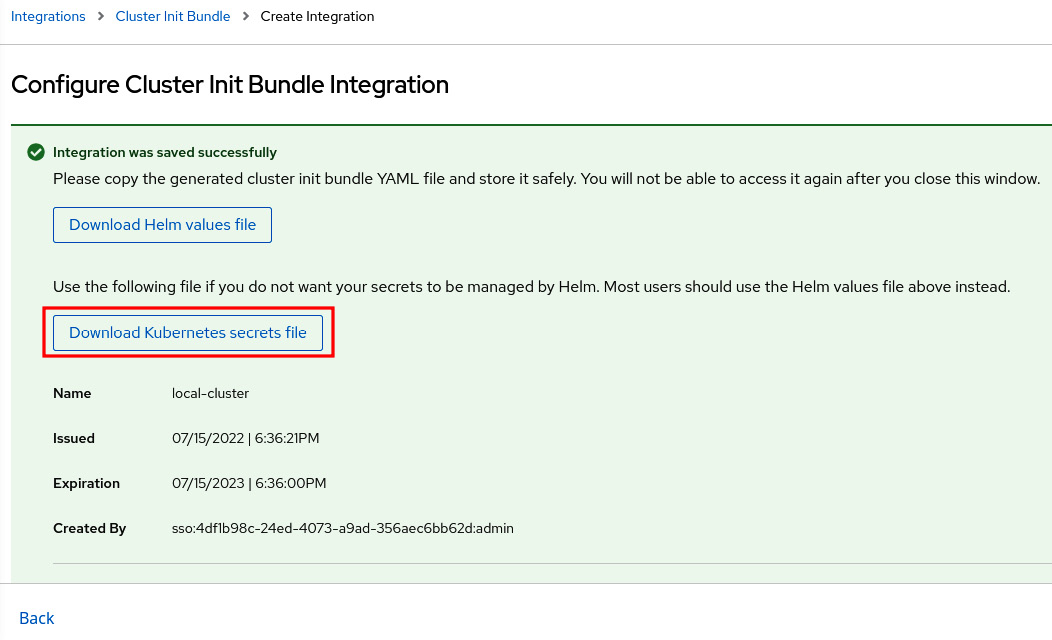
Figure 12.17 – Generating the init bundle
Now, access the OpenShift cluster that you want to add as a secured cluster (not ACS Central).
- Using a terminal with the oc CLI, run the following command. Note that you need to run this command in the secured cluster and not on ACS Central:
$ oc create namespace rhacs-operator
$ oc create –f <cluster-init-secrets>.yaml -n rhacs-operator
secret/collector-tls created
secret/sensor-tls created
secret/admission-control-tls created
- Install the ACS operator in the secured cluster following the same steps we performed in the Operator installation section of this chapter. Note that this time, we are installing the operator in the secured cluster.
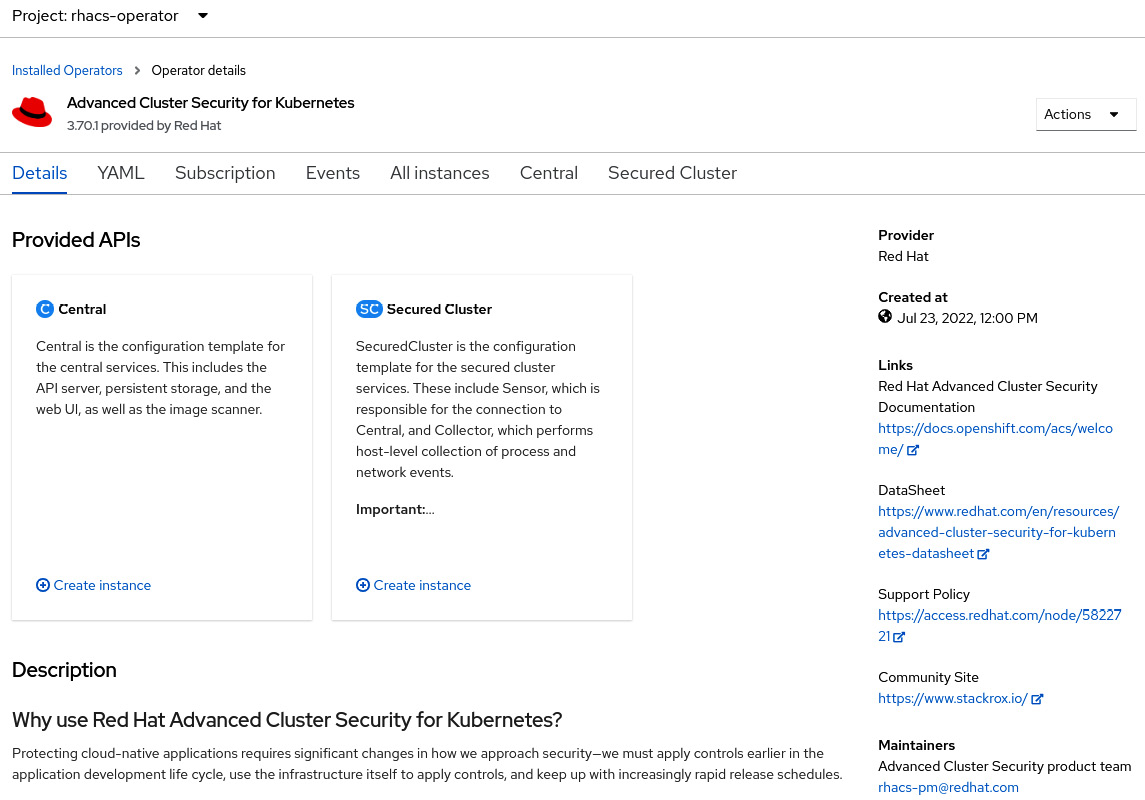
Figure 12.18 – ACS Operator installed in the ACS secured cluster
- Still in the OpenShift secured cluster, navigate to Operators | Installed Operators and click on Advanced Cluster Security for Kubernetes. On this page, access the Secured Cluster tab:
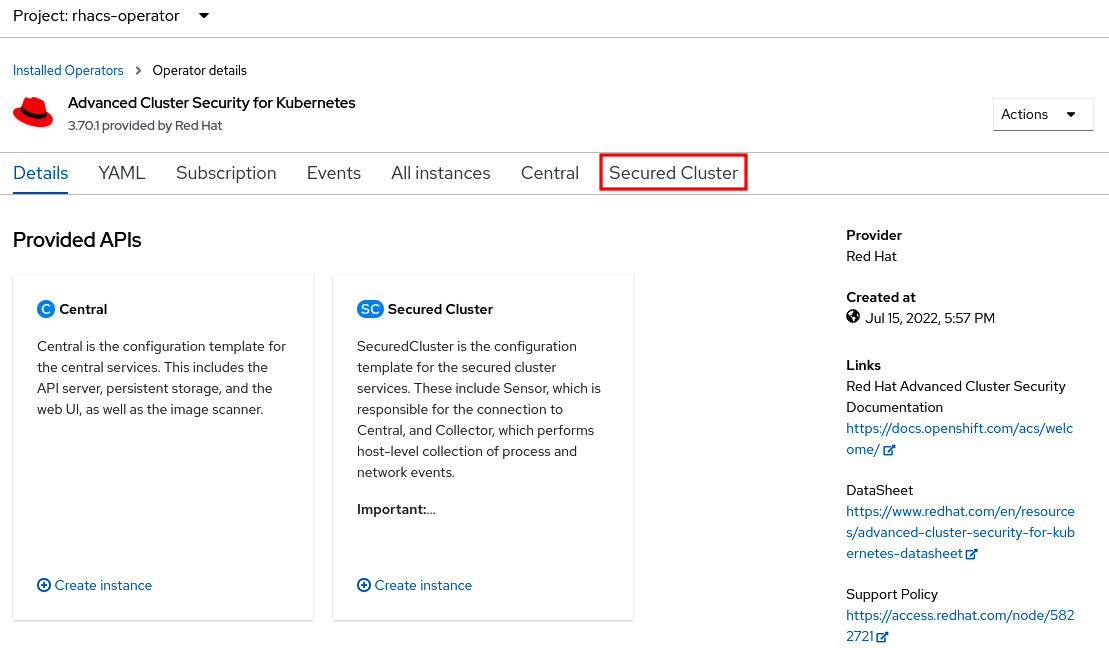
Figure 12.19 – Creating a new secured cluster
- Click on the Create SecuredCluster button. On this page, give the cluster a name, add the ACS Central URL, and click on the Create button:
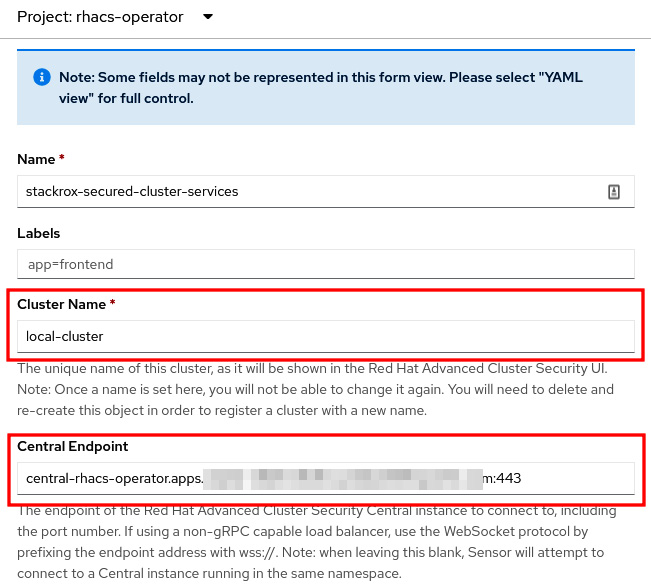
Figure 12.20 – Adding a secured cluster
Important Note
Always add the port (:443) in Central Endpoint. The secured cluster sensor and scanner may fail if you don’t specify the port.
- Wait up to 10 minutes for ACS Collector, Sensor, and AdmissionControl to spin up in the managed cluster. To check the status of the ACS managed cluster, access ACS Central and navigate to Platform Configuration | Clusters. The cluster should be marked in green as Healthy:
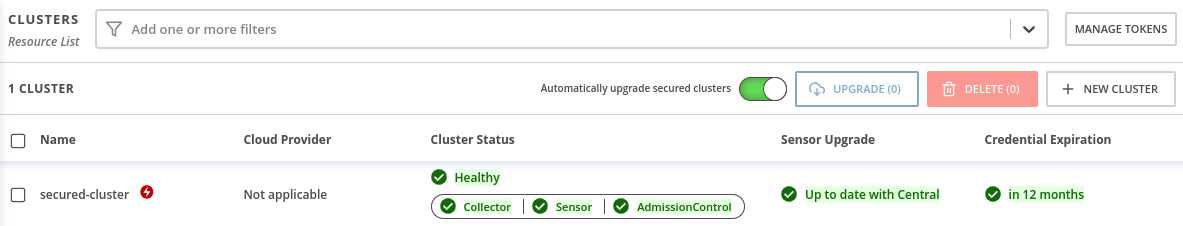
Figure 12.21 – Secured cluster health
Note
It is normal to see Cluster Status as Degraded during the secured cluster deployment. Wait up to 10 minutes for it to be Healthy. Refresh your browser to check the latest status.
We now have what we need to start using ACS: ACS Central monitoring one secured cluster. Continue to the next section to find out more about the ACS policies and violation features.
Policies and violations
ACS comes with dozens of security policies defined out of the box that you can just start using and also allows you to define custom security policies for your Kubernetes clusters. You can also easily check what policies are violated using the Violations feature.
In this section, we will see how to view and create policies and also walk through the Violations feature.
Security policies
To access the security policies, navigate to Platform Configuration | Policies. All out-of-the-box policies will be listed in this view:
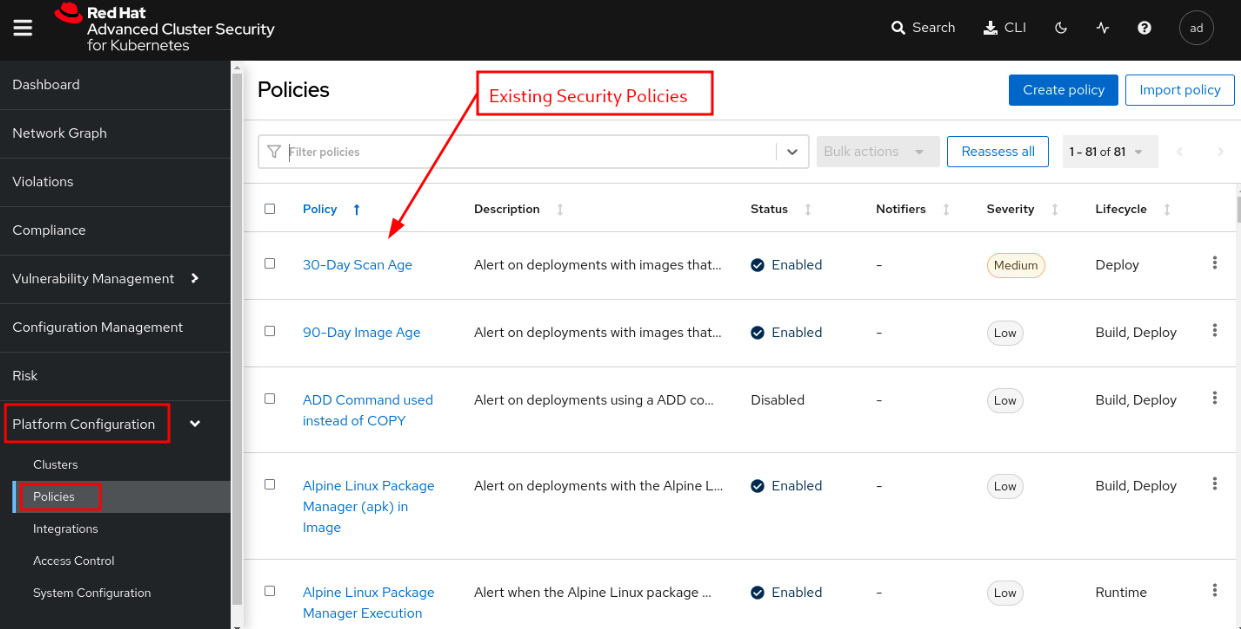
Figure 12.22 – Security policies
Let’s use a simple policy to learn how a security policy works on ACS. In the Filter policies box, type Policy and hit Enter; then type admin secret and hit Enter again to find the OpenShift: Advanced Cluster Security Central Admin Secret Accessed policy:
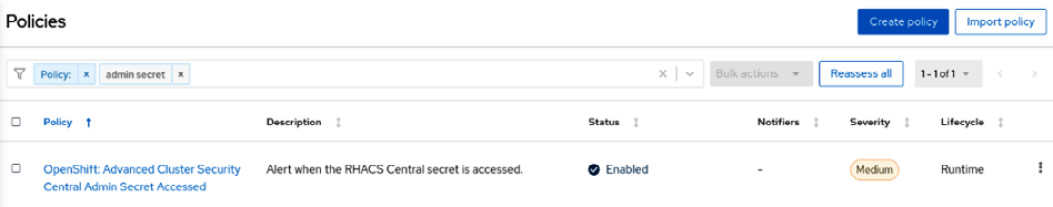
Figure 12.23 – Latest tag policy
Now click on the link to see the Policy details page:
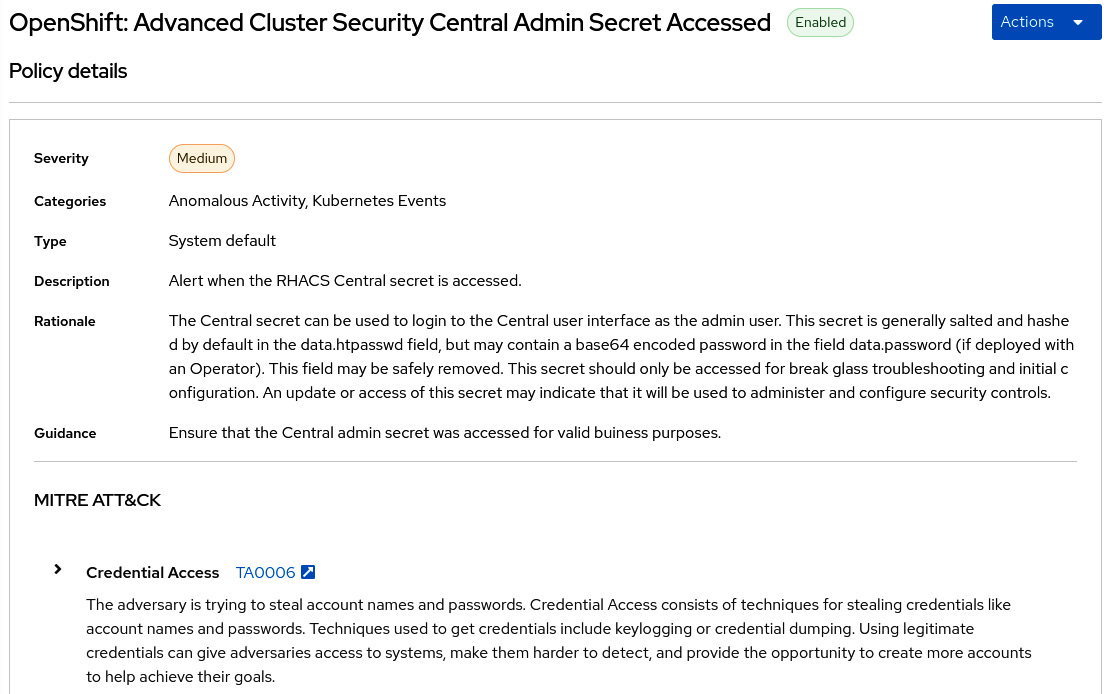
Figure 12.24 – Policy details
On this page, you will find policy details, such as Description, Type, and so on. Let’s go ahead and click on Actions | Edit policy to take a look at what we can set up as part of a policy.
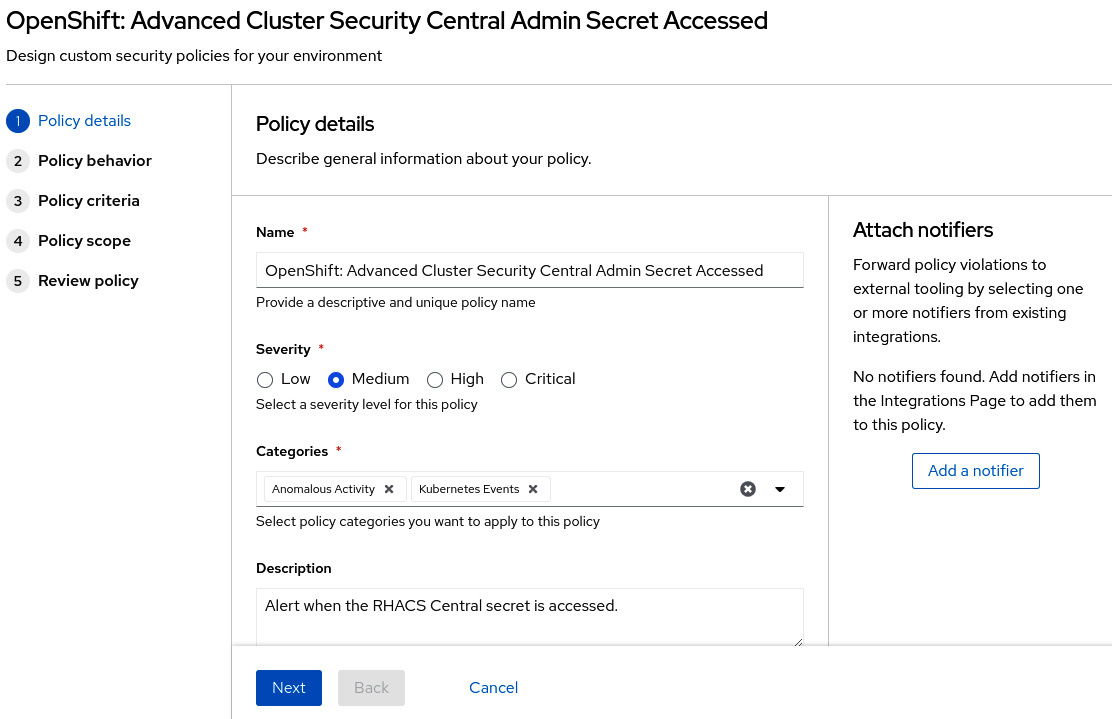
Figure 12.25 – Editing policy details
The first screen we see is Policy details. On this page, you can change general policy information, such as Name, the Severity level, Categories, and Description.
MITRE ATT&CK
MITRE ATT&CK® is a knowledge base of tactics and techniques that are used often in cyberattacks on Kubernetes. First published by Microsoft in April 2020, it is a great source of security best practices for Kubernetes. ACS allows you to classify security policies according to the MITRE ATT&CK® matrix. If you want to learn more about this framework, check the links in the Further reading section at the end of this chapter.
The next screen is Policy behavior, which defines how the policy should be applied:
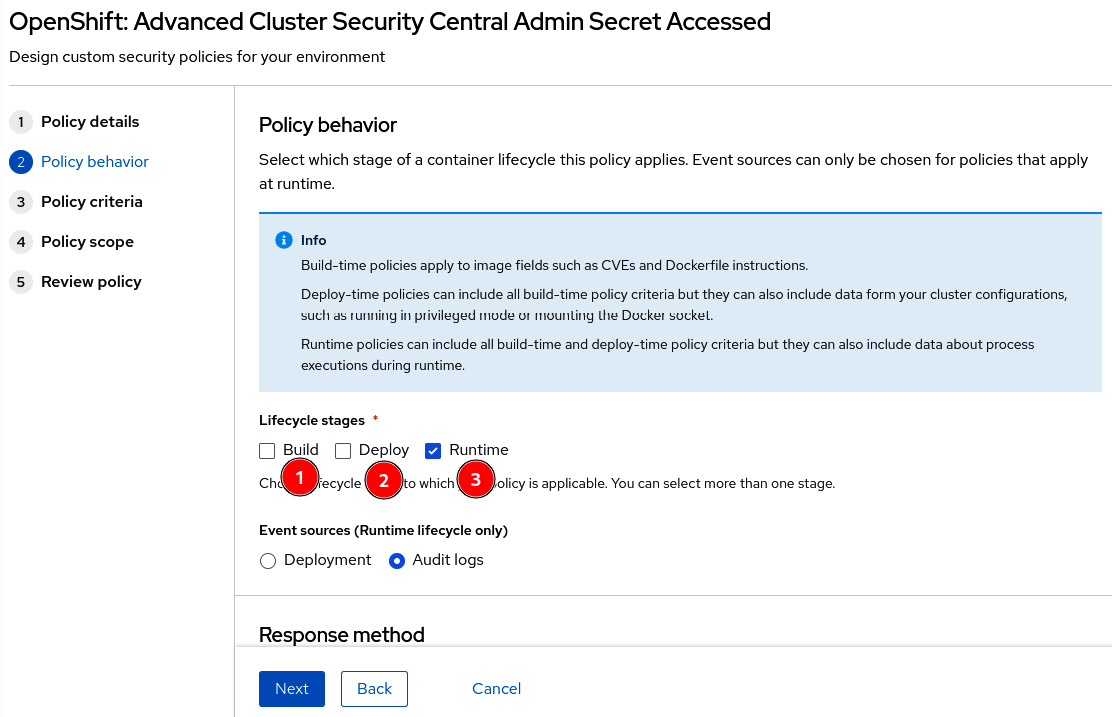
Figure 12.26 – Policy behavior
The life cycle stages define to which stage the policy applies:
- Build: Policy applied during the build of a container image. Used in general as part of a CI pipeline for static analysis of YAML Kubernetes manifests or Dockerfile instructions.
- Deploy: Policies in this stage will be fired during the application deployment and will inform or even block the deployment if it violates the policy, depending on what you configured in Response method.
- Runtime: Policy applied during runtime. For runtime policies, you can define whether Event source will be from Deployment or Audit logs. With the Deployment event source, you can inform and block application deployments that violate the policy, while Audit logs is used to monitor Kubernetes API calls against Secrets and ConfigMaps, to search for suspicious activities, such as sensitive passwords being read – this is exactly what is done by the policy we are using in this example.
You also can set up Response method for one of the following:
- Inform: Only inform the violation by adding it as an item in the Violations feature.
- Inform and enforce: Besides adding it to the violation list, it also enforces the following behavior, depending on the stage selected under Lifecycle stages:
- Fails CI builds if the Build stage is selected.
- Blocks an application deployment that violates the policy if the Deploy phase is selected.
- Kills pods that violate the policy if the Runtime stage is selected.
The next step describes the policy criteria that will define the policy:
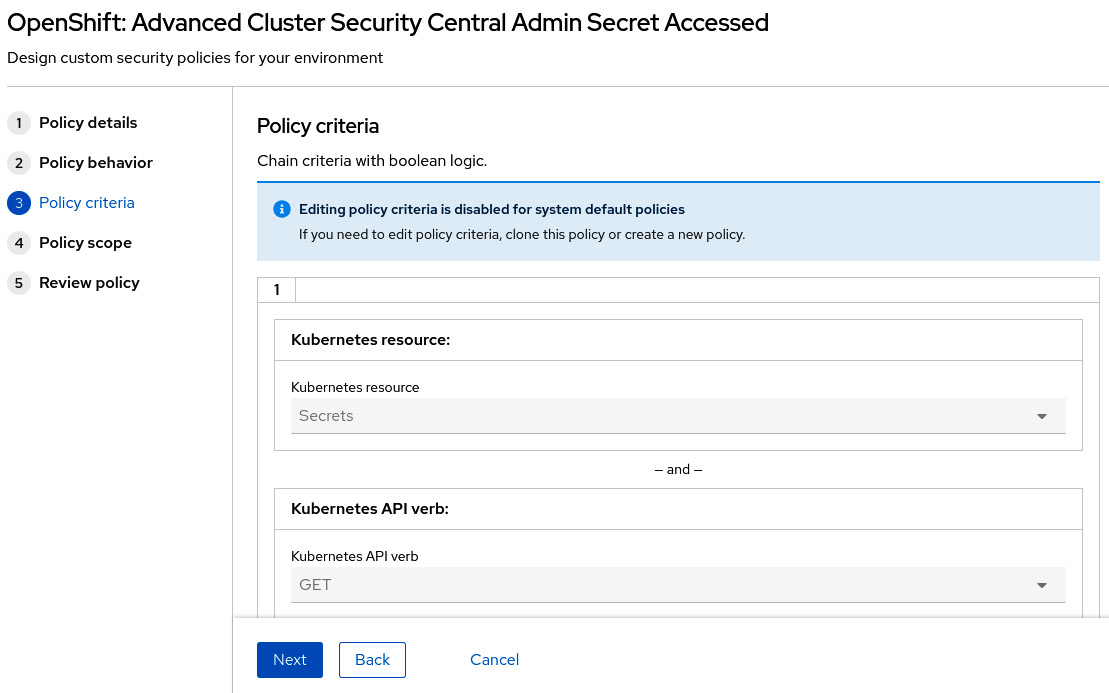
Figure 12.27 – Editing policy criteria
Policy criteria differ according to the event source. When the event source is Deployment, then you can create Boolean logic based on a large set of entities related to the image, container configuration, metadata, storage, network, container runtime processes, and Kubernetes events. We encourage you to access different policies to check the different types of policy criteria available from existing policies.
When the event source is Audit logs, the criteria are defined in terms of Kubernetes API events. Let’s check the policy that we are using as an example to learn how audit logs-based policy criteria work. In our example, the following criteria are used:
- Kubernetes resource: Secrets
- Kubernetes API verb: GET, PATCH, or UPDATE
- Kubernetes resource name: central-htpasswd
- Kubernetes user name is NOT: system:serviceaccount:openshift-authentication-operator:rhacs-operator-controller-manager
This means that a violation will be raised when the central-htpasswd secret is either read (GET) or changed (PATCH or UPDATE) by any user other than the rhacs-operator-controller-manager service account.
You can also set the policy scope if you want:
- Restrict the policy to only specific clusters, namespaces, or labels.
- Alternatively, exclude entities from the policy.
- Exclude images to be checked during the Build stage:
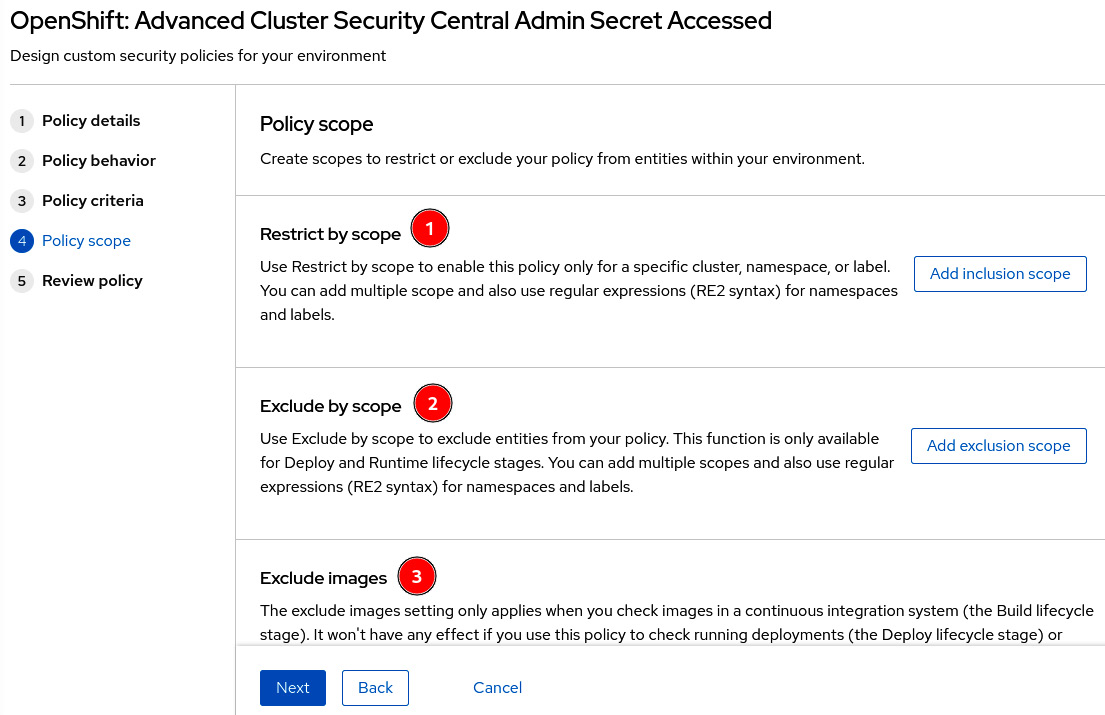
Figure 12.28 – Exclude or restrict entities and images from policy
This concludes the configurations you will find in a policy. It is not that difficult, right? We encourage you to create some custom policies to practice and learn from them.
Violations
The Violations feature lists all security policies that have been violated in the clusters monitored by ACS:
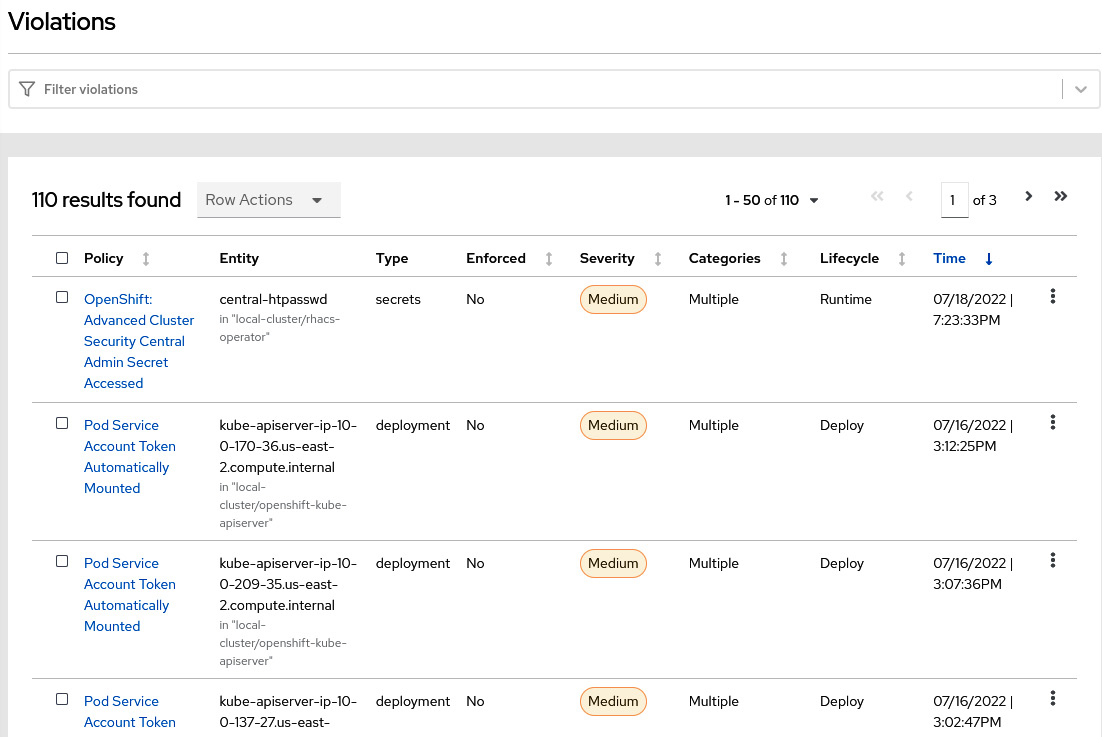
Figure 12.29 – Violations list
Remember that we read central-htpasswd in step 15 of the ACS Central installation section to get the ACS Central admin password. That raised a violation due to the policy we used as an example previously (GET API of central-htpasswd secret). Click on some of the violations you see on this page to explore the feature and learn about the events and data that are captured and shown by the ACS Violations feature:
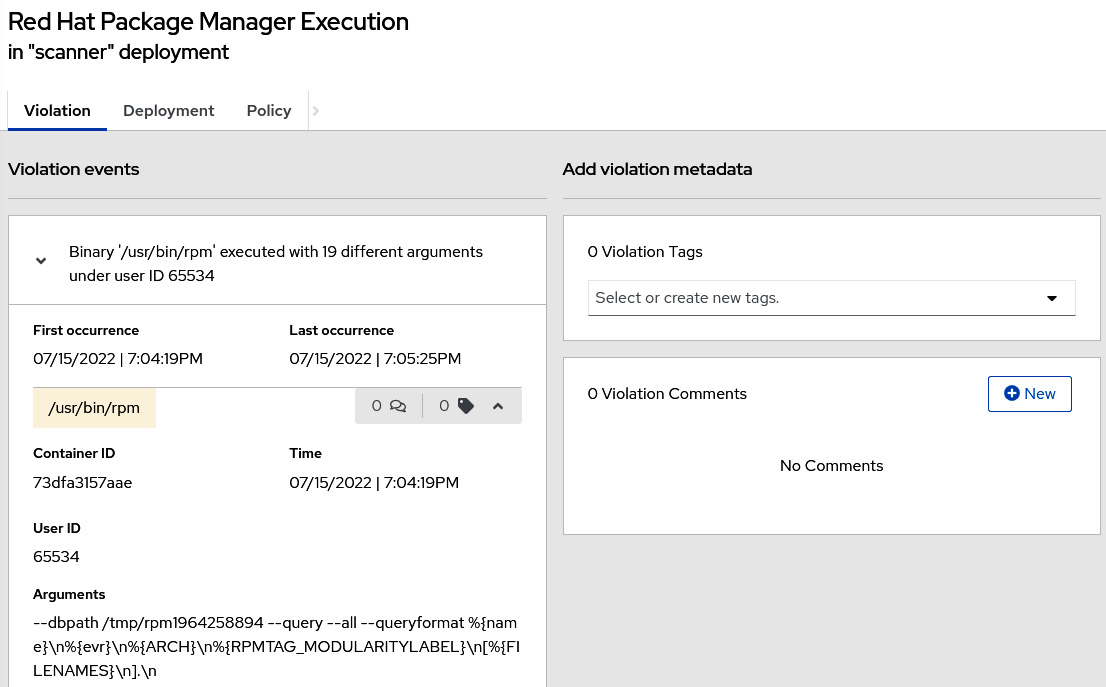
Figure 12.30 – Example of a violation
In this section, we have learned how a security policy is defined on ACM and how to easily see a list of the violations that occur in your clusters. Continue reading to learn more about the Vulnerability Management feature of ACS and how you can use it to identify, prioritize and remediate vulnerabilities.
Vulnerability management
There is a general consensus that any system has vulnerabilities; some of them are known and some are not identified yet. Vulnerability management is the process of identifying and managing known vulnerabilities, which means having plans in place to remediate or mitigate the impact of the vulnerabilities. Navigate to Vulnerability Management | Dashboard to see what this feature looks like:
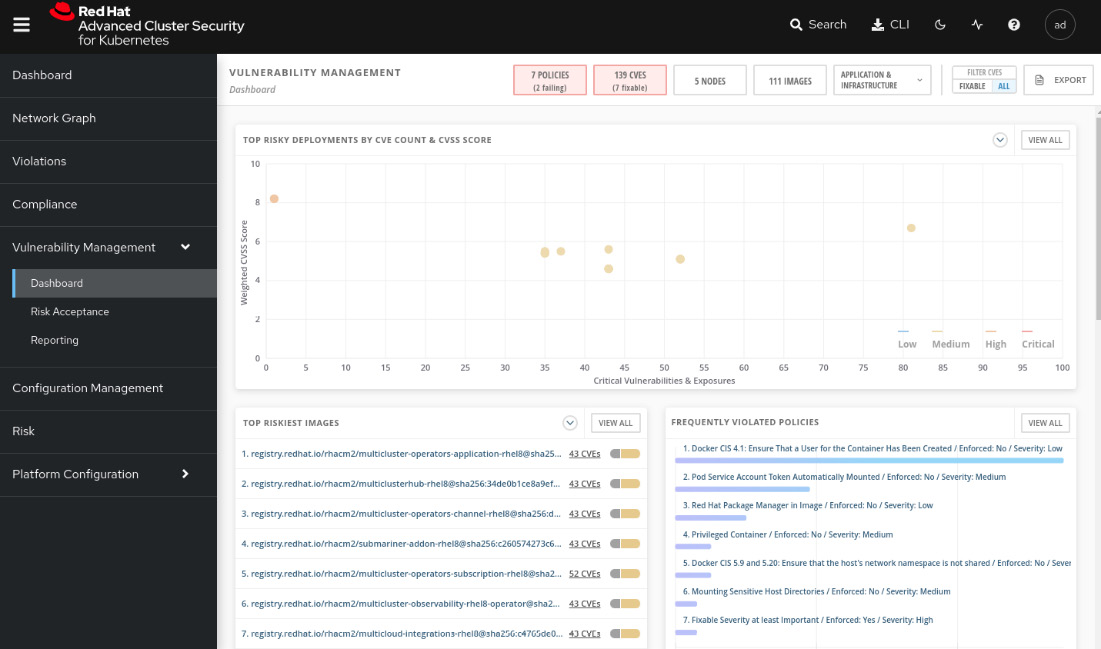
Figure 12.31 – Vulnerability management
Through this feature, you can walk through all the vulnerabilities detected by ACS and decide what actions to take:
- Remediate the vulnerability either by removing the vulnerable software package from the application or updating it with a more recent version in which the vulnerability is already fixed.
- Accept the risk.
- Mark it as a false positive.
Vulnerabilities are detected and grouped in terms of the following:
- Components: Software packages used by containers. This group helps you to detect the software packages that contain more vulnerabilities and where they are used, so you can upgrade the applications accordingly to remediate them.
- Image: Group the vulnerabilities by images. Similarly, you can view what images are more vulnerable, check whether there is a fix for the security issues, and plan accordingly.
- Nodes: Group the vulnerabilities by nodes.
- Deployment: See the vulnerabilities by deployment. Easier to check vulnerabilities for specific applications.
- Namespace: Vulnerabilities by namespace.
- Cluster: All vulnerabilities by clusters.
These groups are accessed from the buttons at the top of the Vulnerability Management dashboard; click on them to explore the different ways you can see and filter the vulnerabilities:
Figure 12.32 – Group by entities
We are going to deploy a sample application now to check the Vulnerability Management feature in action. To do so, run the following commands in the OpenShift secured cluster:
$ oc new-project acs-test
$ oc run samba --labels=app=rce
  --image=vulnerables/cve-2017-7494 -n acs-test
$ oc run shell --labels=app=shellshock,team=test-team
  --image=vulnerables/cve-2014-6271 -n acs-test
Now, access again the Vulnerability Management dashboard. You may notice some interesting things in the dashboard now:
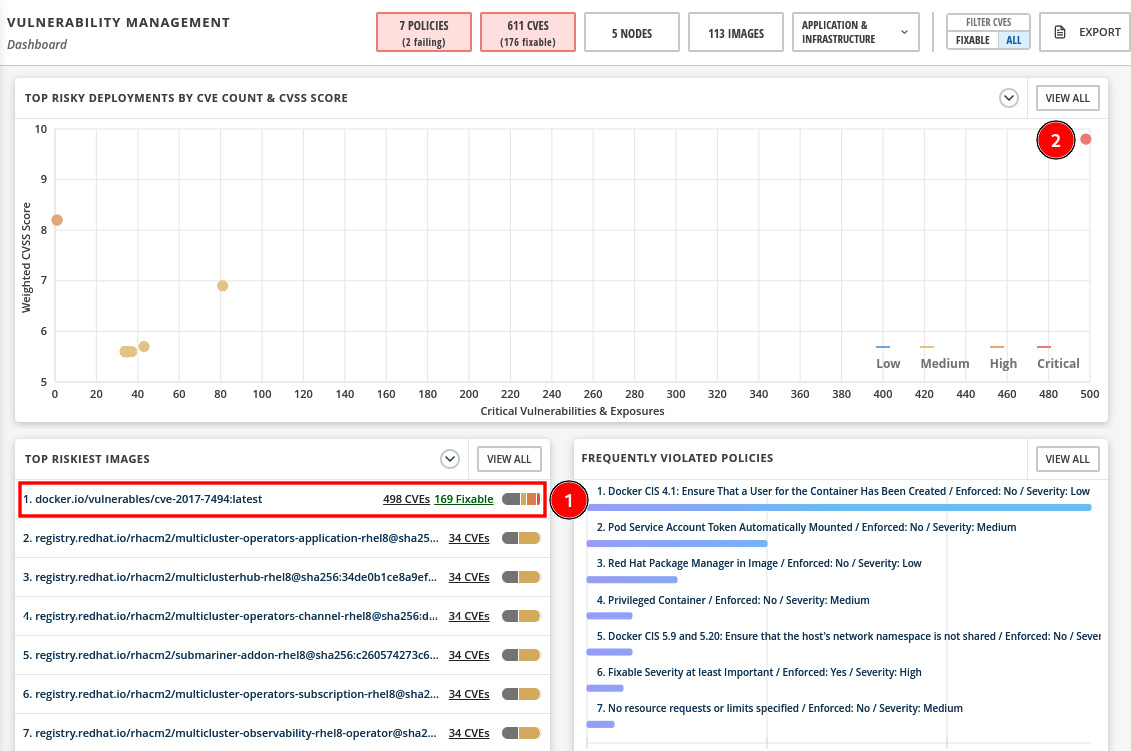
Figure 12.33 – Top riskiest images and deployments
In the previous screenshot, you can see the following:
- The container image from the application we just deployed is listed as the top riskiest image.
- In the graph, the application deployment is shown as the most critical in terms of CVE count and CVSS score.
Click on APPLICATION & INFRASTRUCTURE | Namespaces to view the vulnerabilities grouped by namespaces:
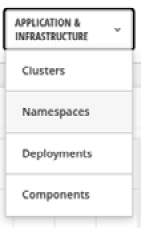
Figure 12.34 – APPLICATION & INFRASTRUCTURE menu
You will notice now our acs-test namespace is listed with more than 400 CVEs, with more than 150 fixable:
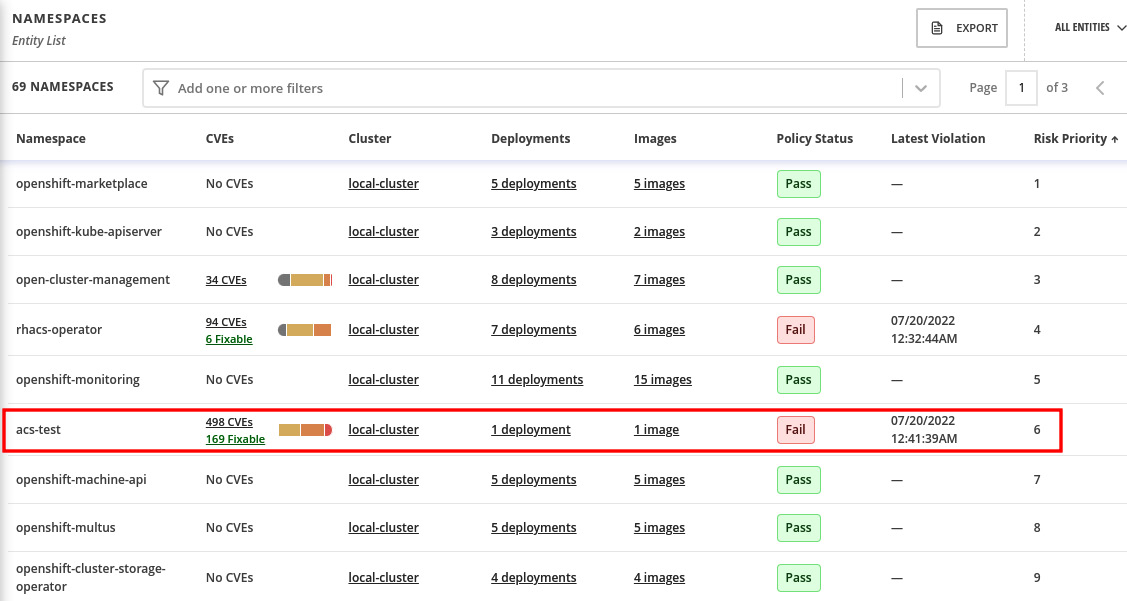
Figure 12.35 – Vulnerabilities by namespace
Click on the acs-test namespace to drill down and see the details.
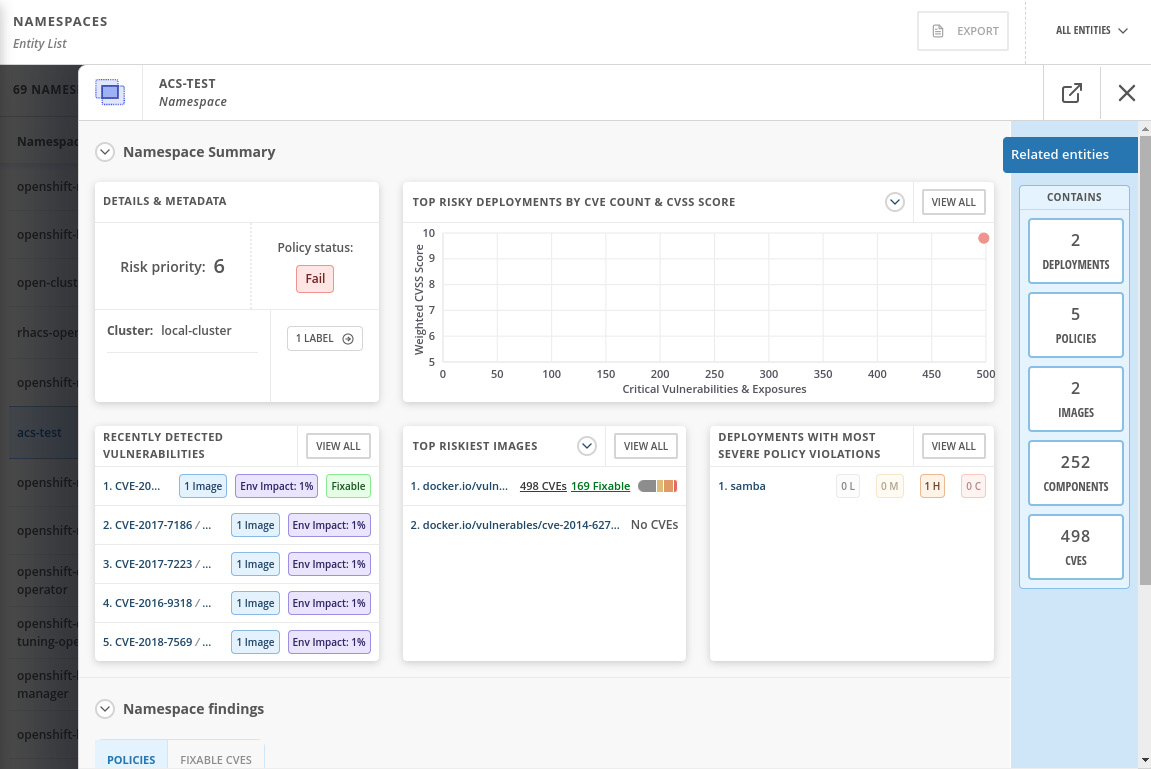
Figure 12.36 – Namespace Summary view
Explore the Related entities menu on the right side of the screen to check that you can easily find the CVEs for the samba deployment, policies that pass or fail for the namespace, a list of images and their vulnerabilities, and all components (software packages) that have CVEs, and, finally, a list of all CVEs detected in that namespace. You can learn by exploring the namespace that it contains two applications (deployments), in which one of them has 498 known CVEs, of which 169 are fixable:
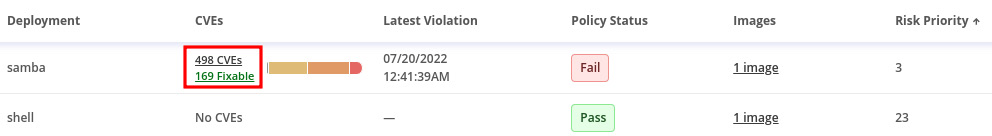
Figure 12.37 – CVEs detected
By drilling down into the deployment and components, you can check which package version is in use and in which version the CVE was fixed:
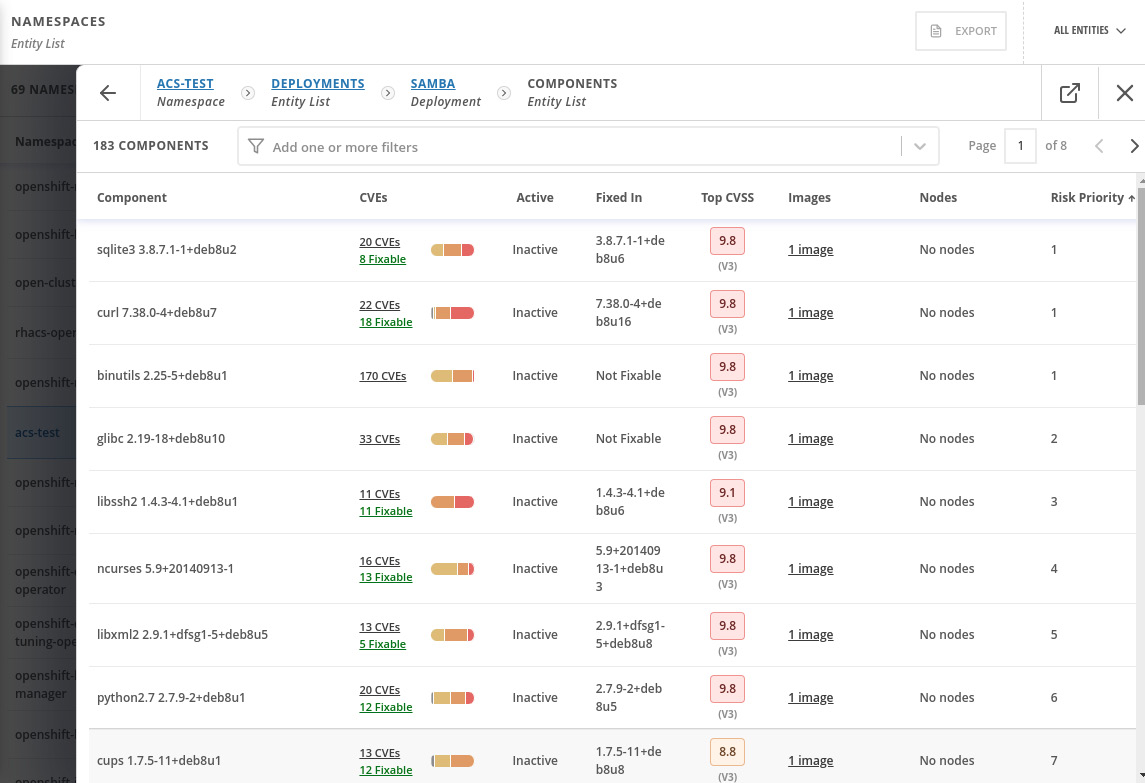
Figure 12.38 – Components and CVEs
That gives a lot of helpful information for you to identify vulnerable packages and images and remediate them. You can alternatively also decide to accept the risk (defer) or mark it as a false positive; to do so, access the image, scroll down and select the CVEs you want to defer, and click on Defer CVE or Mark false positive:
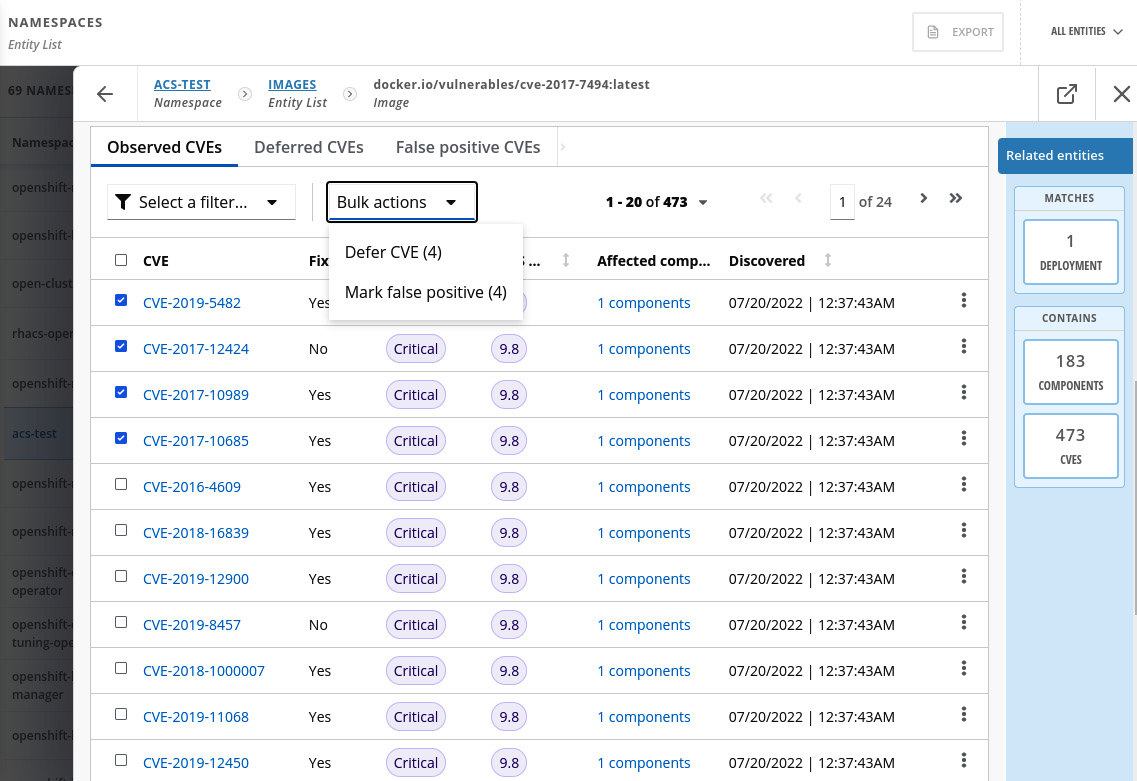
Figure 12.39 – Accepting the risk of a CVE
You can review and approve the CVEs in the Vulnerability Management | Risk Acceptance feature and also list the approved deferrals and false positives:
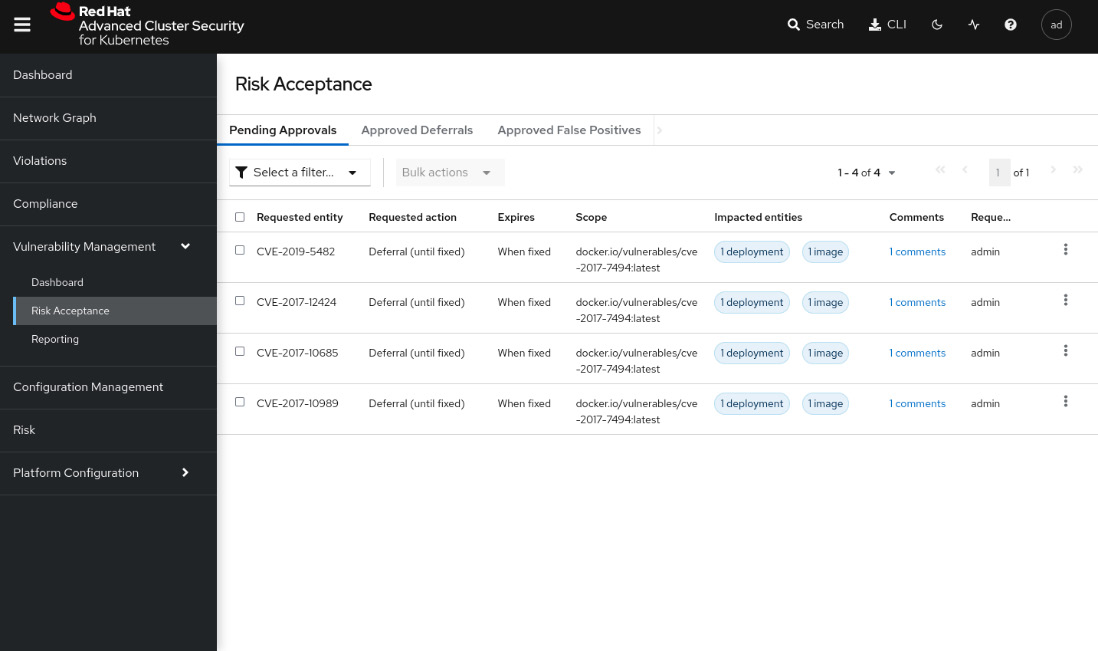
Figure 12.40 – Risk Acceptance
The Vulnerability Management feature also includes a report feature, in which you can set up a security report and send it weekly or monthly to a distribution list. It is helpful to report vulnerabilities across the organization frequently. We will not cover this feature in this book, but you can find a link in the Further reading section of this chapter that will help you to configure it.
Risk profiling
The Risk view is a feature that classifies all running deployments in terms of security risks. Navigate to the Risk menu to access the feature and learn from it:
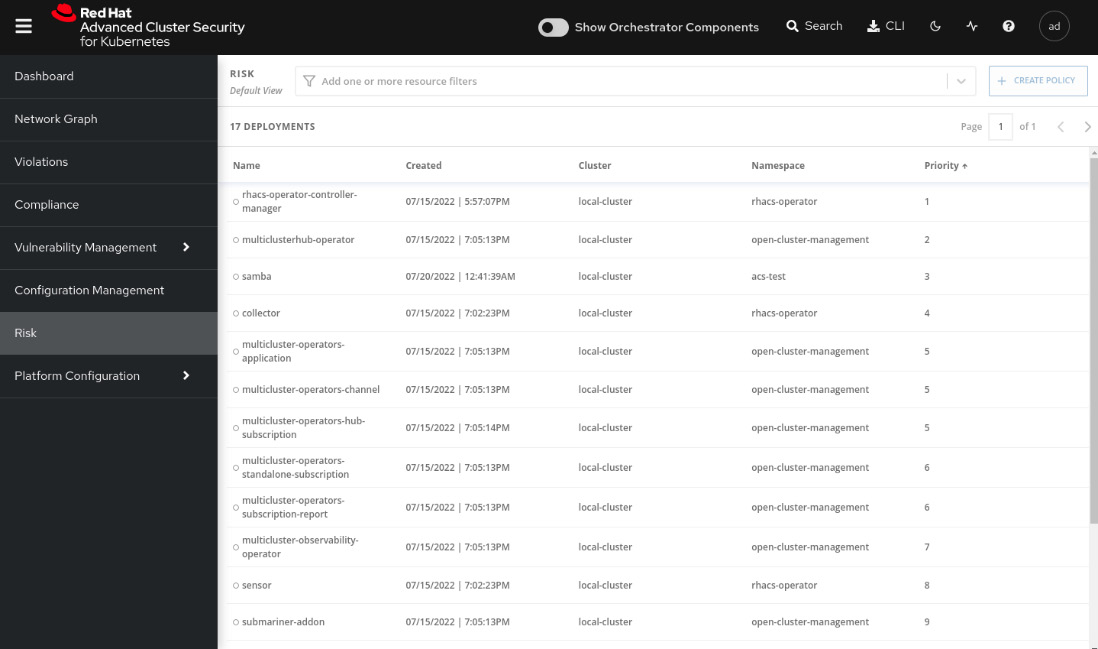
Figure 12.41 – Risk feature
Click on the samba deployment and explore RISK INDICATORS, DEPLOYMENT DETAILS, and PROCESS DISCOVERY:
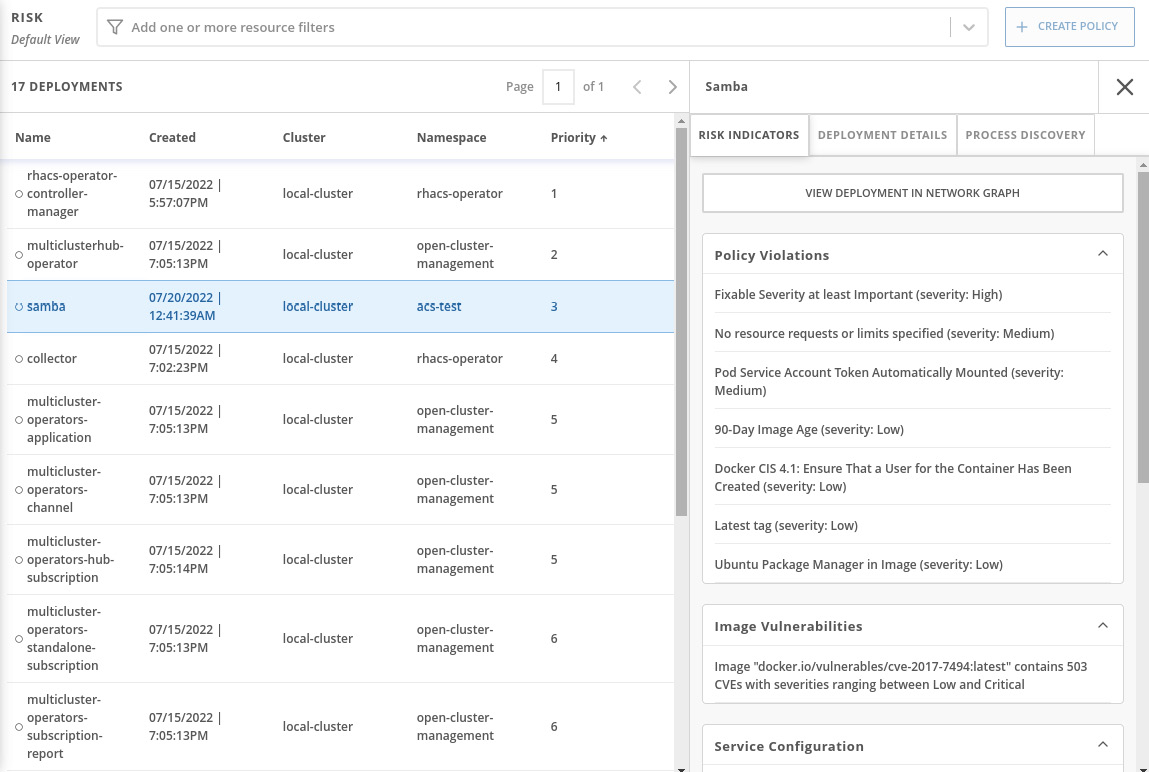
Figure 12.42 – Risk details
We will not walk through each option there but will highlight the PROCESS DISCOVERY tab, which provides some interesting insights, as you can see next:
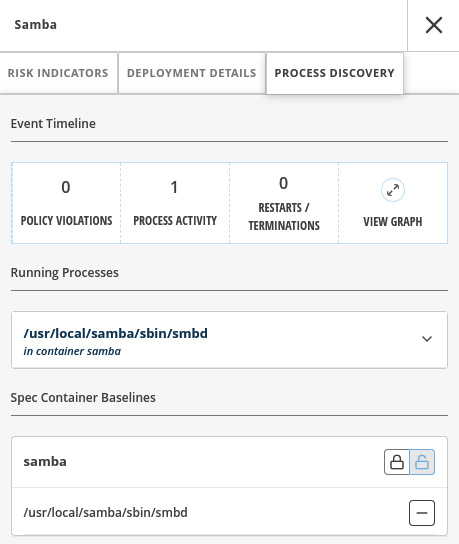
Figure 12.43 – Process Discovery
In this tab, you can see all the processes that are running in the container including details and also a graph that shows the process activities over time. Click on the VIEW GRAPH link to see it:
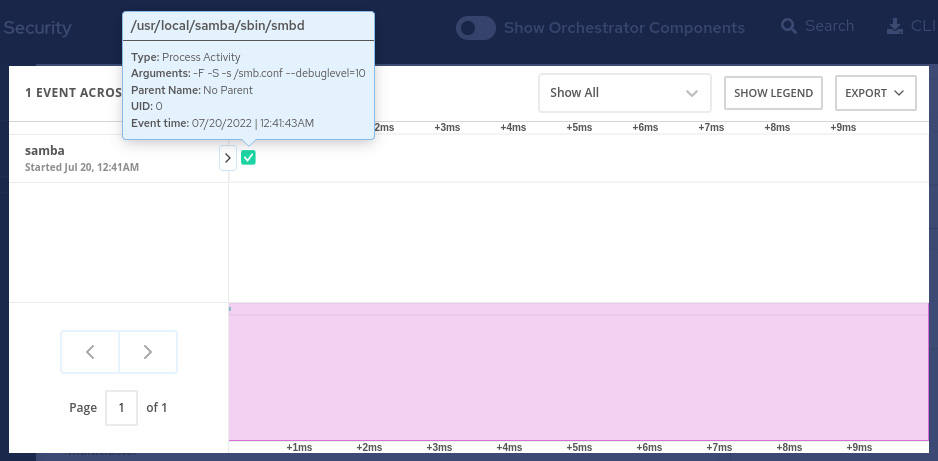
Figure 12.44 – Process graph
This Risk feature can be helpful for you to sort your deployments in terms of security risks and then take action according to the prioritized list.
Compliance
The Compliance feature scans your clusters and reports them according to some out-of-the-box compliance industry standards, such as CIS Benchmarks for Docker and Kubernetes, Health Insurance Portability and Accountability Act (HIPAA), National Institute of Standards and Technology (NIST) Special Publications 800-190 and 800-53, and Payment Card Industry Data Security Standard (PCI DSS).
To run the compliance scan, navigate to the Compliance feature and click on the SCAN ENVIRONMENT button:
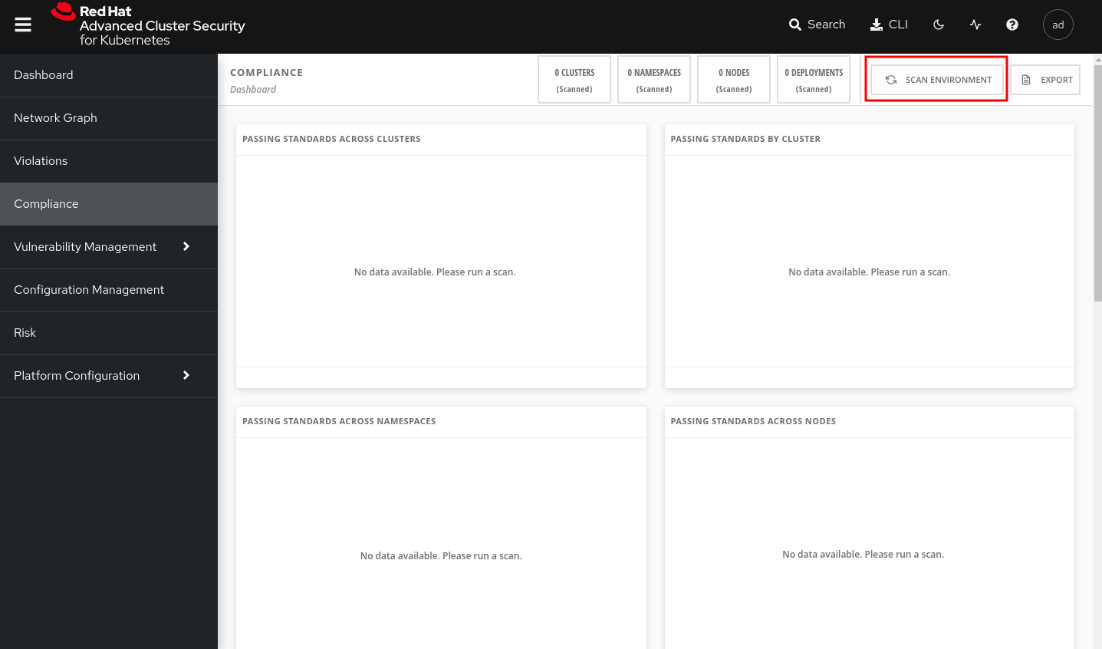
Figure 12.45 – Compliance feature
After some seconds, you will see the compliance report, as follows:
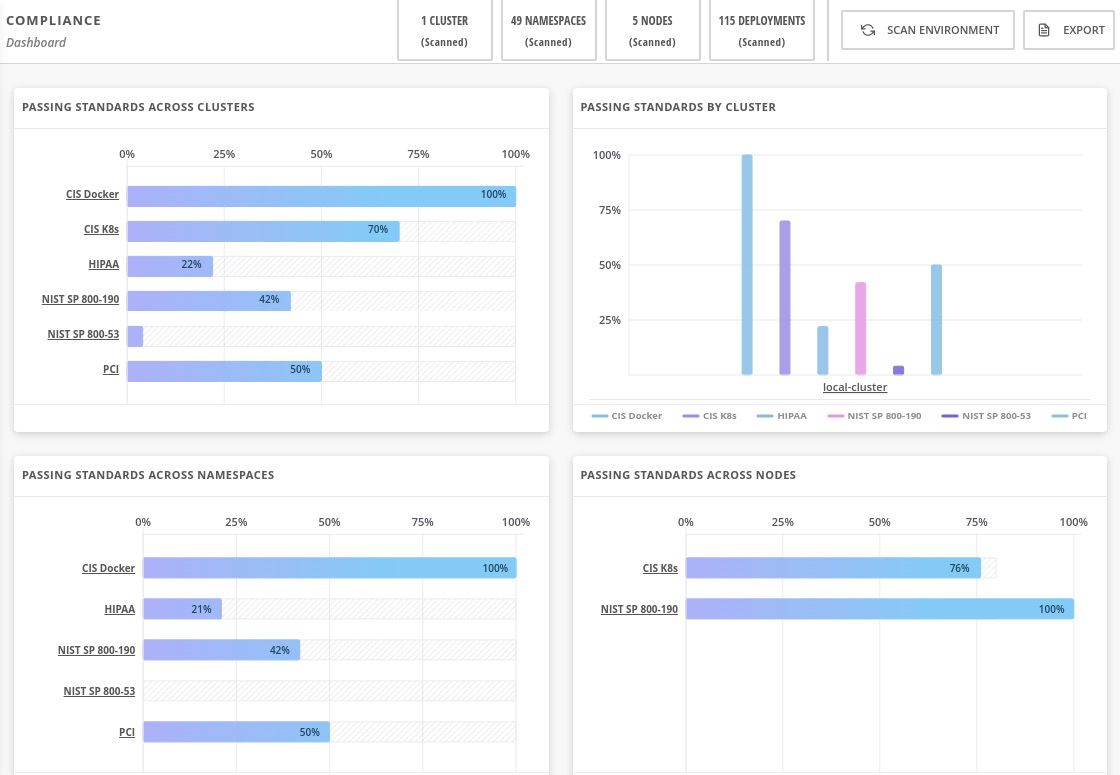
Figure 12.46 – Compliance report
We will not dive into each of these industry standards, as they are very specific to different industries. We encourage you to explore the feature, click on each graph, drill down, and check which controls are compliant and not compliant and why. Read the reference we left in the Further reading if you want to see more about this compliance feature.
Configuration Management
The Configuration Management feature is a different way to look at policies that are violated, correlating with the various objects that make up the configuration and use of the clusters. Using this feature, you can list all failing policies for all clusters and drill down to inspect all namespaces, deployments, and so on. You may be thinking that the same information can also be found in Violations and Vulnerability Management, and that is true! The same information is also there; however, here, you will find it grouped by clusters’ entities and also displaying summary data of each entity, which will help you to correlate the different entities and learn about the connections among them.
To access this feature, navigate to the Configuration Management menu:
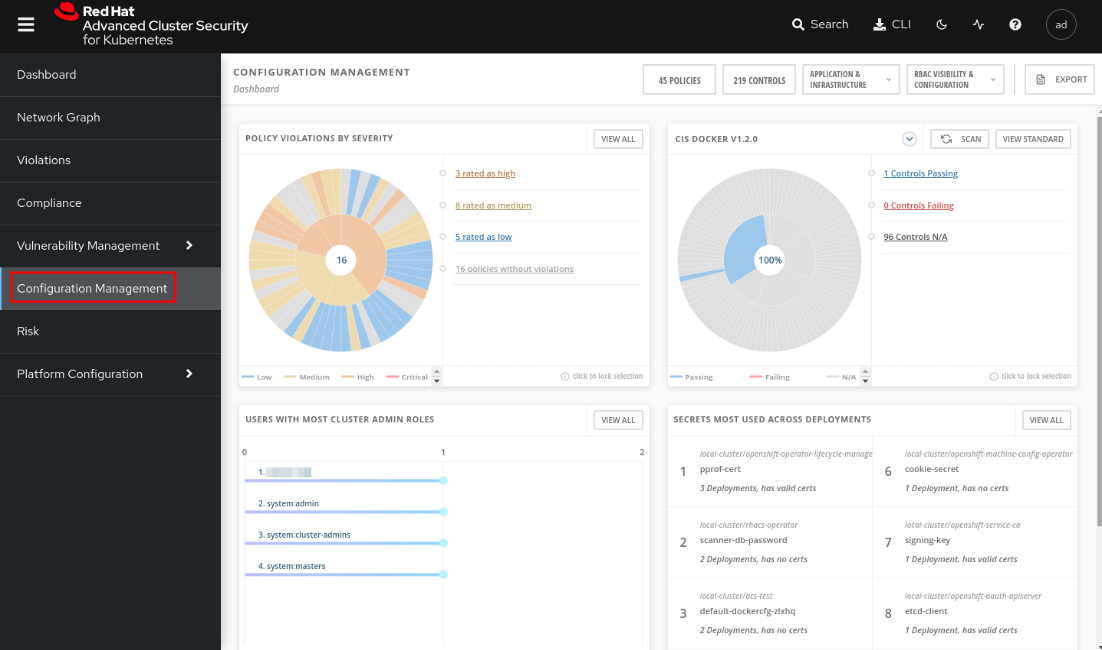
Figure 12.47 – Configuration Management feature
You will first see a dashboard that summarizes the following information:
- POLICY VIOLATIONS BY SEVERITY: Group the policy violations by severity (critical, high, medium, and low) and display them in a pie chart. You can drill down and inspect the policies by clicking on the link on the right side of the pie chart:
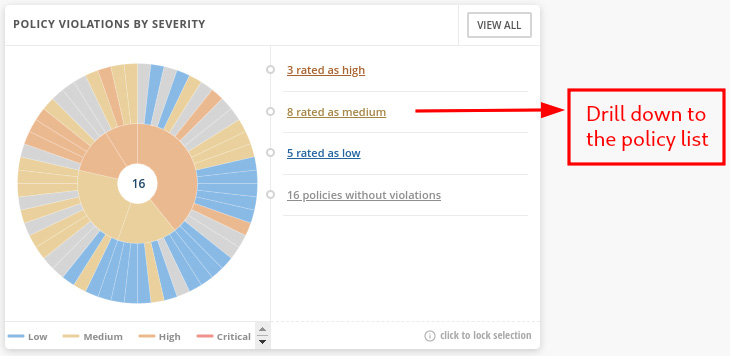
Figure 12.48 – POLICY VIOLATIONS BY SEVERITY pie chart
- CIS DOCKER/Kubernetes: Another pie chart grouping entities by CIS Docker or CIS Kubernetes controls:
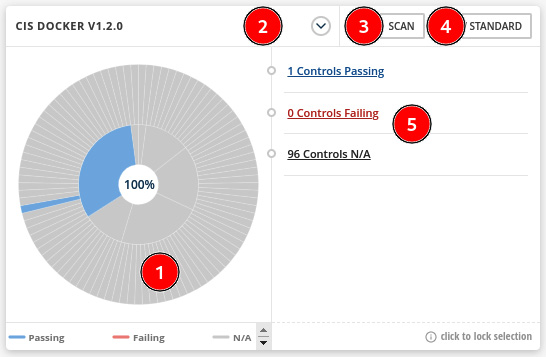
Figure 12.49 – CIS DOCKER/KUBERNETES pie chart
See next the description of this pie chart:
- Pie chart that summarizes the controls compliance considering the CIS Docker or Kubernetes standard.
- Click here to switch between CIS Docker and CIS Kubernetes.
- Click on the SCAN button to perform a new scan in the environment.
- Click on VIEW STANDARD to get a list of all CIS controls and the status (Passing, Failing, or N/A).
- Drill down to the passed, failed, or N/A control list.
- USERS WITH MOST CLUSTER ADMIN ROLES: This is self-explanatory. You can use this list to review users’ permissions and make sure they have the proper permissions:
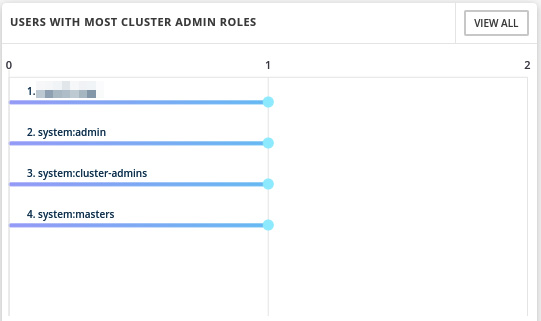
Figure 12.50 – Users with most cluster admin roles
- SECRETS MOST USED ACROSS DEPLOYMENTS: Also self-explanatory. Use this list to find sensitive data and how it is accessed through the environment, and look for suspicious activities:
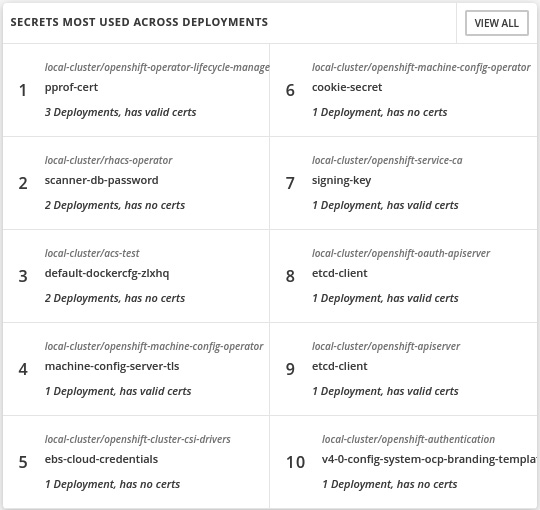
Figure 12.51 – Secrets most used across deployments
You can also use the bar at the top of this page to inspect the policies and controls by clusters, namespaces, nodes, deployments, images, secrets, users and groups, service accounts, and roles:
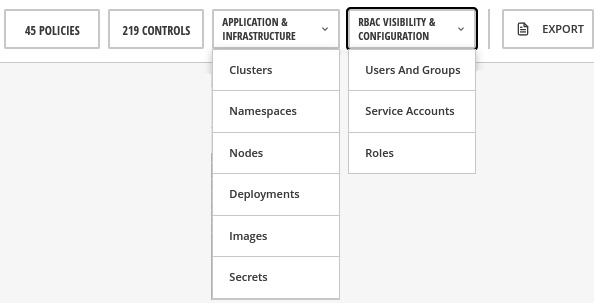
Figure 12.52 – View policies and controls by entities
Click on the menu options and explore the different lists you get with each of them. Notice also that you can drill down from clusters to deployments, images, and so on to navigate back and forth to analyze the entities:
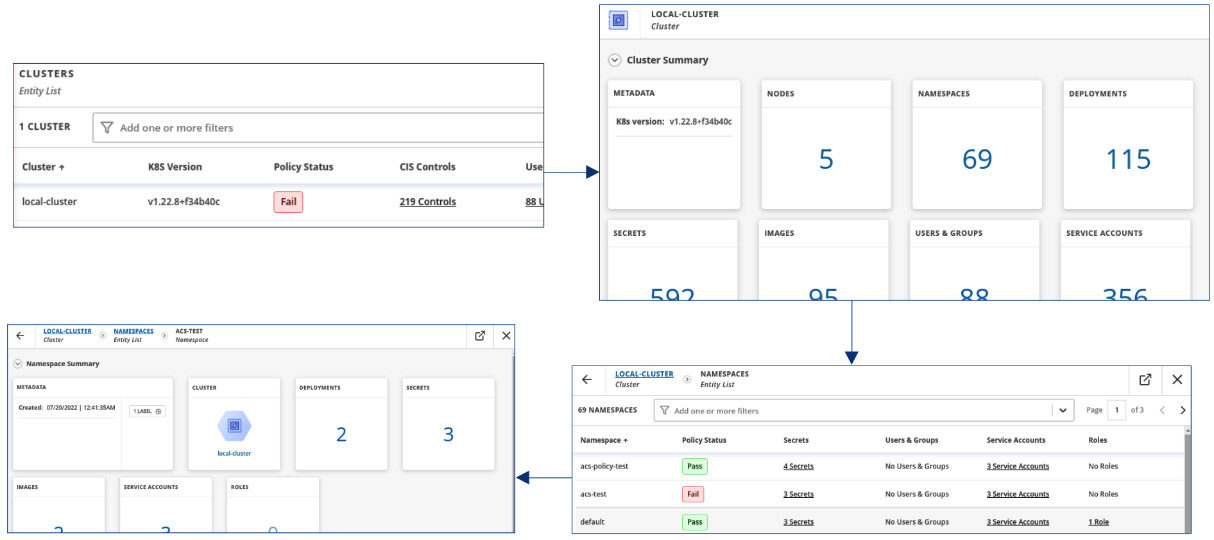
Figure 12.53 – Drill down from cluster to namespace
This concludes an overview of the Configuration Management feature. Continue reading to see a great feature ACS brings to help you to inspect your clusters’ network communication.
Network segmentation
An important security aspect in any Kubernetes cluster is how Pods communicate between each other and also ingress and egress communication. Currently, there isn’t any graphical view on Kubernetes to check how the network communications are performed in real time, and neither allowed nor blocked flows. To help with that, ACS brings the Network Graph feature, which allows you to view the active communications in real time and also define and apply NPs to allow or block network traffic. Click on the Network Graph menu to access the feature:
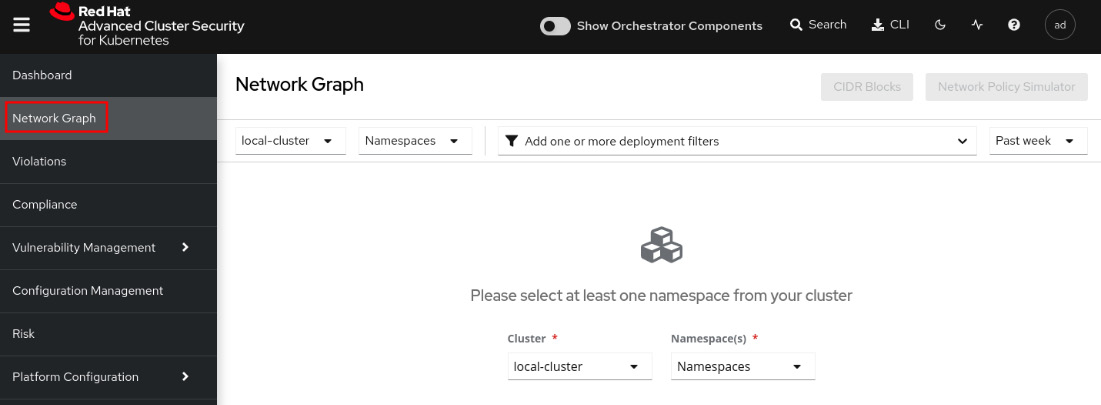
Figure 12.54 – Network Graph feature
Select the rhacs-operator namespace to view what the network graph looks like:
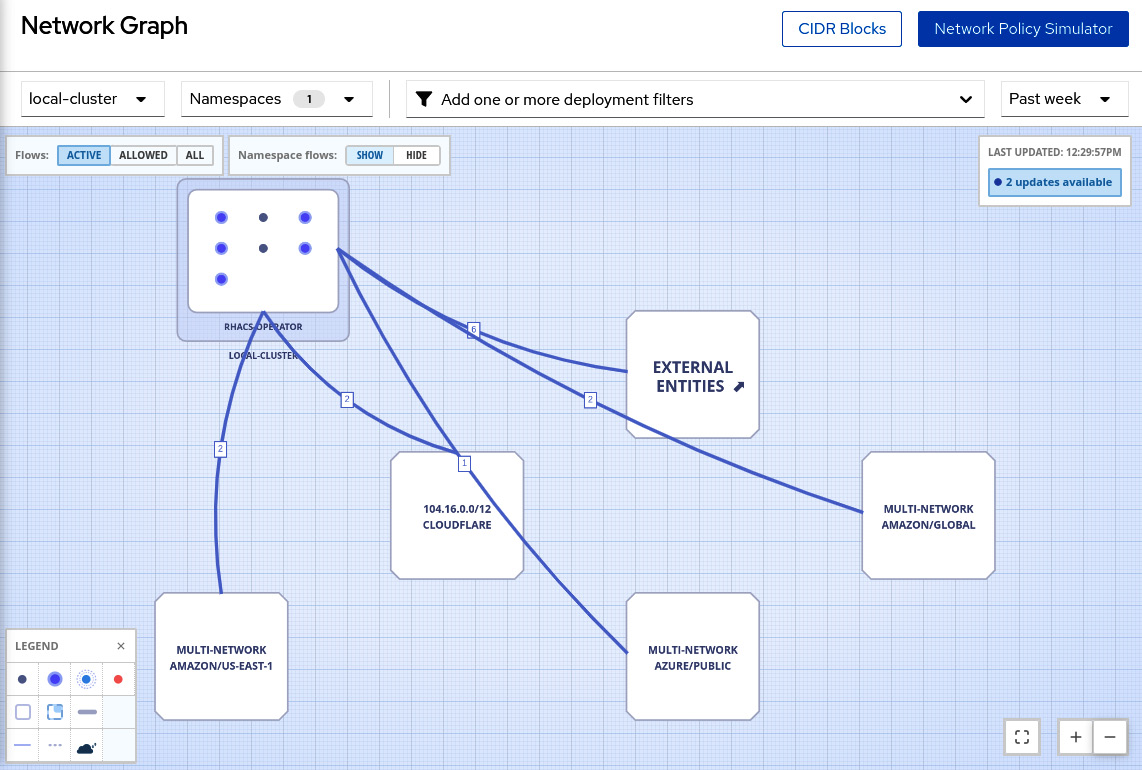
Figure 12.55 – Network graph for the rhacs-operator namespace
You can change the view to see only active connections, allowed connections, or all types of connection flows.
Network flows
Red Hat Advanced Cluster Security can learn the network flows used by the applications and apply a baseline of all network flows. Any network flows detected that are different from the baseline are marked as anomalous for your review. When viewing the network flows and baseline, access any deployment, and you will see the anomalous flows marked in red:
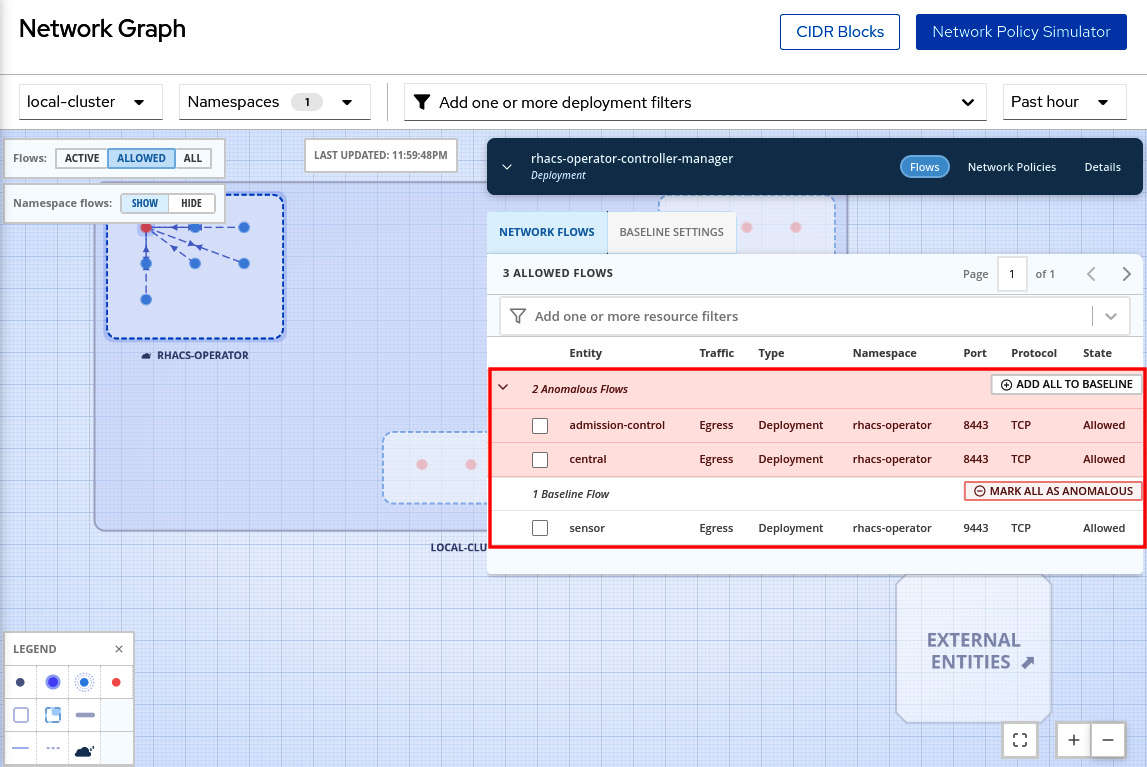
Figure 12.56 – Network flows – anomalous and baseline
Click on the BASELINE SETTINGS tab to check the current baseline:
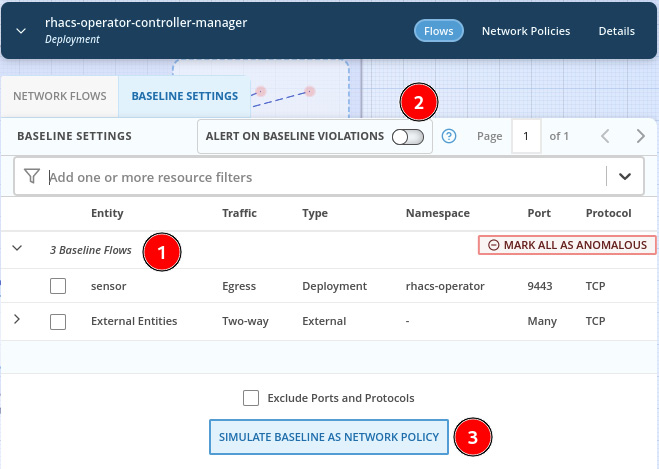
Figure 12.57 – Configure baseline
Through the BASELINE SETTINGS tab, you can do the following:
- View the baseline of network flows.
- Configure sending an alert when ACS detects anomalous flows.
- Simulate the impact in the environment of having the baseline as NPs.
See next how to also use the Network Graph feature to generate a list of NPs (Network Policies) to allow only the communications that are required by the applications.
Network Policy Simulator
Do you know whether the NP configurations of your clusters allow only required communications and nothing more? Clusters with a permissive set of NPs are very common and the ACS Network Policy Simulator can help to avoid that. ACS monitors the network traffic between all Pods and namespaces in the clusters to create a matrix of firewall rules. You can use ACS to generate a set of NPs based on what it learned from the environment that will allow only the communications needed. To use this feature, click on the Network Policy Simulator button then click on Generate and simulate network policies:
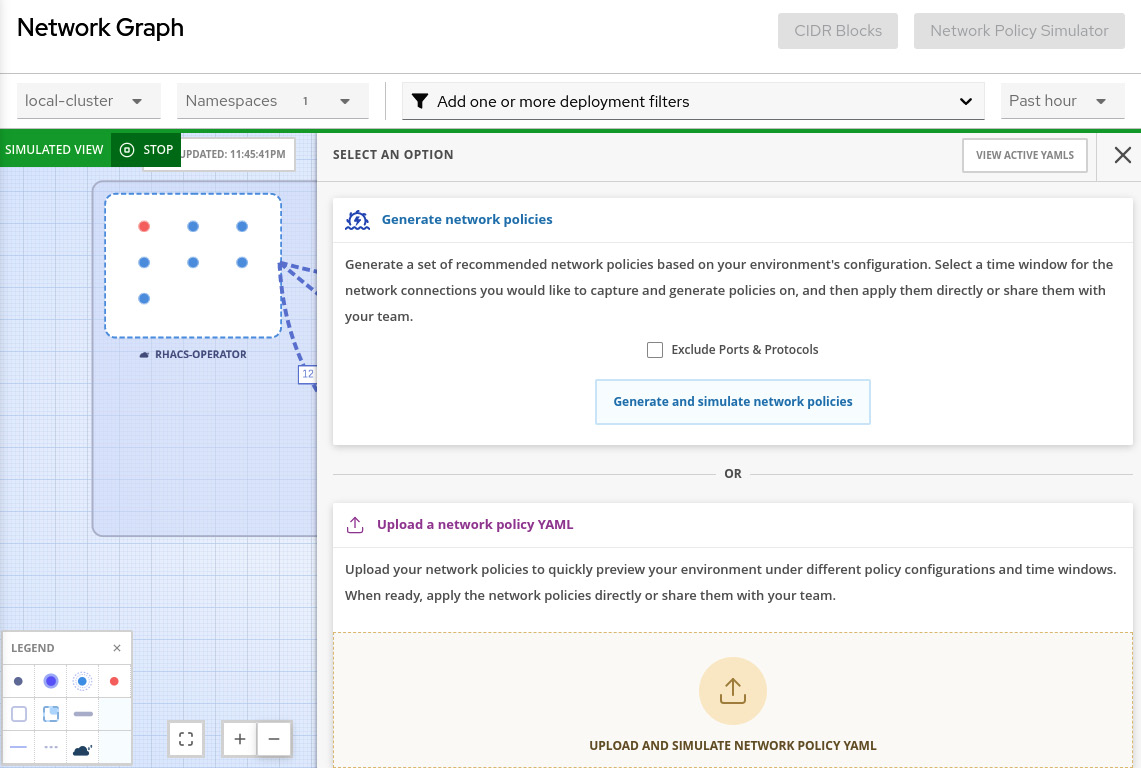
Figure 12.58 – Generate and simulate network policies
You will see an extensive list of NPs that will allow only the communications that ACS learned from the environment that is in use. You can apply the NPs in the environment or share them by email. We highly recommend you review and test the NPs in a development or test environment before applying them in production.
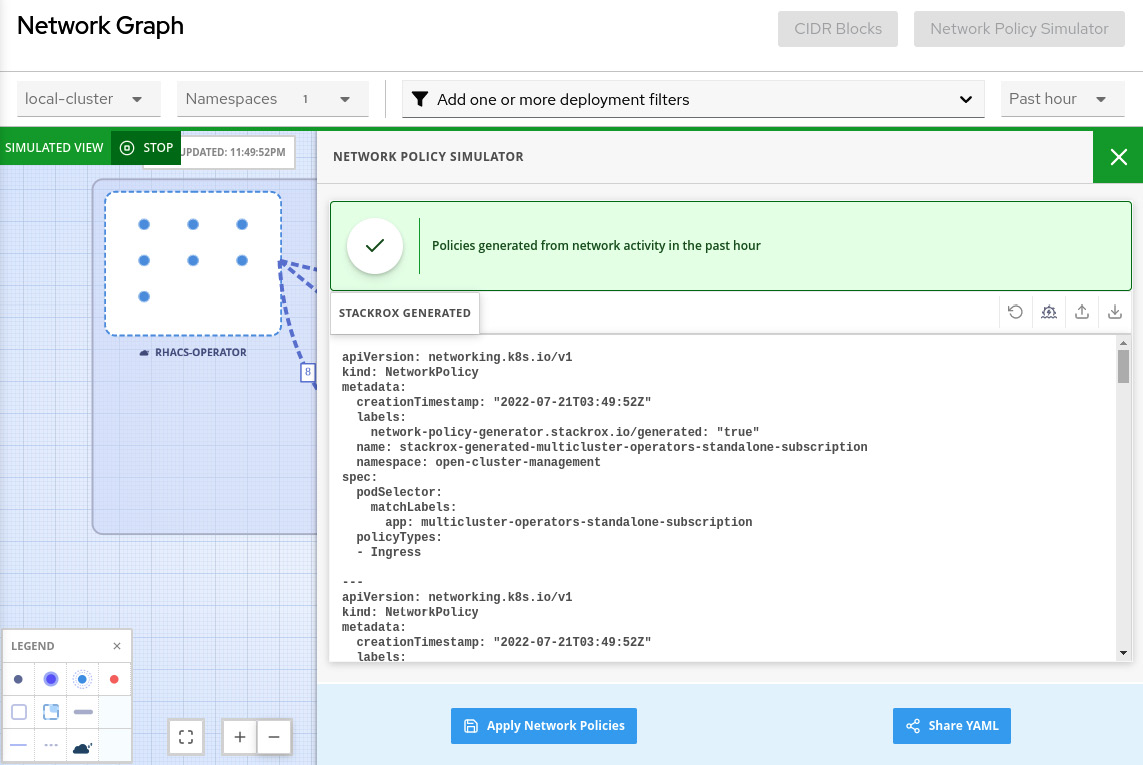
Figure 12.59 – Apply or share NPs
Helpful, right? Now explore the Network Graph feature a bit more and envision how this feature can help you and your organization to have more visibility into the network traffic and also allow only the communications that are really required by your applications.
Summary
We covered a lot of content in this chapter about Red Hat Advanced Cluster Security. In this chapter, we have seen an overview of ACS capabilities to help you to learn how ACS can help to make sure your clusters are secure and vulnerabilities are known, and put an action plan in place.
We learned how to use and define security policies and list all policy violations using the Violations feature. We also saw that the Vulnerability Management feature is very helpful to list all known vulnerabilities, review them, and take proper action: remediate (fix vulnerable packages), accept the risk, or mark them as false positives.
We also learned that the Risk profiling feature helps you to assess the risk of application deployments and prioritize the remediation and actions that need to be taken to enhance the security. Compliance reports the clusters, namespaces, and deployments in terms of industry standards, such as CIS Docker, HIPAA, NIST, PCI, and so on.
Finally, we saw the list of policies and controls aggregated by a cluster’s entities in the Configuration Management feature, helping to correlate the different entities into the clusters. Network Graph, in turn, gave us a nice view of the network flows in real time with some useful added features to help generate and simulate NPs and make sure only needed communications are allowed and nothing more.
We hope this chapter helped you to understand Red Hat Advanced Cluster Security. We encourage you to move on to the next chapter to see how ACM, ACS, and other pieces will build together a complete and comprehensive platform for multi-cloud or hybrid cloud: OpenShift Platform Plus.
Further reading
Looking for more information? Check the following references to get more information about Red Hat Advanced Cluster Security:
- KuppingerCole Report Leadership Compass: Container security: https://www.redhat.com/en/resources/kuppingercole-container-security-report-analyst-material
- ACM installation using the Operator: https://docs.openshift.com/acs/3.70/installing/install-ocp-operator.html
- ACM installation using Helm: https://docs.openshift.com/acs/3.70/installing/installing_helm/install-helm-quick.html
- ACM installation using the roxctl CLI: https://docs.openshift.com/acs/3.70/installing/install-quick-roxctl.html
- Threat matrix for Kubernetes – Microsoft article about MITRE ATT&CK®: https://www.microsoft.com/security/blog/2020/04/02/attack-matrix-kubernetes/
- Protecting Kubernetes Against MITRE ATT&CK: Initial Access – First of a series of articles about the MITRE ATT&CK® framework: https://cloud.redhat.com/blog/protecting-kubernetes-against-mitre-attck-initial-access
- MITRE ATT&CK® knowledge base: https://attack.mitre.org/
- Configuring the vulnerability reports: https://docs.openshift.com/acs/3.70/operating/manage-vulnerabilities.html#vulnerability-management-reporting_acs-operating-manage-vulnerabilities
- Managing compliance: https://docs.openshift.com/acs/3.70/operating/manage-compliance.html