6
OpenShift Troubleshooting, Performance, and Best Practices
The concepts explained in Chapter 5, OpenShift Deployment, provided the foundation for you to initiate your first contact with an OpenShift cluster. In this chapter, we will give some tips on how to perform a health check on a cluster, dive into some root cause analysis (RCA), and also provide details on how to make a cluster run according to some best practices. Our intention with this chapter is to give you some general guidance about troubleshooting, however, it is important you always open a support ticket with Red Hat before making any changes in the platform due to troubleshooting attempts.
This chapter covers the following topics:
- Things that can crash a cluster
- Troubleshooting reference guide—how to start
- Understanding misleading error messages
Note
The source code used in this chapter is available at https://github.com/PacktPublishing/OpenShift-Multi-Cluster-Management-Handbook/tree/main/chapter06.
Things that can crash a cluster
Every time we start learning about some technology, it is common to be twice as careful with the installation, configuration, or adjustment to be as thorough as possible. Sometimes, to achieve these goals related to troubleshooting, performance, and best practices, the reader would turn to multiple expert readings on each of the related topics, or go through the pain of trial and error, which takes a lot of effort to succeed.
OpenShift is a great and disruptive technology, but you will navigate through a puzzle of different aspects related to storage, compute, network, and others. Obviously, in the official documentation—or even in quick internet searches—you will find commands to start from scratch, but in many situations, even with the necessary commands and parameters, it is difficult to navigate from troubleshooting to a solution.
Currently, OpenShift has an automatic recovery system, but this is usually not enough to ensure a stable environment. For this self-healing to take place successfully, many prerequisites need to be checked on the cluster first. So, before we understand what can potentially crash, let’s understand how this self-adjustment mechanism works.
Operators
In the world of technology, there are many roles played, and some of them are linked to the administration of the infrastructure. There are several names for this role, the most common still being the system administrator, or sysadmin, who operates the servers and services of an information technology (IT) infrastructure. Likewise, OpenShift has operators that are nothing more than applications designed to monitor platform behavior and maintain an operation.
How do operators work? Operators are assigned to fulfill a single task of maintaining the application and all its components according to a standard. Understand that operators are not the same for all applications—that is, operators are unique, each with its own parameter definitions, configurations that are required and optional, and others.
The operator parameters’ contract is described in the Custom Resource Definition (CRD). A CRD is a definition that extends a Kubernetes application programming interface (API) functionality, giving more flexibility to the cluster to store a collection of objects of a certain type. Once a CRD is defined, you can create a Custom Resource (CR) that will allow you to add a Kubernetes’ custom API to the cluster.
Operators are a tool for keeping a cluster or application healthy, so why should we care about learning about OpenShift troubleshooting if it fixes itself? Indeed, operators are a powerful tool, but as we mentioned earlier, OpenShift is a big puzzle, and the pieces need to fit together perfectly for it to work properly. Although it is reigned by operators that are somehow prepared to maintain its integrity, failures can occur, and the role of the cluster administrator and their experience in solving problems will help keep all these operators healthy.
In the next sections, we’ll go deeper into the main components of OpenShift and which aspects to be concerned about.
etcd
In the case of OpenShift clusters, etcd is a distributed key-value service responsible for storing the state of the cluster. Through it, all objects contained in the cluster are shown in a key-value format, so it is important to consider at least three important factors in this service, which is the heart of the control plane’s operation. Note the following:
- etcd is highly sensitive to an infrastructure’s latency and bandwidth.
- etcd needs to be distributed on all master nodes—that is, to be highly available, an OpenShift cluster infrastructure demands this service be distributed on three master nodes.
- Unlike many high-availability (HA) services, in which you have a main and a secondary server, with etcd, this concept is based on quorum members and leadership.
Red Hat made the etcd complexity easier by establishing the number of master nodes to be 3 as default and also by using a cluster operator that manages etcd and reports any issue in it; however, you must still understand how etcd works to be able to troubleshoot if any complex issue occurs. Go ahead to learn how the quorum and leader-based etcd algorithm works.
How do the quorum and leader-based schemes work?
An etcd cluster works on the concept of leader and followers, which is known as the Raft Distributed Consensus protocol. This protocol implements an algorithm based on a leader election to establish a distributed consensus among all members of an etcd cluster. Once members are added to an etcd cluster and a leader is elected, the process only requires sending periodic heartbeats to confirm that the leader still responds within a suitable latency time.
In case of an unanswered heartbeat time frame, the members start a new election to guarantee cluster resilience, self-healing, and continuity of service.
It is recommended that an etcd cluster has an odd number of nodes so that the following formula guarantees the tolerance of a given number of failing members. To this we give the name of quorum:
Quorum = (n/2)+1, where “n” represents the number of members.
A cluster must always have at least the quorum number of members working to be functioning properly. For the sake of clarity, let’s check out some scenarios, as follows:
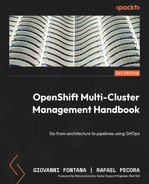
- Scenario 1: Three-member cluster, all up and running, as illustrated in the following diagram:
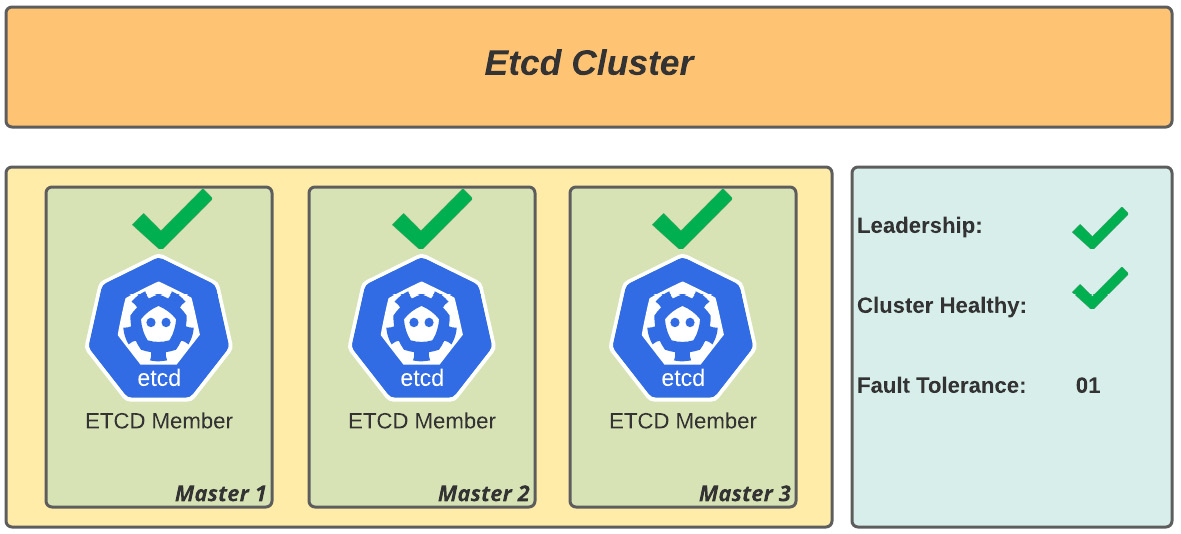
Figure 6.1 – Healthy etcd cluster (three-node member health)
Analysis: Quorum is OK as there are a majority of working members and leadership is assured, so the cluster is healthy.
- Scenario 2: Three-member cluster with two members working, as illustrated in the following diagram:
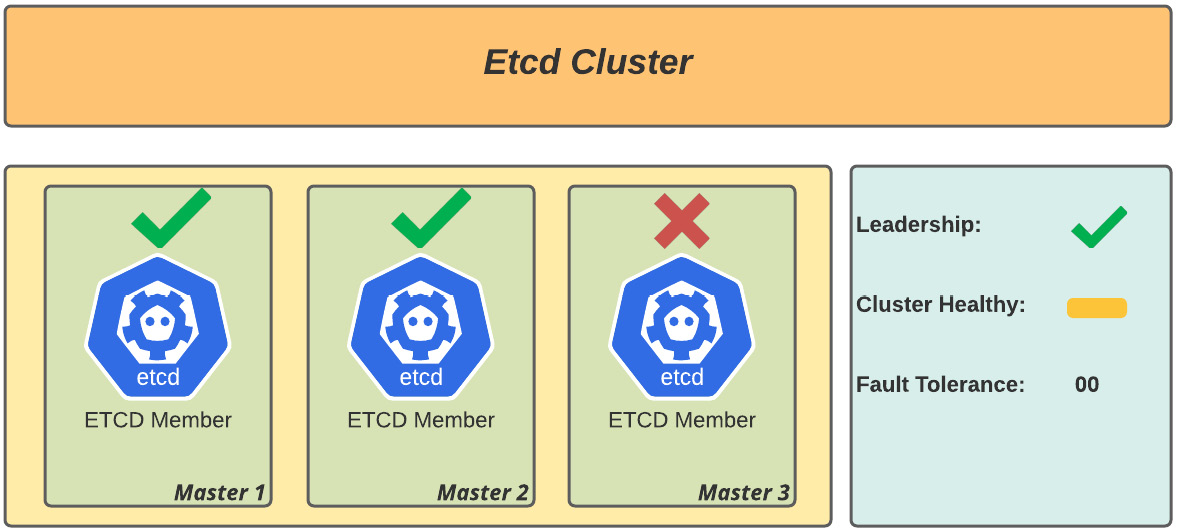
Figure 6.2 – Healthy etcd cluster (two-node member health; risk of outage)
Analysis: Quorum is OK as there are a majority of working members and leadership is assured. There is a degradation risk in case of disruption of one more node, but the cluster is healthy.
- Scenario 3: Three-member cluster with one member working, as illustrated in the following diagram:
Figure 6.3 – Degraded etcd cluster (one-node member health; unhealthy cluster)
Analysis: There is no quorum as the majority of members are down, so it is no longer possible to elect a new leader, and the cluster is degraded.
Troubleshooting etcd
As mentioned earlier, OpenShift is managed by its operators, which can provide standardization, self-healing, and activities metrics, but this is not always enough to keep the cluster fully functional.
Situations such as scenarios 2 and 3 can occur due to different factors related to any infrastructure layer. It is important to carry out an in-depth analysis to restore the cluster to a functional state. Here’s an approach to troubleshooting etcd.
For troubleshooting, it is important to consider what kind of disruption the cluster has been hit with. If we are still able to use the OpenShift API to access the nodes, you can use the first approach. Otherwise, if the API is unavailable, you must refer to the second scenario.
Scenario 1 – etcd member is degraded
In cases where it is still possible to execute oc or kubectl commands, use the rsh command to the etcd pod, and performing the following steps through etcdctl is the quickest approach.
An etcd degradation can occur for many different reasons, such as storage or network failures, live migration of the master nodes, or even manipulations in the operating system (OS), which may cause immediate disruption of the cluster.
As mentioned before, run the following commands to open a terminal in an etcd pod and identify the failure:
$ oc project openshift-etcd
$ oc get pods -n openshift-etcd | grep -v etcd-quorum-guard | grep etcd
etcd-ocp-master-0 3/3 Pending 0 14m
etcd-ocp-master-1 3/3 CrashLoopBackOff 6 17m
etcd-ocp-master-3 2/3 Running 0 9m11s
Notice that in the previous output, two out of three masters are getting issues, so let’s rsh to master-3, perform a backup, and recreate the etcd nodes, as follows:
oc rsh etcd-ocp-master-3
Defaulting container name to etcdctl.
Use 'oc describe pod/etcd-ocp-master-3 -n openshift-etcd' to see all of the containers in this pod.
sh-4.4# etcdctl member list -w table
+------+------+------+------+------+------+
| ID | STATUS | NAME | PEER ADDRS | CLIENT ADDRS | IS LEARNER +------+------+------+------+------+------+
| 5bdacda4e0f48d91 | failed | ocp-master-1 | https://192.168.200.235:2380 | https://192.168.200.235:2379 | false |
| b50b656cba1b0122 | started | ocp-master-3 | https://192.168.200.14:2380 | https://192.168.200.14:2379 | false |
| cdc9d2f71033600a | failed | ocp-master-0 | https://192.168.200.234:2380 | https://192.168.200.234:2379 | false |
+------+------+------+------+------+------+
sh-4.4# etcdctl endpoint status -w table
+------+------+------+------+------+------+
| ENDPOINT | ID | VERSION | DB SIZE | IS LEADER | IS LEARNER | RAFT TERM | RAFT INDEX | RAFT APPLIED INDEX | ERRORS |
+------+------+------+------+------+------+
| https://192.168.200.14:2379 | b50b656cba1b0122 | 3.4.9 | 136 MB | true | false | 281 | 133213554 | 133213554 | |
| https://192.168.200.234:2379 | cdc9d2f71033600a | 3.4.9 | 137 MB | false | false | 281 | 133213554 | 133213554 | |
| https://192.168.200.235:2379 | 5bdacda4e0f48d91 | 3.4.9 | 136 MB | false | false | 281 | 133213554 | 133213554 | |
+------+------+------+------+------+------+
Once the identifiers (IDs) of the failed members are determined, the next step is to remove the etcd members, leaving only the one that is running as part of the cluster. To do so, first run the backup of etcd, like so:
/usr/local/bin/cluster-backup.sh /home/core/assets/backup
Note
The etcd backup will be saved in the home directory of the core user in the same node as the one where the etcd pod is running. It is highly recommended you copy it to an off-node location as this will avoid the risk of losing access to the node and, as such, losing the etcd backup file and putting the cluster recovery at risk.
Now that you have already identified the problem with the etcd cluster, see next the suggested steps to recover your cluster.
How to solve it?
Formerly, on OpenShift version 3, the usual solution for both cases was reestablishing the etcd cluster using a backup. Now, with OpenShift 4, it is easier to provision new master nodes in your infrastructure. That said, if your issue is the first scenario (API is still available) and your installation is the installer-provisioned infrastructure (IPI) method, we suggest you take the following steps to recreate the problematic master node, using a new node name:
- Get the YAML Ain’t Markup Language (YAML) machine descriptor for any current master node by running the following command:
oc get machine <master-node>
-n openshift-machine-api
-o yaml
> new-master-machine.yaml
- The YAML file should look like this:
new-master-machine.yaml
apiVersion: machine.openshift.io/v1beta1
kind: Machine
metadata:
finalizers:
- machine.machine.openshift.io
labels:
machine.openshift.io/cluster-api-cluster: ocp-sgw5f
(.. omitted ..)
name: ocp-master-4
namespace: openshift-machine-api
selfLink: /apis/machine.openshift.io/v1beta1/namespaces/openshift-machine-api/machines/ocp-master-4
spec:
metadata: {}providerSpec:
value:
apiVersion: vsphereprovider.openshift.io/v1beta1
credentialsSecret:
name: vsphere-cloud-credentials
diskGiB: 120
kind: VSphereMachineProviderSpec
(.. omitted ..)
- Make the required changes in the YAML file to provision the new master, as follows:
- Entire status, metadata.annotations, and metadata.generation sections.
- Delete metadata.resourceVersion, metadata.uid, and spec.providerId fields.
II. Change the metadata.name field to a new name (for example, <clustername>-<clusterid>-master-3).
- Also update the node name in the metadata.selfLink field.
- Delete the problematic master node using the following command:
$ oc delete machine <problematic-master-node-name> -n openshift-machine-api
- Use the following command to monitor the deletion process and certify it has been deleted:
$ oc get machines -n openshift-machine-api -o wide
- As soon as the problematic master has been deleted, you can now provision a new one using the YAML we prepared previously. To do so, run the following command:
oc apply –f new-master-machine.yaml
Note
Repeat this procedure if necessary, changing only the metadata.name and metadata.selfLink fields for each problematic master node in your cluster.
After the new master nodes have been provisioned, observe the following steps to verify whether the etcd cluster is healthy:
- Check if all etcd pods are running, as follows. You must see three pods running:
$ oc get pods -n openshift-etcd | grep -v etcd-quorum-guard | grep etcd
- There are some cases in which the etcd pod is not deployed automatically with the master provisioning. If you don’t see three pods running, you may run the following command to force the etcd operator to deploy the etcd pod in the new node:
$ oc patch etcd cluster -p='{"spec": {"forceRedeploymentReason": "recovery-'"$( date --rfc-3339=ns )"'"}}' --type=merge - Now, let’s check from inside the etcd cluster whether it is working as expected. To do so, run the following command to open a terminal inside one of the etcd pods:
# Get the name of one etcd pod
$ oc get pods -n openshift-etcd | grep -v etcd-quorum-guard | grep etcd
$ oc rsh <etcd-pod-name> -n openshift-etcd
- Now, check the cluster member list, like so:
etcdctl member list -w table
- In some cases, you will still see the problematic etcd node that we already removed as part of the cluster members. Therefore, if the previous command shows more than three members, use the following command to remove the nonfunctional etcd members:
$ etcdctl remove <member-id>
Scenario 2 – cluster API down
If the OpenShift API is down, it is important to perform any steps with much more caution to avoid an irreversible loss to the cluster. In such a scenario, you can’t use the rsh command, get logs using oc logs, OR use any oc or kubectl command, as all of them use the OpenShift API, which makes troubleshooting and finding a solution much more difficult and complex.
Due to that, there must be regular etcd backups in place before the cluster malfunctions. If there is no previous backup, the first step is to perform a direct backup on the node that is in operation. To do so, proceed as follows:
- Run the following command:
$ ssh -i ~/.ssh/id_rsa core@ocp-master-3
- Check out the etcd state by running the crictl command, like so:
$ sudo crictl | grep –i etcd
- Get the etcd pod ID and run the crictl exec statement to identify the cluster’s node state, as follows:
$ crictl exec bd077a3f1b211 etcdctl member list -w table
+---+---+---+---+---+---+
| ID | STATUS | NAME | PEER ADDRS | CLIENT ADDRS | IS LEARNER |
+---+---+---+---+---+---+
| 9e715067705c0f7c | unknown | ocp-master-4 | https://192.168.200.15:2380 | https://192.168.200.15:2379 | false |
| b50b656cba1b0122 | started | ocp-master-3 | https://192.168.200.14:2380 | https://192.168.200.14:2379 | false |
| cdc9d2f71033600a | failed | ocp-master-0 | https://192.168.200.234:2380 | https://192.168.200.234:2379 | false |
+---+---+---+---+---+---+
- Note that the etcd members are unreachable except for one that is in the started state. Run a backup by going to the node and running the backup command, as follows:
sudo /usr/local/bin/cluster-backup.sh /home/core/assets/backup
- With the pod ID of etcd, obtained by crictl, run the following command to identify the cluster nodes and their state:
$ crictl exec bd077a3f1b211 etcdctl endpoint status -w table
+-------+-------+-------+-------+-------+-------+
| ENDPOINT | ID | VERSION | DB SIZE | IS LEADER | IS LEARNER | RAFT TERM | RAFT INDEX | RAFT APPLIED INDEX | ERRORS |
+-------+-------+-------+-------+-------+-------+
| https://192.168.200.14:2379 | b50b656cba1b0122 | 3.4.9 | 136 MB | true | false | 491 | 133275501 | 133275501 | |
| https://192.168.200.15:2379 | 9e715067705c0f7c | 3.4.9 | 137 MB | false| false | 491 | 133275501 | 133275501 | |
+-------+-------+-------+-------+-------+-------+
At this stage, it is possible to draw some conclusions. We understand that there is no minimum quorum to keep the cluster up, so the API became unavailable. Continue next for a suggestion on how to proceed in this scenario.
How to solve it?
In general, to restore a cluster in this scenario you will use the command etcdctl member remove to remove all problematic etcd members and then use the procedure we described in the previous How to solve it? section to remove problematic master nodes and provision new ones. However, troubleshooting a cluster in this scenario is much more challenging, work with Red Hat support to find the best way to restore it.
Now that we have already gone through etcd troubleshooting, let’s discuss another important aspect of it: performance analysis.
etcd performance analysis
Kubernetes clusters are highly sensitive to latency and throughput. Due to this, some precautions are necessary to have a stable cluster and also great performance. OpenShift is a platform designed for HA, and, as such, the expected etcd use and consumption are traffic-intensive. It is important, then, to follow some best practices to have a stable cluster. Let’s look at some recommended configurations.
Storage
etcd’s disk usage is intensive, so it is recommended to use solid-state drive (SSD) disks for a fast write/read response time. Regarding response times, we could say that 50 sequential input/output operations per second (IOPS) would be a minimum requirement, but from our experience, the OpenShift usage grows really fast, so we recommend you consider disks that can deliver at least 500 concurrent IOPS, to maintain the cluster’s health and stability. However, note that some providers do not publish the sequential IOPS but only the shared IOPS. In such cases, consider that concurrent IOPS is equivalent to 10 times the sequential IOPS value.
Here is an example of how to measure the performance of the etcd disks using a customized version of the fio tool. In the OpenShift cluster, run the debug command to get access to a master node, like so:
$ oc debug node/master1.ocp.hybridcloud.com
As soon as the command is executed, the following message will be displayed. Execute the chroot command after the shell to be able to execute commands in privileged mode:
Starting pod/ocp-master1hybridcloud-debug ...
 To use host binaries, run `chroot /host`
 chroot /host
Pod IP: 172.19.10.4
 If you don't see a command prompt, try pressing enter.
 sh-4.4# chroot /host
 sh-4.4#
Create a container, as indicated in the following code snippet. After the etcd-perf container starts, it will automatically run performance checks:
sh-4.4# podman run --volume /var/lib/etcd:/var/lib/etcd:Z quay.io/openshift-scale/etcd-perf Trying to pull quay.io/openshift-scale/etcd-perf:latest...
Getting image source signatures
(.. omitted ..)
------- Running fio ------{
"fio version" : "fio-3.7",
"timestamp" : 1631814461,
"timestamp_ms" : 1631814461780,
"time" : "Thu Sep 16 17:47:41 2021",
"global options" : {
"rw" : "write",
 "ioengine" : "sync",
"fdatasync" : "1",
 "directory" : "/var/lib/etcd",
"size" : "22m", [1]
"bs" : "2300" }, [2]
(.. omitted ..)
"write" : {
"io_bytes" : 23066700,
"io_kbytes" : 22526,
"bw_bytes" : 1319077,
"bw" : 1288, [3]
"iops" : 573.511752, [4]
(.. omitted ..)
"read_ticks" : 3309,
"write_ticks" : 29285,
"in_queue" : 32594,
"util" : 98.318751
} ]
}
---------
99th percentile of fsync is 5406720 ns
99th percentile of the fsync is within the recommended threshold - 10 ms, the disk can be used to host etcd [5]
In the preceding code snippet, we have used the following annotations:
[1]: A chunk size of 22 megabytes (MB) is usually enough to analyze performance results.
[2]: Instead of using 4k block size, etcd uses small chunks of 2.3k block size, so it guarantees performance, including with small writing fragmentations.
[3]: Bandwidth required considering traffic between the node and underlying storage. It is recommended you use at least a network interface of 1 gigabyte (GB). For medium and large clusters, the recommendation is a 10 GB interface.
[4]: The recommendation is at least 500 concurrent IOPS, as explained previously.
[5]: The report of the etcd IO check. In the example, 5.40 milliseconds (ms) demonstrates a reliable performance—for it to be so, it must be under 10 ms.
Besides using etcd-perf to check the disk performance, you could also perfectly use custom parameters as you need, such as block size, chunk size, and so on, using the fio binary tool, which is available using the standard Red Hat package manager (for example, by executing yum/dnf install fio).
Note
For didactic reasons, we suppressed some results, leaving only items that are pertinent to our analysis.
etcd sizing
To avoid any problems related to the central processing unit (CPU), you must understand whether your cluster is well-sized. You must consider some factors to check the cluster sizing, such as the number of customers using the platform, the expected number of requests per second, and the amount of storage available for etcd.
First, let’s give you some parameters to consider for your cluster size:
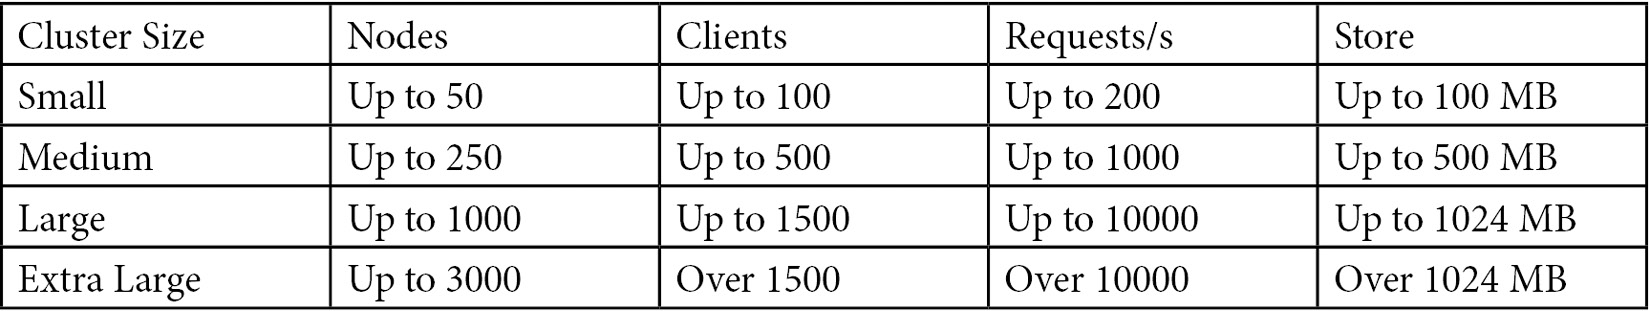
The following table demonstrates some use cases using public clouds and on-premises infrastructures according to the amount of CPU, memory, disk IOPS, and bandwidth linked to the cluster size:
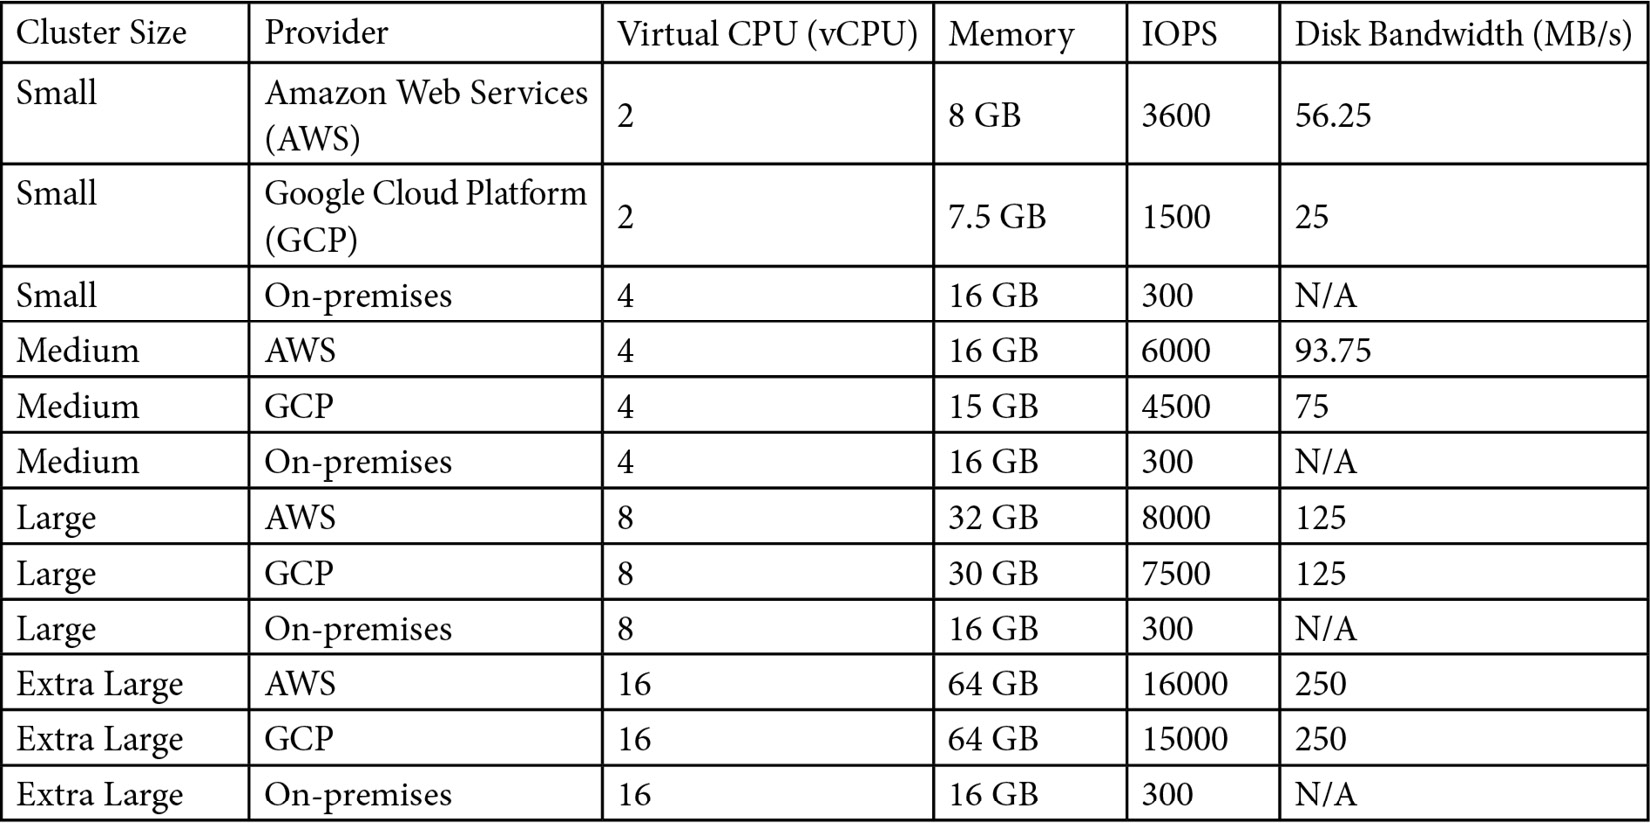
In a nutshell, when you size a cluster, you should consider these thresholds because this is already benchmarked by the etcd community, and their performance will likely be acceptable if these recommendations are followed. Further information regarding sizing the etcd cluster can be found at the link we have provided in the Further reading session of this chapter.
In this section, you have seen some ways to check etcd performance and troubleshoot, and you also got some important information regarding sizing best practices. We hope you enjoyed the approach and take a close look at the next section about authentication, which will be another interesting theme.
Authentication
Another important aspect of an OpenShift cluster is user authentication and authorization flow. OpenShift’s flexibility and easy-to-use authentication plugins are a smart way of setting up users and groups. Instead of simply having a vault of usernames and passwords, OpenShift’s authentication service can authenticate a user in a variety of ways—we call it an identity provider (IdP). In this way, OpenShift is responsible for trusting the IdP and allowing or denying authentication according to the provider. In the following diagram, you can see how the process of authenticating a user works:
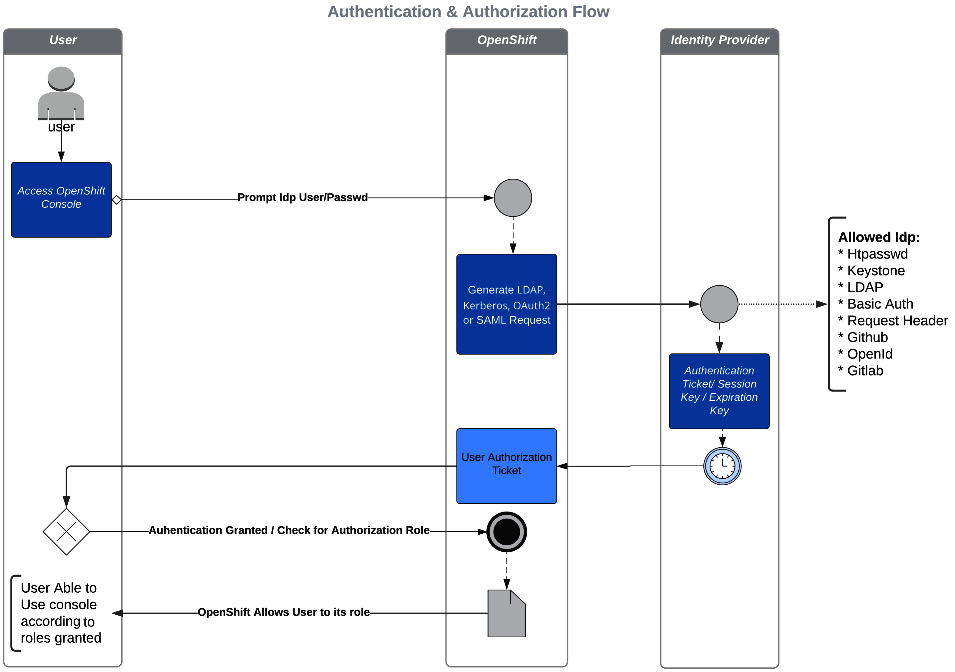
Figure 6.4 – Authentication and authorization flow
The IdP is responsible for notifying OpenShift if the username and password are valid and returning to OpenShift the success or failure authentication status. This process is known as authentication (AuthN in some literature).
We mentioned that the authentication process uses IdPs to validate the user against an authentication provider, but, more importantly, you need to understand how authorization (aka as AuthZ) occurs. Initially, a user on OpenShift doesn’t have any permissions in any project; however, they can log on. They will not have rights to perform any tasks except creating their own new projects if the cluster has the self-provisioner role enabled (self-provisioner is a role that allows any logged user to create their own projects). To add permissions to a user, it is necessary to inform the appropriate role. This can be accomplished through the inclusion of a user group or by directly assigning it to the user. This process of adding roles to users or groups is named RoleBindings.
To better understand which role best fits a user or group, consider looking at the default roles that already exist in an OpenShift cluster, as set out here:
- admin—This is a project admin. It allows changes with all project-scoped resources, including the ability to create RoleBindings using ClusterRoles. It does not allow the modification of quotas, limits, or cluster resources.
- edit—This is a project editor. It allows usage and manipulation of all project-scoped resources, but cannot change authorization objects.
- view—This is a project viewer. It allows the inspection of project-scoped resources and works like a read-only RoleBinding. Secrets inspections are not allowed.
- cluster-admin—This is the equivalent of a root user on a *nix-like OS. It allows total control of any resource in the entire cluster.
- cluster-reader—This is useful for allowing special users permissions, especially those that work with cluster monitoring. This RoleBinding is read-only and does not allow users to escalate or manipulate objects on the cluster.
You must also understand the scope of the RoleBinding, which can be one of the following:
- Local RoleBinding—Permissions that are given in a specific project; for example, adding the edit role to user X in project Z. Creating local RoleBindings is as simple as running the following command:
$ oc adm policy add-role-to-user <role> <user> -n <project>
- Cluster RoleBinding—Permissions that are given for the entire cluster; for example, adding the cluster-admin role to user X. To create a cluster RoleBinding, run the following command:
$ oc adm policy add-cluster-role-to-user <role> <user>
Similar commands can be applied to groups, just replacing user with group (for example, add-role-to-group and add-cluster-role-to-group). Similarly, to remove a role from a user or group, use remove-role-from-user/group, as in the following example:
$ oc adm policy remove-role-from-user <role> <user> -n <project>
$ oc adm policy remove-role-from-group <role> <group> -n <project>
$ oc adm policy remove-cluster-role-from-user <role> <user>
$ oc adm policy remove-cluster-role-from-group <role> <group>
These are some of the most popular default roles that are used with OpenShift, but you can create custom ones if needed. To create a custom role, you need to first understand what are verbs and resources, so here are definitions of these:
- A verb is an action the user runs against the OpenShift API—for instance, get, list, create, update, and so on.
- A resource is an entity in which the verb will be performed—for example, pod, deployment, service, secret, and so on.
That said, to define a custom role, you need to know which verbs for the user or group will be allowed to run over which objects. As soon as you have defined verbs and resources, a role can be created using the following command:
$ oc create role <role-name> --verb=<verbs-list> --resource=<resources-list>
Have a look at the following example:
$ oc create role sample --verb=get,list,watch --resource=pods,pods/status
There are more things about authentication and authorization with OpenShift that it's not our intention to bring to light here. We tried to highlight some of the important aspects you need to know about it, and we left a set of links in the Further reading section of this chapter if you want to go even deeper into this subject.
With that, we have demystified the authentication process a bit, and you can now perform the process of AuthN and AuthZ. The previous diagram showed a quick point of view about the steps of an authentication process. It is important to give proper permissions to each user or group, and—more importantly—to plan the roles you will need to have in place to give your users and groups the proper permissions to perform their job. In the following section, we will cover another important aspect that an OpenShift operator needs to know about: troubleshooting.
Troubleshooting reference guide – how to start
In this section, you will see some approaches to troubleshooting your OpenShift cluster if you face any issues. Due to the power of the oc command-line interface (CLI), you will have different ways to succeed in almost any troubleshooting scenario of your OpenShift cluster. Along with your training, you will gain the experience you need to take a step further in using and troubleshooting your OpenShift/Kubernetes cluster.
Describing objects
As we have mentioned, the oc CLI is a powerful tool to help OpenShift users to do a lot of operations and also do some troubleshooting. One of the first steps of troubleshooting is to get some details and descriptions of the objects. Suppose, for instance, you have an issue related to a pod that is not coming up, for some reason. Let’s start our troubleshooting by checking the pod details, as follows:
$ oc describe pod sso-10-qm2hc
Check the output in the Events section of the object to see what is preventing the pod from spinning up, as illustrated in the following code snippet:
Events:
  Type     Reason          Age                From               Message
  ----     ------          ----               ----               -------
  Normal   Scheduled       90s                default-scheduler  Successfully assigned rhsso/sso-10-qm2hc to ocp-hml4.hybridcloud.com
  Normal   AddedInterface  89s                multus             Add eth0 [10.242.22.12/23] from openshift-sdn
  Normal   Pulling         39s (x3 over 89s)  kubelet            Pulling image "image-registry.openshift-image-registry.svc:5000/rhsso/sso74-custom"
  Warning  Failed          33s (x3 over 83s)  kubelet            Failed to pull image "image-registry.openshift-image-registry.svc:5000/rhsso/sso74-custom": rpc error: code = Unknown desc = pinging container registry image-registry.openshift-image-registry.svc:5000: Get "https://image-registry.openshift-image-registry.svc:5000/v2/": dial tcp 10.244.109.169:5000: connect: no route to host
  Warning  Failed          33s (x3 over 83s)  kubelet            Error: ErrImagePull
  Normal   BackOff         8s (x4 over 83s)   kubelet            Back-off pulling image "image-registry.openshift-image-registry.svc:5000/rhsso/sso74-custom"
  Warning  Failed          8s (x4 over 83s)   kubelet            Error: ImagePullBackOff
In this case, you were able to see quickly in the oc describe command that the error is related to the connection between the node and the image registry (no route to host). You can act accordingly to fix the connectivity issue and get the pod up and running. You can also use the Events log to see other meaningful information, as you can see in the following section.
Events
Another parameter on the oc CLI that helps with problem investigation is the oc get events command. This is very useful for showing a log of tasks recently executed, along with presenting success or error messages. Events can be executed cluster-wide or project scoped. Check out the following sample of event logs:
$ oc get events -n openshift-image-registry
LAST SEEN   TYPE      REASON              OBJECT                                                  MESSAGE
35m         Normal    Scheduled           pod/cluster-image-registry-operator-7456697c64-88hxc    Successfully assigned openshift-image-registry/cluster-image-registry-operator-7456697c64-88hxc to ocp-master2.hybridcloud.com
35m         Normal    AddedInterface      pod/cluster-image-registry-operator-7456697c64-88hxc    Add eth0 [10.242.0.37/23] from openshift-sdn
35m         Normal    Pulled              pod/cluster-image-registry-operator-7456697c64-88hxc    Container image "quay.io/openshift-release-dev/ocp-v4.0-art-dev@sha256:6a78c524aab5bc95c671811b2c76d59a6c2d394c8f9ba3f2a92bc05a780c783a" already present on machine
(...omitted...)
If the pod is up and running but you still have some issues in an application, you can also use OpenShift to check the application logs, as you will see next.
Pod logs
Regularly, pod logs bring important information related to the scheduler, pod affinity/anti-affinity, container images, and persistent volumes. There are several ways to check the pod logs, as outlined here:
- The common way—inside the namespace—is shown here:
$ oc project mynamespace
$ oc logs mypod
- Here’s how to check them from any namespace:
$ oc –n mynamespace logs mypod
- Here’s how to check the logs of a specific container inside a pod:
$ oc -n mynamespace logs mypod -c kube_proxy
- You can also check the logs using the OpenShift console user interface (UI). To do so, access the Logs tab of the desired namespace and pod, as illustrated in the following screenshot:
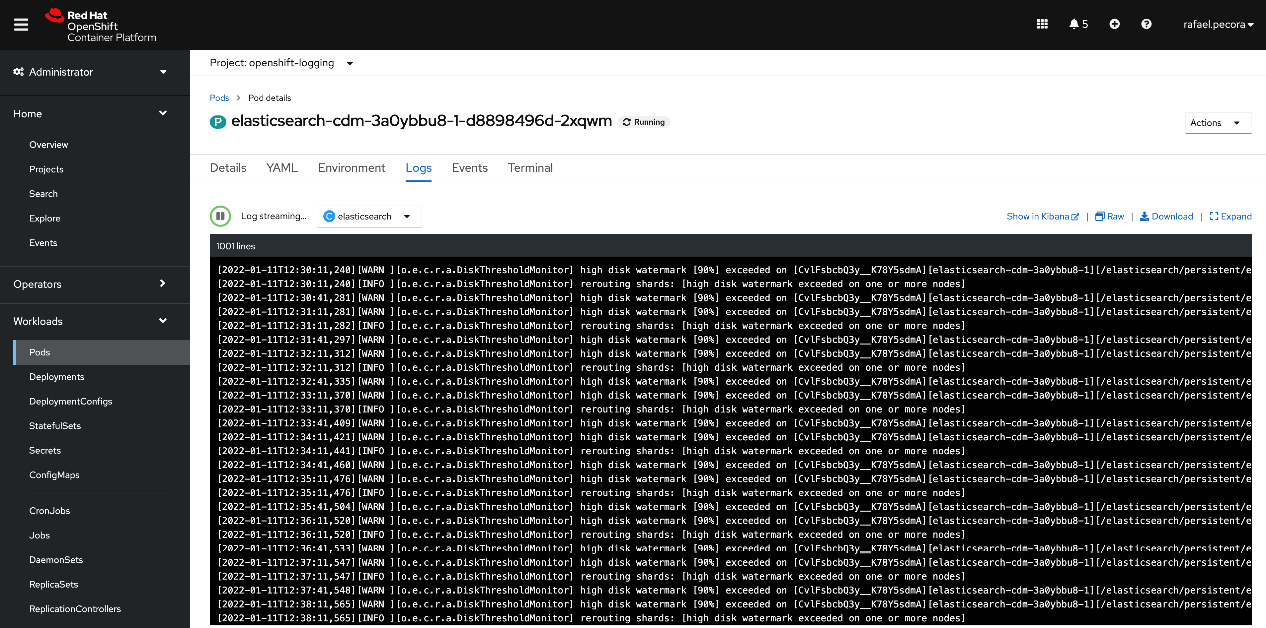
Figure 6.5 – Pod logs example (OpenShift console graphical UI (GUI))
You may also have issues during the application deployment. See next what you can check to find evidence of deployment problems.
Deployment logs
In some cases, a pod does not start and remains in a constant crashing state, which makes it difficult to get any logs. In such cases, you can check the deployment or deploymentconfig logs, which can help you to identify deployment misconfigurations.
Similar to pod logs, deployment logs are accessible by running the oc logs command. For deployment logs, run the following command:
$ oc –n mynamespace logs deployment/mydeploypods
For deploymentconfigs logs, use this one:
$ oc –n mynamespace logs dc/mydeploypods
Usually, you will not find the exact issue or the root cause and the solution to be applied, but it will give you a good indication of why it is failing—for example, dependent components that are missing in the solution, such as images not available; security context constraint with incorrect permissions; configmaps, secrets, and serviceaccounts missing; and so on.
Another useful way you may use to troubleshoot an issue is to use the debug command with temporary root privileges. Learn more on this in the following section.
Debugging pods
Another interesting tool to troubleshoot a pod that is constantly crashing can be used by executing the oc debug deployment or oc debug deploymentconfig command. Through this, you can instruct OpenShift to not fail and restart the pod as it crashes. The pod will still be alive, so you can check the logs, access it, and troubleshoot it from inside the container. To use the tool, run the following command:
$ oc debug deployment/<deployment-name>
Note
The oc debug command allows some interesting options, such as --as-user to run the pod with a defined user. To see a comprehensive list of allowed parameters and examples, run the oc debug -h command.
Operator logs
As we already covered in this book, OpenShift uses several operators to deploy and monitor critical features for the platform. That said, operators bring helpful logs to identify some configuration issues and instability with the platform. Those logs are stored in namespaces starting with the name openshift-*, which is a standard for most tools included with OpenShift.
The reason to maintain several operator pods as a part of project pods is related to some affinity/anti-affinity rules and taints/toleration strategies that a user can apply to the cluster. Operator pods are the watchdog to maintain namespaces’ health, watching the CRD, its standards, liveness, and readiness, and preventing OpenShift’s critical namespaces from suffering undesirable changes.
One of the main benefits of operators for the cluster’s stability is the ability to maintain the desired state of the operator namespace’s objects. In other words, if any unwanted changes are made by mistake directly into the namespace’s objects, they will be reverted by the operator itself. Every change in the operator’s objects needs to be done through the operator itself, by editing ConfigMaps or CR objects, according to the operator’s specification. That also means that any changes are checked and confirmed by operators before they are effectively applied.
To check the cluster operators’ functions, you must do the following:
- List the cluster operators, like so:
$ oc get co
- Describe the details of the cluster operator, as follows:
$ oc describe co <clusteroperatorName>
Here’s an example:
$ oc describe co storage
- Check the status output for error messages, if they exist, like so:
(...omitted...)
Status:
Conditions:
Last Transition Time: 2021-08-26T14:51:59Z
Message: All is well
Reason: AsExpected
Status: False
Type: Degraded
Last Transition Time: 2021-08-26T14:51:59Z
Message: All is well
Reason: AsExpected
Status: False
Type: Progressing
Last Transition Time: 2021-08-26T14:51:59Z
Message: DefaultStorageClassControllerAvailable: No default StorageClass for this platform
Reason: AsExpected
Status: True
Type: Available
Last Transition Time: 2021-08-26T14:52:00Z
Message: All is well
Reason: AsExpected
Status: True
Type: Upgradeable
(...ommitted...)
In the previous example, only a warning message about setting up a default storage class for a cluster is shown. No critical issues were found at storage. In case of any issue, look at the events and pod logs in the operator’s namespace.
Other oc CLI commands and options
The oc CLI has some other powerful commands for troubleshooting. Some useful and powerful commands for troubleshooting are listed here:
- Here’s an example command for high-verbosity logs:
$ oc –n <namespaceName> logs <podName> -v 8
- And here’s one for cluster events:
$ oc get events
- Here, you can see an example command for namespaced events:
$ oc –n <namespaceName> get events
- Here’s how to execute a single command inside the pod (double dash required):
$ oc exec mypod -- date
- Here’s how to execute a single command inside a pod in a specific container (double dash required):
$ oc exec mypod -c httpd-container -- date
- Create iterative commands spawning a pseudo-terminal, like so:
$ oc exec mypod -i -t -- ls -t /usr
- Similar to the exec command, rsh—shown here—opens a terminal inside the pod:
$ oc -n <namespaceName> rsh <podName>
All of the previous commands help you to identify problems in a cluster or even an application. Furthermore, you can investigate the node directly using the oc debug command, like so:
$ oc debug node/<nodeName>
The oc debug command gives you non-root privilege access, and you cannot run many OS commands without escalation. To do so, we recommend you run the chroot command, like so. After that, you can regularly use OS shell commands:
$ chroot /host /bin/bash
As you can see, OpenShift has a lot of useful debugging commands to help you identify cluster-wide or scoped issues. It is not recommended, but it is possible to also directly ssh on nodes. This kind of approach requires good knowledge of the Red Hat CoreOS OS, podman, and crio to avoid node disruption.
In any situation, we also recommend you open a support ticket with Red Hat, which will assist and give you the right guidance to solve your problem. The Red Hat support team often asks for the result of the must-gather command, which generates a temporary pod and concatenates meaningful logs and configurations that are useful for the Red Hat engineering team to analyze and correlate events and find the issue or root cause.
The most common way to run must-gather is shown here:
$ oc adm must-gather --dest-dir=/local/directory
This will create a tar file under the chosen directory with all logs collected, which can be very useful to identify problems. We suggest you always run this command and upload it when you are opening the support ticket to speed up the process of analyzing the issue.
In this section, you saw different debug approaches that will certainly help you in everyday life. In the next section, you will see the most common error messages that occur at pod startup, and in this way, you will be able to draw your own line of reasoning that will help you in the problem solution.
Understanding misleading error messages
Even if you have learned the different ways to identify a problem, it is not unusual that the error shown does not provide enough information to help you to detect the issue and fix it. Having that in mind, we decided to highlight some very common error messages in this section and also some suggestions to solve the problem.
ImagePullBackOff
This is a common error related to a missing container image. Check out the following lines of code to become familiarized with this kind of issue when you face it:
NAMESPACE   NAME READY STATUS RESTARTS AGE
namespace1  backend-tfmqm 0/1 ImagePullBackOff 0 17h
Here’s a message that may come up when investigating the pod log:
$ oc -n namespace1 logs backend-tfmqm
Error from server (BadRequest): container " backend" in pod " backend-tfmqm" is waiting to start: trying and failing to pull image
Looking at the error message, it is typically linked to the absence of the image in the registry. This can occur due to some problems, such as the image and its tags not being available in the registry, or incorrect pointing in the deployment/deployment config. Another correlation would be the node where the pod is running is not able to reach the image registry.
CrashLoopBackOff
This is an error that requires some knowledge before acting on solving it effectively. It occurs because the application crashes constantly, so the root cause issue can be due to several different reasons. You can see an example of this here:
NAMESPACE NAME READY STATUS RESTARTS AGE
3scale backend-redis-1-9qs2q 0/1 CrashLoopBackOff 211 17h
Here’s a message you may see when investigating the pod log:
$ oc logs backend-redis-1-9qs2q
1:M 11 Jan 13:02:19.042 # Bad file format reading the append only file: make a backup of your AOF file, then use ./redis-check-aof --fix <filename>
The log usually gives you some hints about the issue’s root cause, but it can also be a trap to conduct you to a wrong conclusion. It is important to take into account when a pod has a persistent volume or it has a precedence order that depends on another application to start first and prepare a persistent volume, as well as many other different scenarios that can lead to this error.
Init:0/1
When you get an Init:0/1 error message, it typically means the pod is waiting for another pod or a condition that hasn’t been satisfied yet. The following lines of code demonstrate what kinds of conditions can result from this message and how to solve this:
NAMESPACE NAME READY STATUS RESTARTS AGE
3scale backend-cron-1-zmnpj 0/1 Init:0/1 0 17h
Here’s a message you may see when investigating the pod log:
$ oc logs backend-cron-1-zmnpj
Error from server (BadRequest): container "backend-cron" in pod "backend-cron-1-zmnpj" is waiting to start: PodInitializing
This, perhaps, can be a confusing status when you are troubleshooting error messages. Certainly, it can be anything wrong in the namespace, so the error message only shows PodInitializing. You could interpret it as a condition when a pod is waiting to start; meanwhile, this message means that a condition isn’t satisfied.
To help you, we have listed here some items that must be checked that may be preventing the pod from starting:
- Check whether the service account used in the pod exists in the namespace, as some containers need a specific service account name and policy applied to start.
- Check the security context constraints (SCCs) and make sure that these are properly set according to the required permissions for the pod.
- Check other containers and pods in the namespace: depending on the build strategy, it is possible to define pod dependencies.
If you are not familiar with SCC yet, don’t freak out. We will be covering it in depth in Chapter 8, OpenShift Security.
Summary
In this chapter, we focused on important components of OpenShift, such as operators and their role in maintaining the resilience of a cluster, and we also talked about situations that can cause damage to the cluster.
We have dived into the heart of OpenShift, which is its distributed database (known as etcd), understanding its importance in the cluster and how to prepare it to receive a high volume of traffic, as well as verifying its sizing and performance, and understanding how to perform troubleshooting in some cases.
We have also discussed a bit about the AuthN and AuthZ process, so you now know the power and flexibility of the Openshift IDPs. We finally have seen some important troubleshooting tips and tools that will certainly help you in your daily job, operating OpenShift clusters and applications.
In the next chapter, we will present some other important information about the network on OpenShift. We will discuss and give examples to understand the main differences between a pod network and a service network, as well as understand the difference between North-South and East-West traffic. Keep up with us in this interesting reading and learn more in Chapter 7, OpenShift Network.
Further reading
If you want to look at more information on what we covered in this chapter, check out the following references:
- Red Hat Knowledgebase—etcd recommendation: https://access.redhat.com/solutions/4770281
- etcd quorum model: https://etcd.io/docs/v3.5/faq/
- Understanding etcd quorum: http://thesecretlivesofdata.com/raft/
- etcd hardware sizing recommendations: https://etcd.io/docs/v3.5/op-guide/hardware/
- etcd tuning options: https://etcd.io/docs/v3.5/tuning/
- etcd benchmarking thresholds: https://etcd.io/docs/v3.5/benchmarks/
- etcd benchmark CLI tool: https://etcd.io/docs/v3.5/op-guide/performance/#benchmarks
- Kubernetes authentication flow: https://kubernetes.io/docs/reference/access-authn-authz/authentication/
- Openshift IDPs: https://docs.openshift.com/container-platform/4.7/authentication/understanding-identity-provider.html
- Learn more about SCCs: https://docs.openshift.com/container-platform/4.8/authentication/managing-security-context-constraints.html
- More information about troubleshooting: https://docs.openshift.com/container-platform/4.7/support/troubleshooting/investigating-pod-issues.html
- Recommended etcd practices: https://docs.openshift.com/container-platform/4.10/scalability_and_performance/recommended-host-practices.html#recommended-etcd-practices_recommended-host-practices
- How to calculate IOPS in a storage array (blog article): https://www.techrepublic.com/article/calculate-iops-in-a-storage-array/