
This appendix provides the essential menu steps necessary to generate a desired result with JMP. JMP launch windows require that you specify the right data and modeling types in order to generate a desired result. Should you have questions about modeling types or the options displayed in the windows, refer to Chapter 2.
Some launch windows contain options (for example, Fit Model) that should be selected in the Launch dialog window before you execute your results. More often however, you will find that desired results require a secondary step after you have generated some results. A semicolon (;) indicates that there is a secondary step in the process that occurs only after you have executed some base results. The > symbols indicate a selection is required from a hotspot (or red triangle) drop-down menu that appears in the base results.
There is often more than one way to complete a task (for example, Fit Y by X and Fit Model); we have used the most direct means to achieve them here.
Some of the tasks included in this section are not covered in the book, but you can reference these tools in the JMP built-in documentation at Help JMP Documentation Library and using the search within the PDF file.
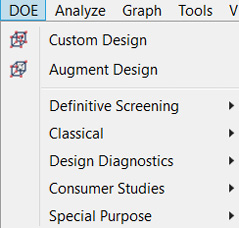
Figure C.1 JMP Menus
|
|
|
|
|
|


|
Task |
Menu Selection |
|
Adding Labels |
Click on column heading; Cols Label/Unlabel |
|
ANOVA, One Way |
Analyze Fit Y by X; Means/Anova |
|
ANOVA, two or more factors |
Analyze Fit Model |
|
Bar Chart |
Graph Graph Builder |
|
Basic Charts |
Graph Graph Builder |
|
Bivariate |
Analyze Fit Y by X |
|
Box Plots, one level |
Analyze Distribution; Outlier Box Plot |
|
Box Plot, two or more levels |
Analyze Fit Y by X; Display Options Box Plot |
|
Bubble Plot |
Graph Bubble Plot |
|
C-Chart |
Analyze Quality and Process Control Chart |
|
Chi-Square test |
Analyze Fit Y by X |
|
Color or Mark by |
Rows Color or Mark by Column |
|
Column Info Dialog |
Click on column heading; Cols Column Info |
|
Concatenate |
Tables Concatenate |
|
Contingency Platform |
Analyze Fit Y by X |
|
Control Charts |
Analyze Quality and Process Control Chart Builder |
|
Correlation |
Analyze Multivariate Methods Multivariate |
|
Covariance |
Analyze Multivariate Methods Multivariate ; |
|
CUSUM |
Analyze Quality and Process Control Chart |
|
Data Filter, Global |
Rows Data Filter |
|
Data Filter, Local |
In a results window; Local Data Filter |
|
Data Mining |
See Partition, Neural Network, or Text Mining |
|
Density Ellipses, Bivariate |
Analyze Fit Y by X; Density Ellipse |
|
Density Ellipses, |
Graph Scatterplot Matrix; Density Ellipses |
|
Descriptive Statistics |
Analyze Distribution; (under Summary Statistics) |
|
Design of Experiments |
DOE |
|
Distribution, Univariate |
Analyze Distribution |
|
Distribution Fitting |
Analyze Distribution; Continuous Fit > |
|
Dot Plot |
Analyze Graph Builder; change the Jitter setting |
|
Excel Files, to open |
File Open Specify Excel file format |
|
Experimental Design |
See Design of Experiments |
|
Exponential Smoothing |
Analyze Specialized Modeling Time Series; |
|
Fit Line |
Analyze Fit Y by X; Fit Line |
|
Fit Polynomial |
Analyze Fit Y by X; Fit Polynomial specify degree |
|
Fit Y by X Platform |
Analyze Fit Y by X |
|
Forecasting/Time Series |
Analyze Specialized Modeling Time Series |
|
Formula Editor |
Click on column heading; Cols Formula |
|
Frequency Distribution |
Analyze Distribution |
|
Full Factorial Design |
DOE Classical Full Factorial Design |
|
Gauge Chart |
Analyze Quality and Process |
|
Goodness of Fit |
Analyze Distribution; Continuous Fit Normal; |
|
Graphs, Graph Builder |
Graph Graph Builder |
|
Graphs, Control Chart |
Analyze Quality and Process Control Chart Builder |
|
Graphs, Bubble Plot |
Graph Bubble Plot |
|
Graphs, Scatterplot |
Graph Graph Builder |
|
Graph Builder Platform |
Graph Graph Builder |
|
Histograms |
Analyze Distribution |
|
Histogram Color |
Right-click on histogram Histogram Color |
|
Holt-Winters |
Analyze Specialized Modeling Time Series; |
|
Horizontal Bar Chart |
Analyze Distribution; Display Options |
|
IR Chart |
Analyze > Quality and Process > Control Chart |
|
Joining data tables |
Tables Join |
|
Kruskal-Wallis Test |
Analyze Fit Y by X; Nonparametric |
|
Least Squares Regression |
See Regression, Simple or Multiple |
|
Line Chart |
Graph Graph Builder; choose the Line icon |
|
Logistic Regression |
See Regression, Logistic |
|
Mapping data |
Graph Graph Builder; drag shape column |
|
Mosaic Plot |
Analyze Distribution; Mosaic Plot |
|
Mosaic Plot with two |
Analyze Fit Y by X |
|
Moving Averages |
Analyze Specialized Modeling Time Series; |
|
Moving Average Control Chart |
Analyze Quality and Process Control Chart |
|
Moving Range Chart |
Analyze Quality and Process Control Chart |
|
Multiple Comparisons |
Analyze Fit Y by X; Compare Means |
|
Multiple Regression |
See Regression, Multiple |
|
Multivariate Platform |
Analyze Multivariate Methods |
|
Neural Network |
Analyze Predictive Modeling Neural |
|
Oneway ANOVA |
Analyze Fit Y by X ; Means/Anova/Pooled t |
|
Outlier Box Plot |
See Box Plot |
|
Overlay Plot |
Graph Graph Builder |
|
P Chart |
Analyze Quality and Process Control Chart |
|
Parallel Plot |
Graph Parallel Plot |
|
Pareto Diagram |
Analyze Quality and Process Pareto Plot |
|
Partition |
Analyze Predictive Modeling Partition |
|
Phase Chart |
Analyze Quality and Process Control Chart |
|
Pie Chart |
Graph Graph Builder; choose the pie icon |
|
Pivot-Table |
See Tabulate |
|
Point Chart |
Graph Graph Builder |
|
Power Calculations |
DOE Design Diagnostics Sample Size and Power |
|
Prediction Profiler |
Analyze Fit Model ; Factor Profiling > Profiler |
|
Predictive Modeling |
See Partition, Profiler, Regression |
|
Profiler |
See Prediction Profiler |
|
Process Control |
See Control Charts |
|
Query Builder |
File Database Query Builder |
|
R Chart |
Analyze Quality and Process Control Chart |
|
Recursive Partitioning |
See Partition |
|
Regression, Logistic |
Analyze Fit Y by X or Analyze Fit Model |
|
Regression, Multiple |
Analyze Fit Model |
|
Regression, Simple with |
Analyze Fit Y by X; Fit Line |
|
Regression, Simple with |
Analyze Fit Y by X; Fit Polynomial |
|
Regression Trees |
See Partition |
|
Residual Analysis |
Analyze Fit Model; Row Diagnostics |
|
Response Surface Design |
DOE Classical Response Surface Design |
|
Run Charts |
Analyze Quality and Process Control Chart |
|
S Chart |
Analyze Quality and Process Control Chart Builder; |
|
Sample Data |
Help Sample Data |
|
Scatterplot |
Analyze Fit Y by X |
|
Scatterplot, 3D |
Graph Scatterplot 3D |
|
Scatterplot Matrix |
Graph Scatterplot Matrix |
|
Scatterplot with Line |
Analyze Fit Y by X; Fit Line |
|
Scatterplot with |
Analyze Fit Y by X; Fit Polynomial |
|
Screening Design |
DOE Classical Screening Design |
|
Simple Regression |
See Regression, Simple |
|
Sort |
Tables Sort |
|
Spearman’s Rho |
Analyze Distribution; Stem and Leaf |
|
Stepwise Regression |
Analyze Fit Model; Stepwise |
|
Subset |
Tables Subset |
|
Summary |
Tables Summary |
|
Summary Statistics |
Analyze Distribution |
|
t- or z-test, one sample |
Analyze Distribution; Test Mean |
|
t- or z-test, two sample |
Analyze Fit Y by X; t Test |
|
Tables, Concatenate |
Tables Concatenate |
|
Tables, Join |
Tables Join |
|
Tables, Sort |
Tables Sort |
|
Tables, Subset |
Tables Subset |
|
Tabulate Platform |
Analyze Tabulate |
|
Test for Equal/Unequal |
Analyze Fit Y by X ; Unequal Variances |
|
Test for Proportions, |
Analyze Distribution; Test Probabilities |
|
Test for Proportions, |
Analyze Fit Y by X |
|
Test for Normality |
Analyze > Distribution; Continuous Fit Normal; |
|
Text Mining |
Analyze Text Explorer |
|
Time Series Plot |
Analyze Modeling Time Series |
|
Tree Map |
Graph Graph Builder; click on Treemap icon |
|
Two or more factor ANOVA |
Analyze Fit Model |
|
Tukey Box Plot |
See Box Plot |
|
U Chart |
Analyze Quality and Process Control Chart |
|
Univariate/Distribution |
Analyze Distribution |
|
Variability Chart |
Analyze Quality and Process Variability/Gauge Chart |
|
Wilcoxon Rank Sum Test |
Analyze Fit Y by X; Nonparametric Wilcoxon Test |
|
Wilcoxon Signed Rank Test |
Analyze Distribution; Test Mean (check Wilcoxon |
|
Word Cloud |
Analyze Text Explorer; Display Options Show |
|
XBar Chart |
Analyze Quality and Process Control Chart |