Chapter 12
Evaluating Results
This chapter
![]() briefly reviews the rationale for evaluating the impact of your performance improvement projects on organizational results
briefly reviews the rationale for evaluating the impact of your performance improvement projects on organizational results
![]() describes two methods for demonstrating results to clients and senior management.
describes two methods for demonstrating results to clients and senior management.
Tools in this chapter include
![]() a procedure for demonstrating performance improvement ROI in “soft,” or not readily quantifiable, performance areas
a procedure for demonstrating performance improvement ROI in “soft,” or not readily quantifiable, performance areas
![]() a method for demonstrating impact credibly through journaling and surveys.
a method for demonstrating impact credibly through journaling and surveys.
Rationale for Evaluating Project Impact
Two recent reports from ASTD presented results that troubled us deeply. Yes, we already knew what the reports revealed, but it still hurt to see the information in print. The first publication was the State of the Industry Report 2005 (Sugrue and Rivera, 2005) that again confirmed how few organizations (approximately 2 percent) systematically verify the impact and/or ROI of their learning and performance support efforts. The second report (O’Driscoll, Sugrue, and Vona, 2005) was an in-depth study of CEOs', CFOs', and other “C”-level managers' perceptions about learning and performance support activities in their organizations. The good news is that high-level managers generally are pleased with what is being done and they value WLP activities. The bad news is that they are not looking for ROI reports from their training or WLP departments. Why not? They're not convinced that such evaluations can be done well and they don't believe the effort is worth the cost.
That second report almost hurts more than the first. These same senior respondents would never accept other departments, such as engineering, operations, or information technology, not providing a business case for proposed expenditures and projected ROI as well as follow-up reports on bottom-line results. Not expecting this from training/WLP has two serious negative consequences:
- It generates a lack of respect for what we do. Without demonstrable, meaningful results that link to the bottom line, we take a back seat to the big players—those who can show value for dollar. We take on the role of support personnel—helpful but not to be counted on to make “real” differences.
- It leaves us vulnerable when the crunch comes. Organizations hold on as long as possible to those groups or individuals who make a critical contribution to survival. Without data on impact, we're not on the essential-players list. In recent years we've seen two giant corporations shed thousands of employees. The axe fell with disproportionate weight on the workforce learning and performance support teams.
Our position in the face of this is simple. We must demonstrate bottom-line results and significant, meaningful ROI for our activities. Whether it is asked for by senior decision makers or not, we cannot escape this duty. We are only seen to be as valuable as the results we produce.
ROI—To Be or Not to Be

In Training Ain't Performance(chapter 10), we made the following two assertions:
- You're in competition. Money in organizations is scarce and growing more so as global competition forces everyone to become leaner and, unfortunately, meaner. With this has come a widening demand to demonstrate the worth of performance interventions and the return-on-investment in learning and performance.
- The purpose of calculating worth and ROI is to help clients, decision makers, and stakeholders decide on whether to fund your performance improvement recommendations. Worth and ROI are financial concepts, so calculate these only when you can boil down performance outcomes (valued accomplishments) to economic terms.
In the first statement, the widening demand derives from the competitive forces we face. Asked for or not, the demand is there and growing. In the second statement, the troublesome part is in making calculations only when you can boil down performance outcomes to economic terms. How do we deal with the need to write better proposals, improve presentation skills, or develop leadership in senior managers? How do we “boil down” these sorts of demands to “economic terms” and demonstrate ROI? These are important questions, so let's attack them.
Boiling Down Performance Improvements to Economic Terms
We can divide desired performance improvements or changes into three basic categories: (1) those with clearly identifiable economic outcomes, (2) those that require conversion and manipulation to identify economic outcomes, and (3) those for which economic outcomes are almost impossible to discern directly. Examine the following list. Check the 1 beside easy-to-identify economic outcomes items, check the 2 beside those that require more effort, and check the 3 beside those improvements for which it would be difficult to measure direct economic outcomes.

Here are our answers (although we admit that arguments can be made for different answers, depending on context):
| Category 1: | A, B, D, J | All four have easily defined values attached to them and can be connected to dollars relatively quickly. |
| Category 2: | C, F | By comparing the success rate of “quality proposals” with those considered poorly written, you can establish an average value for high-quality proposals. This can be converted to dollars. Similarly, by comparing time and cost losses for poorly managed projects (for example, cost of time, over-budget costs, lost sales due to project delays) with well-run ones, you can calculate value. |
| Category 3: | E, G, H, I | These are all more nebulous. We suspect that a thorough front-end analysis would eliminate some of these. If they are indicated, however, we recommend a different evaluation/measurement approach to calculating ROI—an approach that we'll describe later in the Fieldbook. |
For Category 1 items, chapter 10 in Training Ain't Performance provides plenty of guidance and tools. So here we'll turn directly to Category 2 items.
Calculating ROI in the Soft Skills Domain
There are books recommending various methods for calculating ROI, and we've listed several in the Additional Resources at the back of this volume. Here we present a method that has been demonstrated to work. It was developed by Schneider and Wright (1990). We've modified their approach somewhat. These are the steps you will follow in applying it:
Step 1. Determine what percentage of the performer's time is spent on performing the targeted task. Have several performers maintain a journal for one to two weeks at random time periods. Analyze the listed tasks to calculate time spent and percentage of total work done. An alternative method is to conduct a job analysis, list all job tasks, and have random samples of performers identify tasks performed each day and the amount of time spent on each. The simplest (but least accurate) way is to bring together a focus group of performers to estimate approximate time spent, and then convert their estimates to percentages of work time. As we move through the steps here, we'll illustrate with an example based on the journaling method.
Example: Making Effective Presentations
Six managers of the 1,150 in the company kept journals of their activities for two weeks. Analysis of the journals showed that an average of 8 percent of their time was spent making presentations (range 5 to 12 percent).
Step 2. Develop criteria for assessing desired performance. These criteria are generally quality, quantity, time, and cost, but other specific criteria may be included. In a typical situation, five to seven criteria are sufficient.
Example: Making Effective Presentations
Together, a team of four senior managers, three acknowledged company top presenters, and a consultant met to establish six criteria for what constitutes a “winning presentation”—one that achieves its goals and advances the company.
Step 3. Establish a baseline of current performance. This is done through either surveys, observation, examination of random samples, or 360-degree assessment techniques.
Example: Making Effective Presentations
To assess current presentation quality levels, an evaluation instrument based on the criteria established by the team of senior managers, top presenters, and the consultant (with a 10-point scale for each criterion) was created. Participants at all presentations in the company were handed evaluation sheets for each presentation and asked to rate the presentations. The sheets were collected, scored, analyzed, and converted to percentages. The baseline mean was 58 percent, with a range of 12 to 98 percent.
Step 4. Based on the recommended interventions derived from the front-end analysis, implement these interventions to improve or attain desired performance from targeted performers.
Example: Making Effective Presentations
The front-end analysis produced the following recommended interventions: individual assessment; training; job aid templates to design effective presentations; standards, self-evaluation, and peer evaluation; instruments; and video practice sessions with feedback. All managers went through the assessment, received opportunities for training and coaching, produced presentations, practiced with peers and coaches, were videotaped, and received both oral and written structured feedback using feedback forms.
Step 5. After a suitable time period has elapsed following intervention implementation, again collect performance data using the same methods you used in Step 3 when you established your baseline.
Example: Making Effective Presentations
With the same six-criteria evaluation instrument used for collecting baseline data, participants in all company presentations were given evaluation sheets and asked to rate each presentation as before. The sheets were collected, scored, analyzed, and converted to percentages. This time the post-intervention mean score was 82 percent, with a range of 52 to 100 percent.
Step 6. Calculate the difference between the baseline and the post-intervention means. Multiply the difference by the percentage of total performer work represented by the activity. Multiply the result by the average performer's annual salary. This represents the average monetary or value improvement obtained for each performer. Multiply the individual improvement figure by the number of performers to obtain the total estimated performance improvement (value) in dollars (estimated because you are dealing with averages).
Example: Making Effective Presentations
The difference between the pre- and post-intervention means was 0.58 to 0.82—or 0.24. Because making presentations constitutes, on average, 8 percent of managers' jobs, 0.24 × 0.08 = 0.0192. The average manager salary is $85,000 annually. By multiplying 0.0192 × $85,000, we discover that the value of the improved manager presentation performance = $1,632 per manager. For 1,150 managers, this represents an overall value to the company of $1,876,800 per year. Most impressive!
Now for some comments. First, we don't know what the true impact of better presentations is in our example. If the result is improved sales, better worker performance, or reduced turnover, the value could and most probably would be much greater. This approach is absolutely the most conservative form of value estimation. Nonetheless, $1,876,800 per year is not bad.
A second point is that in the “soft skills” areas, such as making presentations or conducting performance approvals, the impact tends to have a relatively long life. Think about this. If you gave poor presentations and then improved as a result of assessment, training, coaching, practice, and structured feedback, you would probably continue at the improved level for a long time. In this example let's assume that, with turnover and changes, the impact lasts for a conservatively estimated three years. The value over three years now becomes $5,630,400 (3 × $1,876,800) just based on managers' salaries.
Point number three is that with the value calculated, you can easily calculate worth and ROI just as described in chapter 10 of Training Ain't Performance. For illustrative purposes, we'll assume that each manager received an average of two days worth of training, coaching, and practice with feedback. Because we're dealing with base salaries, we only calculate the cost of two base salary days per manager as a start. We divide $85,000 by the number of true annual working days (for example, 230): $85,000 ÷ 230 = $370 per manager workday. Let's also say that the total program cost was $195,000. This includes training and coaching, design, instructors, facilities, equipment, materials, and administrative costs. In the following box are all the ROI calculations:

This is a great return on investment!
If you would like to demonstrate how quickly you pay back the entire investment, here is the calculation:

A fourth point deals with another interesting and highly useful number—the standard deviation(SD)1. We won't go into a discussion of statistics, but here is what the SD can do for you. When you establish your baseline of performance, you can ask that the mean and the SD be calculated. A great many software packages do this for you automatically. Calculate the mean and SD following the performance intervention too. The SD shows how spread out from the mean all the individual scores are. Let's return to our example of making effective presentations. Suppose what you found was this:
Scores on Making Effective Presentations
| Mean | SD | |
| Before the performance improvement intervention After the performance improvement intervention |
58 82 |
19.3 10.2 |
What this tells you is that two-thirds of your managers scored between roughly 39 percent and 77 percent before your performance interventions, and two-thirds scored between approximately 72 percent and 92 percent following intervention. (The percentage of managers who fall ±1 SD from the mean is always two-thirds. This statistical constant never varies because you essentially are dealing with one group divided into three equal portions—those who are below, at, and above the mean.) Not only is the mean after your performance improvement venture dramatically higher, but there also is much greater consistency now in the way your managers perform. They're making better presentations more consistently! You and your client should break out the champagne.
A Note of Caution
All of the preceding discussion concerning Category 2 performance improvement projects is simply an attempt to demonstrate ROI. It is founded on several assumptions:
![]() The estimate of percentage of work time is accurate.
The estimate of percentage of work time is accurate.
![]() The assessment of performers is accurate.
The assessment of performers is accurate.
![]() The dollar amount attributed to the activity derived from performer salaries and percentage of total work is meaningful.
The dollar amount attributed to the activity derived from performer salaries and percentage of total work is meaningful.
The more solid the basis for these assumptions, the more credible the results. It is essential that you do your homework to ensure the highest level of credibility in each case.
It's important to remember that there are secondary benefits derived from improved soft skills—and these benefits aren't included in the calculations discussed above. We should expect better presentations to generate a number of benefits that affect the bottom line (benefits such as greater sales, more informed workers, a clearer sense of project goals and progress that reduces time to completion). Defining the bottom-line value of these secondary benefits requires going after the performers and tracking examples of these benefits. They all are grist for your ROI mill.
The Highly Intangibles—What to Do?
We are now going to address those performance improvement goals for which calculating ROI seems at first glance to be almost impossible. Examples: improve leadership skills, improve telephone etiquette. What do we do with these?
We begin with a disclaimer. In our experience these performance improvement projects generally emerge from the “wise” heads of decision makers. They're based on the latest miracle cure (like empowerment, management-by-walking-around, you-can-negotiate-anything, or reengineering). We have a list of approximately 100 of these great big ideas. All of them have kernels of usefulness but, like the cabbage diet, they are rarely sensitive to the whole array of factors affecting performance (or weight and fitness). Often, reports of something that worked elsewhere triggers enthusiasm to apply it here. Benchmark studies, books, and keynote speeches all generate sudden activity. The dollars mysteriously appear, and the race is on.
A “bad experience” suffered by a senior decision maker is another catalyst for a performance improvement project. If a bank's executive VP makes a call that's poorly handled by a branch clerk, it can launch a corporate-wide venture on improving telephone etiquette. If the CEO makes a purchase that goes awry at one of the company retail stores, the 450 stores in the chain can be plunged into a “stellar customer service” program.
Please forgive our cynicism here, but sadly we've seen many important performance issues set aside in pursuit of what we considered to be wasteful adventures. Our comments aside, here is what we can do to demonstrate ROI when our front-end analyses (or pressures) lead us into less directly measurable types of projects.
The Journal Method
This method works well for most Category 3-type projects. It's simple in strategy but difficult in execution. If done correctly and well, however, the results are highly credible for two reasons. First, journaling provides first-hand quantitative data. Second, journaling often provides anecdotes that bring to life the results of your interventions. Here's how this works.
Step 1. As part of the implementation plan for your basket of interventions, you develop clear instructions on tracking results. You also designate a person (and here is where university interns from local learning and performance programs are extremely helpful) to monitor journaled results on a weekly basis.
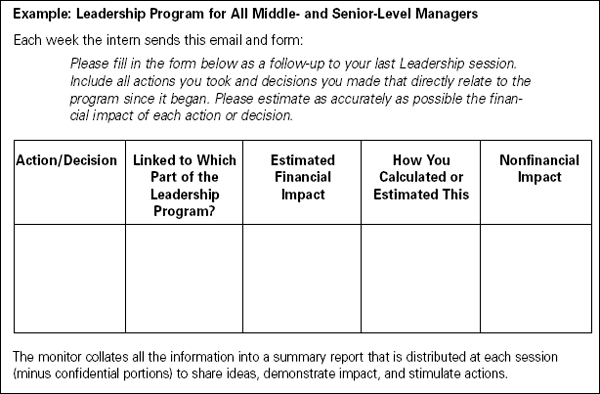
Example: Leadership Program for All Middle- and Senior-Level Managers
Your company has conducted a form of “needs analysis” and determined that there is a leadership gap. The result of this gap is that decisions either are not made or take too long, opportunities are wasted, timidity causes inefficiencies, talent is lost, and many other negative things occur. Charged with developing a six-month-long leadership program, your client turns to you for assistance. You analyze the situation, and then design and develop the program. In the process you build in a journaling and monitoring system. You assign an intern to gather data each week from the 70 participants in the program. Participants meet once every three weeks for four hours. They leave each session with tasks to perform, a mini action plan, and a journal. They are told that they will be contacted each week by email and asked to report on actions they took or decisions they made as a result of the program. They also will be asked to calculate the value of each action or decision to the company.
Step 2. When this project is set in motion, participants track their activities and decisions that are directly linked to the program. The monitor sends a weekly email and follows up to ensure all participants respond. The monitor collects the journaled information in a summary report, some of which (the nonconfidential portions) are released to participants as the program continues.
Step 3. At the conclusion of the program, journaling with ongoing data collection may continue for a specified period. At a predetermined time, a final report containing the recorded financial and nonfinancial impact of the performance improvement program is released, along with an estimated ROI calculation.
Example: Leadership Program for All Middle- and Senior-Level Managers
The program continues for six months. It includes clear definitions of what “leadership” is and what is expected of managers as leaders. It provides training, job aids, processes, benchmark practices, work assignments, data collection and reporting, visits to other organizations, expert guidance, reading, and other elements. At the conclusion, journaling and monitoring continue on a monthly basis for three months. The performance improvement team produces a report on what resulted from the program. The report provides data derived from participants as well as other sources (such as sales figures, wastage reports, costs, market penetration progress reports, turnover figures). Most important, it gives financial and nonfinancial results, complete with ROI. The estimated ROI shows that for the $950,000 spent on the program (including participant time off the job minus the fully loaded cost of $280,000), the estimated value of financial impact is close to $130,000,000 to date. The estimated financial ROI [ROI = (V - C / C) × 100] is 1,268 percent. Whether or not this is completely accurate, the ROI is very obviously high and supported by participant explanations of calculations. And then there are the nonfinancial benefits reported….
As we mentioned, the strategy is relatively simple but the execution is tedious and demanding. Nevertheless, this is an extremely worthwhile venture that you and your WLP team should consider applying to a strategic performance improvement program.
On a methodological note, it is not necessary to gather data from all performers, especially when they are numerous. You can select a random sample of 20 performers (but the sample must be truly random), and focus on data collection from those 20. Then, with suitable modesty, generalize to the entire population. This is much more workable, but does diminish somewhat the drama and, unfortunately, the credibility, despite its likely relative accuracy.

An Activity for You
As we noted earlier, demonstrating a positive effect on the bottom line is the most useful means for furthering the WLP cause and building both credibility and support for your organization. According to the ASTD State of the Industry Report (Sugrue & Rivera, 2005), only 3.2 percent of organizations offer their management and clients projected ROI (business cases) and even fewer—2.1 percent—calculate actual ROI. This is both a sad statement about WLP practice and a clarion call to you to be among the best through your performance improvement professionalism.
Examine your upcoming projects. Select one that offers potential for calculating both projected and actual ROI. It can be in any of the three categories described in this chapter, but if this is your first attempt, remember that Category 1 projects offer the most solid numbers. Look for a supportive client, and explain why you are doing this. Demonstrate benefits. Then go for it. Consult Training Ain't Performance for job aids you can use to calculate costs, value, worth, ROI, and payback period.

An Activity for Your WLP Team
When you have identified a project for which you will track costs and calculate value and ROI, share this with your WLP team. Gather suggestions and insights from them. If possible, sign up recruits to assist you in your efforts. Keep the team informed as you progress. Encourage similar ventures from your colleagues.
Chapter Summary
This chapter led you more deeply into ROI country than did Training Ain't Performance. The approach was to share alternative means for calculating ROI. In the soft or less tangible areas, estimates and self-reports are, unfortunately, the realities with which we must deal. Although that makes our results less than perfect, those results still indicate important contributions to the organizational bottom line. Please bear in mind that many other seemingly hardline groups face the same barriers: marketing, advertising, operations, sales, and information technology all build business cases on assumptions and best estimates. Even after a project is completed, their reports include the data they are able to assemble. For example, there are few highly positive ROI reports on Enterprise Resource Planning (ERP) software implementations into which many large corporations have poured many millions of dollars. We often read in the press about seemingly wondrous ROIs projected for corporate acquisitions and mergers (apparently concluded on the basis of expert financial advice and calculations) that turn out not to be so brilliant—or accurate. We contend that our performance improvement efforts and contributions can be far more accurately demonstrated than many other groups with longer records of doing it. We encourage you to try it. You simply will be amazed!
This chapter
![]() began with a rationale for evaluating the impact of your performance improvement efforts—to demonstrate results and contributions to organizational success.
began with a rationale for evaluating the impact of your performance improvement efforts—to demonstrate results and contributions to organizational success.
![]() described two methods for demonstrating ROI beyond those presented in chapter 10 of Training Ain't Performance.
described two methods for demonstrating ROI beyond those presented in chapter 10 of Training Ain't Performance.
![]() gave you procedures and examples of those two methods.
gave you procedures and examples of those two methods.
![]() encouraged you to integrate ROI calculations into one of your projects and share progress and results with your WLP team.
encouraged you to integrate ROI calculations into one of your projects and share progress and results with your WLP team.
To close the core content of this Fieldbook, we return to the beliefs and myths we hold and often perpetuate in our professional work. In Training Ain't Performance, chapter 11(pp. 173-188) offered a dozen “hit or myth” statements, and you decided if each was a “hit” (true) or a “myth” (false). All turned out to be pretty much mythical. The next chapter returns to these statements, and adds a “beyond” aspect to them.
1. Standard deviation is a statistical way of describing the spread around the mean or arithmetic average of a set of numbers. Because it is “standard,” one-third of the set of numbers always falls to one side of the mean and one-third always falls to the other side. The larger the size of the SD (in our example, it was 19.3 before intervention), the bigger the spread in performance. The smaller the size of the SD (in our example, it was 10.2 after intervention), the greater the consistency of performance. In our example, not only is the post-intervention mean higher (82 percent compared to 58 percent), but the size of the SD is smaller—less spread away from the mean—which suggests there is more consistency of performance.