
CHAPTER 7 Usability Evaluation
In the mid-1980s, Digital Equipment Corporation was among the first software companies to define methods for usability engineering. During development of the MicroVMS Workstation Software for the VAXstation I, the usability professionals on the team defined a set of measurable user performance objectives to guide the development process. A central benchmark task was designed in which representative users created, manipulated, and printed the contents of windows. The usability objective was to reduce performance time on the benchmark task by 20% between version 1 and version 2 of the system. As development proceeded, measurements of users’ performance on several related subtasks were made to identify areas of greatest usability concern in the design of version 1. The usability problems having the largest impacts on performance were used to prioritize changes and guide the redesign of version 2. In the end the team exceeded their objective, improving performance time on the benchmark task by 37%, while staying within the originally allocated development resources. Interestingly, however, measured user satisfaction for version 2 declined by 25% relative to version 1. (See Good, et al. 1986).
A usability evaluation is any analysis or empirical study of the usability of a prototype or system. The goal of the evaluation is to provide feedback in software development, supporting an iterative development process (Carroll & Rosson 1985; Gould & Lewis 1985). Insightful requirements and inspired designs create new possibilities for humans and for their organizations. But there are many ways that goals and plans for new technology can go awry. Despite best efforts and sound practices, the original goals for the system may not in fact be achieved. The system may not be sufficiently useful, it may be too difficult to use or to learn, or using it may not be satisfying. More profoundly, the original project goals may have been successfully achieved, but they may turn out to be the wrong goals. Usability evaluation helps designers recognize that there is a problem, understand the problem and its underlying causes in the software, and plan changes to correct the problem.
Scriven (1967) distinguishes between formative evaluation and summative evaluation (Figure 7.1). Formative evaluation takes place during the design process. At various points in the development process, prototypes or system versions are produced and evaluated. As discussed in Chapter 6, prototyping can be as simple as sketching out a few screens or as elaborate as defining and implementing a general software architecture. But the goal of formative evaluation is always the same—to identify aspects of a design that can be improved, to set priorities, and in general to provide guidance in how to make changes to a design. A typical formative evaluation would be to ask a user to think out loud as he or she attempts a series of realistic tasks with a prototype system.

In contrast, summative evaluation is aimed at measures of quality; it is done to assess a design result. A summative evaluation answers questions such as, “Does this system meet its specified goals?” or “Is this system better than its predecessors and competitors?” Summative evaluation is most likely to happen at the end of a development process when the system is tested to see if it has met its usability objectives. However, summative evaluations can also take place at critical points during development to determine how close the system is to meeting its objectives, or to decide whether and how much additional resources to assign to a project. A typical summative evaluation would be to measure performance times and error rates for standard user tasks.
Scriven (1967, p. 54) also describes two general classes of evaluation methods—analytic and empirical (he actually uses the terms “intrinsic” and “payoff”). He makes this distinction with an example:
In Scriven’s example, evaluation of the axe characteristics is an analytic method, while studying a good axeman as he uses the tool is an empirical method. This distinction is important because analytic and empirical methods are complementary to formative and summative goals. Empirical evaluation produces solid facts, but the facts alone may difficult to interpret. If the axe does not cut well, should we change the bit or the handle? We need to know how and why the axe is supposed to work in order to decide whether its creators failed to implement a good design, or succeeded in implementing a bad design. Analytic evaluation of the axe identifies the characteristics that influence the axeman’s performance.
Empirical methods are popular in usability engineering because they involve studies of actual users. The methods can be relatively informal such as observing people while they explore a prototype, or they can be quite formal and systematic, such as a tightly controlled laboratory study of performance times and errors or a comprehensive survey of many users (Table 7.1). But regardless of the care with which the data are collected, the interpretation of empirical results depends on having a good understanding of the system being evaluated.
Table 7.1 Examples of empirical and analytic usability methods.
| Type of Method | Example Methods |
Analytic evaluation: Investigations that involve modeling and analysis of a system’s features and their implications for use |
Claims analysis: system features are analyzed with respect to positive and negative impacts Usability inspection: a set of guidelines or an expert’s general knowledge is used as a basis for identifying or predicting usability problems User models: a representation of the mental structures and activities assumed during use is developed and analyzed for complexity, consistency, and so on. |
Empirical evaluation: Investigations that involve observation or other data collection from system users |
Controlled experiment: one or more system features are manipulated to see effects on use Think-aloud experiment: users think out loud about their goals, plans, and reactions as they work with a system Field study: surveys or other types of user feedback are collected from real-world usage settings |
Analytic methods have their own weaknesses; they produce many interpretations, but no solid facts. A claims analysis identifies features and tradeoffs, and may be used to argue about and assign value judgments. A user model can be built to represent and simulate the mental model a user might build in using an interactive system. A usability inspection considers the extent to which a set of guidelines or design principles have been followed. But the outcomes of analytic work depend very much on the analytic skills and biases of the analyst. Given a user interface to support direct manipulation, a usability inspection may uncover concerns with how direct manipulation has been implemented. The evaluator and the designer can argue about the approach that was taken, but the argument may be difficult to resolve without empirical testing.
How do you choose between analytic and empirical evaluation methods? Scriven (1967) proposes a mixed approach called mediated evaluation: Analytic evaluation occurs early and throughout the design process, but the resulting analyses are also used to motivate and develop materials for empirical evaluations. For example, a usability inspection may examine use of guidelines in a product. The potential problem areas discovered by the analysis could then become the focus of a follow-up empirical study. The analytic work both sets up and helps to interpret the empirical evaluation that studies actual use.
7.1 Usability Specifications for Evaluation
Mediated evaluation is a key idea behind usability specifications (Carroll & Rosson 1985; Whiteside, Bennett, & Holtzblatt 1988), which are precise and testable statements of the usability characteristics required of a system. The intention is to specify and manage usability goals in parallel with the functional goals for the system. Thus, at every step in the development process, as system functions are designed and specified, their consequences for users and their activities are also analyzed and specified. This parallel specification process ensures that usability concerns will always be considered and assessed as new features are proposed and incorporated into the design. In scenario-based development, the usability specifications are derived directly from design scenarios.
Usability specifications rely on a task analysis similar to the methods of hierarchical task analysis described in Chapter 2. A user interaction scenario describes work activities that are typical, critical, or novel. Task analysis breaks these activities into subtasks that provide a more precise specification of what users are expected to do. For example, a scenario in which a user “searches a digital library for Scriven’s article on evaluation” might be analyzed into subtasks such as “ac cessing the digital library,” “initiating the search function,” and “specifying search keys for Scriven’s article.” Decomposing a scenario in this way allows the evaluator to state exactly what a given user should be able to do, and what level of performance and/or satisfaction is expected for each subtask (Table 7.2). The DEC project described in the initial vignette provides concrete evidence that such an approach can guide development (Good, et al. 1986).
Table 7.2 Sample usability specifications built to track usability of a scenario involving search for a reference in a digital library.
| Digital Library Search Subtask | Usability Outcomes Expected |
| Accessing the digital library | A user with at least one hour of previous usage experience should be able to access the main page of the digital library in 20 seconds or less, with no errors, and should rate “ease of access” no less than 4 on a 5-point rating scale. |
| Initiating the search function | A user with at least one hour of previous usage experience should be able to initiate the search dialog from the main page of the digital library in 5 seconds or less, with no errors, and should rate “search availability” no less than 4 on a 5-point rating scale. |
| Specifying search keys for Scriven’s article | A user with at least one hour of previous usage experience should be able to specify search terms that will successfully retrieve the Scriven reference in 30 seconds or less, with one error, and should rate “usefulness of search” no less than 4 on a 5-point rating scale. |
A third idea behind usability specifications is that evaluation is iterative. Evaluation is not an isolated stage in the development cycle, but rather an ongoing process. Repeated analytic evaluations determine how the software will support users’ needs; they also structure and guide empirical testing. As scenarios become more elaborate during design, so do the subtasks comprising them, and the behavior expected from users carrying out these subtasks.
As a mediated evaluation technique, usability specifications allow evaluators to address both formative and summative goals. Precise specification of a subtask along with user performance and satisfaction measures enable a test of “how well did we do?” But at the same time, the fact that the subtasks portray an analysis of a design scenario means that evaluators can also determine which features and outcomes are more or less problematic, thus guiding redesign. A test of the subtasks in Table 7.2 might reveal that the first subtask is performed within the time specified, but that users do not consider access to be “easy.” This would direct evaluators to explore in more detail how users think about the access process to determine the source of dissatisfaction.
During usability evaluation, new test tasks—derived from scenarios exploring new goals, actors, and settings—are introduced to ensure that the evaluation is as general as possible. Evaluating a system with respect to a single set of design scenarios can lead to local optimization. Similarly, relying on a single evaluation approach can lead usability engineers to miss entire categories of information. Different usability concerns are addressed by different evaluation methods; choices among methods involve tradeoffs in resources required and in the precision and interpretability of evaluation results. In the rest of this chapter, we briefly survey different approaches to analytic and empirical evaluation.
7.2 Analytic Methods
It is not necessary to observe or interview users to evaluate an interactive application. Claims analysis is an analytic method that has been described and illustrated extensively in this book. In this method, the usability engineer identifies significant features in a design and generates hypotheses about the consequences these features might have for users engaged in activities (scenarios). A claims analysis is most often implemented for formative goals to better understand and guide a system’s redesign. However, a refined set of claims can be also be used for summative goals—the design rationale provides one view of how well a system meets users’ needs.
An important motivation for analytic methods is that they can be used early in a development process, well before there are users or prototypes available for empirical tests. Another motivation is cost: It is often less expensive to analyze a system than to design and carry out an empirical study. As we have seen, analytic evaluation also guides empirical studies by identifying controversial or novel design features. It helps evaluators know what to attend to, what to measure, and what hypotheses to test.
A hazard of analytic evaluation is that designers may feel that they are being evaluated. Presumably, the design they produce is their best effort, given organizational constraints. Every problem identified or every downside can be heard as criticism. While such a personal reaction is understandable, it is unprofessional. Colleagues, especially usability engineers, can help designers by promoting a cooperative atmosphere in which the development team as a group explores and refines the design.
7.2.1 Usability Inspection
Usability guidelines have a long tradition in software development. Smith and Mosier (1986) is one classic reference; the book lists many recommendations, examples, and exceptions. For example, one guideline is to “locate and display information and commands consistently.” An example of this guideline in use is the predictable set of functions grouped under the File menu in Microsoft Windows applications. Traditional user interface guidelines were intended to be used by designers, although they are often criticized as being too general to provide useful design guidance (Grudin 1989; Newell & Card 1985).
More recently, guidelines have become popular as the basis of usability inspection, in which usability experts examine or work with a system in an effort to detect potential usability problems. Modern inspection methods differ from more traditional use of guidelines in two respects: First, the guidelines are used to guide evaluation, not design. They are used to prompt questions about a design, rather than to specify a solution approach. Second, they are deliberately open ended and incomplete. They are not used to consider all possible design features and potential problems, but rather as a help in finding key issues.
Nielsen (1994) describes an inspection method called heuristic evaluation, in which usability experts review a system against the 10 general guidelines listed below.
- Use simple and natural dialog
- Speak the users’ language
- Minimize memory load
- Be consistent
- Provide feedback
- Provide clearly marked exits
- Provide shortcuts
- Provide good error messages
- Prevent errors
- Include good help and documentation
Nielson recommends that independent heuristic evaluations should be conducted by multiple usability experts; each evaluator identifies as many usability problems as possible. Bias (1991) describes pluralistic walk-through, a similar method in which developers, users, and usability engineers collaborate to analyze a system; Bias argues that a range of perspectives helps to find a larger set of problems. Polson, et al. (1992) describe the use of cognitive walk-through to analyze in detail a user’s goals, expectations, and reactions during individual tasks. Inspection methods are extremely popular in industry, because they generate large numbers of potential usability problems at a relatively modest cost (Bias & Mayhew 1994; Nielsen & Mack 1994).
Inspection methods raise several tradeoffs for evaluation efforts. One is the nature of the analysis produced through inspection (Tradeoff 7.1). Usability inspection is aimed at finding and counting problems, rather than on understanding the implications of a problem. Furthermore, inspection alone does not reveal the validity of the findings. Validity is a crucial concern for any usability evaluation; it refers to the degree to which the findings correspond to what would be found in the actual use. For example, a usability expert might point out 100 potential problems, but only seven of these might ever occur in actual use. And of these seven, it may be that none is particularly serious for users.
Usability checklists and inspections can produce rapid feedback, BUT may call attention to problems that are infrequent or atypical in real-world use.
Many usability inspections include a phase in which the expert classifies each problem on a scale of severity (e.g., from “a minor annoyance” to “would completely disrupt the user’s task”). In this sense, the experts are providing their own assessment of validity, by providing implicit claims about how important a problem will be in real-world usage situations. This provides more guidance to designers, because they can better prioritize the attention they direct toward each problem.
A related question is the usage context provided for an inspection. In some discussions, Nielsen (1995) endorses the use of scenarios as a basis for heuristic evaluation, but in general he argues that scenario contexts may overconstrain how experts will think about system features. But as we have seen, design tradeoffs vary across scenarios. What may seem quite effective for one task (e.g., a context-sensitive menu choice that appears only when needed) may be cumbersome for another (e.g., an expert who wants to get to this option frequently and quickly). Such tradeoffs are difficult to discover and reason about in simple featured-oriented inspections.
A third question concerns the more long-term contributions to the discipline of usability engineering. Heuristic evaluation is very lightweight and relies entirely on the creativity and experience of the evaluators—this is what makes it so popular and easy to do. But there is no mechanism for saving and reusing the insights developed in one evaluation process for use in future projects. Whatever is learned simply ends up as part of the evaluators’ private expertise.
7.2.2 Model-Based Analysis
The goal of model-based analysis is to use established theories in science and engineering to build a predictive model. A classic example is GOMS analysis (goals, operators, methods, and selection rules; Card, Moran, & Newell 1983). A GOMS model is organized into goals that name the user’s current intention, methods that list the steps needed to achieve the goal (e.g., an idealized action plan; Chapter 5), the operators that implement the methods, and any selection rules needed to choose among multiple possible methods or operators. This representation of users’ goals and knowledge is commonly known as a user model.
A portion of a GOMS model is shown in Figure 7.2; it was extracted from an analysis of document editing on the Macintosh (Kieras 1997). This part of the model begins with the goal to move some text. The method for this goal includes four steps; two of the steps instantiate subgoals (cut text, and paste text). It also includes the perceptual operator verify. Each of the subgoals is decomposed into its own method. Both of these include a selection subgoal and a mental operator indicated as Retain. The first step of the cut-text method also includes a selection rule, modeled in the right-hand column of the figure. This rule can be interpreted as “if the text to cut is a word, then use the word selection method; otherwise, use the arbitrary text-selection method”). The rest of the analysis (not shown here) models the subtasks of selecting a word, selecting arbitrary text, selecting the insertion point, and issuing a command.

Figure 7.2 Goals, operators, methods, and selection rules for the subtask of moving text on a Macintosh computer (Kieras 1997, 755–56).
Once a GOMS model has been fully specified, human performance data can be used to estimate the time required to perform a task. For example, a button press takes about 250 milliseconds, moving a hand from keyboard to mouse takes about 400 milliseconds, pointing the mouse takes about 1,100 milliseconds, and a mental operation (e.g., choosing between two methods) takes about 1,350 milliseconds. The GOMS model would be converted into an executable program, and parameters such as these could be used to calculate times for different versions of document editing tasks.
GOMS analysts can also use models such as these to consider issues such as complexity or consistency. For example, in Microsoft Word clicking at the left border of a cell in a table selects the entire cell, but clicking at the left border of a paragraph selects just the closest line. A detailed GOMS analysis might uncover the different uses of this selection technique, perhaps sparking discussion (or empirical tests) of whether the methods create inconsistency problems for users. The models can also be used to interpret empirical data; users may not do exactly what is predicted, but comparing their behavior to the model’s prediction can help evaluators understand why.
Model-based analyses must be focused and explicit so that they can produce precise and quantifiable predictions. But because approaches like GOMS focus on the individual operators that constitute user tasks, they tend to ignore significant aspects of human behavior—namely the structure of work and organizations, and the experiences of learning and problem solving (Tradeoff 7.2). At the same time, a GOMS analysis (which was simplified in our example) can seem like a lot of work to obtain advice about fine adjustments to mouse selections or keystrokes.
Models of performance can yield precise predictions of user behavior, BUT the time spent building such models can take attention away from higher-level human behavior such as learning, problem solving, and social relationships.
Recent enhancements to user modeling have addressed these issues. The original GOMS model assumes sequential task execution, although humans regularly work on multiple tasks at once. Current approaches have been extended to include parallel task execution (Gray, John, & Atwood 1992). Current approaches also address learning, perception, and errors (Kieras 1997). A simplified notation was developed to reduce the tedium of developing detailed symbolic descriptions (Kieras 1988). Finally, the practical use of these models has been demonstrated for niche applications. A well-known example is evaluation of a telephone operator workstation, a computer application in which keystrokes are worth millions of dollars (Gray, John, & Atwood 1992).
Not all model-based analysis is aimed at performance estimates. In a task-action grammar (Payne & Green 1986), the focus is how users’ task knowledge is mapped to system objects and actions. The analyst begins by creating a grammar (a set of rules) describing the tasks a system supports. For document editing, an example rule might be:
The action sequence on the right describes how cut-and-paste can be used to move a paragraph in a paper document. A user interface design for a text editor can then also be described by a grammar, and the mapping between the two sets of rules examined. A simple mapping suggests less difficulty for users learning or using the proposed system.
User interface metaphors can also be used for model-based analysis (Carroll, Mack, & Kellogg 1988). People try to understand new systems by analogy to situations they already know about. Designers take advantage of this by conveying that a metaphor will be helpful in learning about a system (e.g., the concept of a library helps when learning to use a digital archive). A metaphor-based analysis is similar to a task-action grammar, but it highlights the extent to which significant objects, actions, and relationships in the system match or mismatch the structures of the metaphor domain. This leads to predictions about which tasks will be more or less easy to learn or perform, where and what kinds of errors may occur, and so on.
7.3 Empirical Methods
The gold standard for usability evaluation is empirical data. Heuristic evaluation produces a list of possible problems, but they are really no more than suggestions. Claims analysis produces a set of design tradeoffs, but the designers must decide whether the tradeoffs are really dilemmas, and if so, which are most problematic. A model-based approach such as GOMS leads to precise predictions about user performance, but has limited application. What usability evaluators really need to know is what happens when people use the system in real situations.
Unfortunately, empirical evaluation is not simple. If we wait to study users until they have the finished system in their workplace, we will maximize the chance for a real disaster. Finding significant problems at that stage means starting over. The whole point of formative evaluation is to support parallel development and evaluation, so as to avoid such disasters. On the other hand, any compromise we make—such as asking users to work with an incomplete prototype in a laboratory—raises issues concerning the validity of the evaluation (i.e., do laboratory tasks adequately represent realistic use?).
The validity of the testing situation is just one problem. Rarely do empirical results point to a single obvious conclusion. A feature that confuses one user in one circumstance might save another user in a different situation. What should we do? What conclusion can we draw? There are technical tools to help manage these problems. For example, we can calculate the mean number of users who experience a problem with some feature, or contrast the proportion who like the feature to the proportion who dislike it. However, the interpretation of descriptive statistics such as these depends very much on the number and characteristics of the users who are studied.
7.3.1 Field Studies
One way to ensure the validity of empirical evaluation is to use field study methods, where normal work activities are studied in a normal work environment. As we emphasized in Chapters 2 and 3, people often adapt new technology in unexpected ways to their existing work practices. The adaptations that they invent and their descriptions of how and why they use the technology in these ways can provide detailed guidance to designers trying to refine a system’s basic functions and user interface. Thus, field studies can be valuable in formative evaluation, just as they are in requirements analysis. A field study is often the only way to carry out a longitudinal study of a computer system in use, where the emphasis is on effects of the system over an extended period of time.
Suchman’s (1987) study of document copier systems is a classic example of a field study. Suchman observed people using a sophisticated photocopier equipped with sensors to track users’ actions, and the system offers helpful prompts and feedback. In one example, a person starts to copy a multipage document by placing the first page in the document handler. The copier senses the page and prompts the user to press Start. She does so, and four copies are produced. The user is then prompted to remove the original document from the handler. She does this as well, then waits for further direction. However, the copier next senses the pages in the output tray, and prompts the user to remove them. At this point, the interaction breaks down: The prompt about the output tray does not connect to the user’s current goal. She ignores it and instead places a second page into the document handler, triggering a repeat of the earlier prompt to remove the originals. Trying to understand, she misinterprets: “Remove the original—Okay, I’ve re- …, I’ve moved the original. And put in the second copy.”
This simple example vividly shows how a photocopier designer’s best efforts to provide helpful and “smart” instructions backfired, actually misleading and confusing the user. As is typical of field studies like this, the details of the episode also suggest design remedies. In this case, providing less help via the prompts led to a better design.
In a comprehensive field study, hundreds of such episodes might be collected. The amount and richness of the data emphasize the key disadvantage of fieldwork—the data obtained has high validity but can be extremely difficult to condense and understand (Tradeoff 7.3). One approach to this is content analysis—the evaluator organizes related observations or problems into categories. For instance, one category might be problems with system prompts, another might be button layout, another might be feedback indicators, and so forth. Data reduction of this sort helps to focus later redesign work.
Field studies ensure validity of the usability problems discovered, BUT field study results are extensive, qualitative, and difficult to summarize and interpret.
Field study observations may also be rated for severity—each episode is judged with respect to its significance for the user(s). These ratings help to prioritize the data, so that designers can direct most attention to issues of most importance. For example, episodes could be rated on a three-point scale: successful use, inconvenience, and total breakdown. While breakdown episodes are clearly most useful in identifying and guiding design changes, it is useful to also include successful episodes in the data sample. Successful episodes may seem uninteresting, but they help to establish a user interaction baseline (i.e., what can be expected under normal conditions).
Ethnographic observation attends to actual user experiences in real-world situations. Thus, it addresses many of the concerns about the validity of empirical findings (although the presence of an ethnographer may also influence people’s behavior). But this style of work is costly. Collecting field data is very time consuming, and analyzing many pages of notes and observations can be laborious.
A compromise is retrospective interviews, where people are asked to recall use episodes that they remember as particularly successful or unsuccessful. This method is based on Flanagan’s (1954) original work with critical incidents—he asked test pilots to report incidents that stood out in their memory of a recent flight. The critical incidents reported by users should not be considered representative or typical; the point is to identify what seems to be important. However, this makes retrospective interviews an extremely efficient method for producing a collection of problem reports.
Unfortunately, self-reported incidents have their own validity problems. It is well known that people reconstruct their memories of events (Bartlett 1964; Tradeoff 7.4). For example, someone might remember a task goal that makes more sense given the result they obtained. The tendency to reconstruct memories becomes stronger as time elapses, so it is best to gather critical incident reports immediately after an activity. Even then, users are often just mistaken about what happened and what caused what, making their retrospective reports difficult to interpret (Carroll 1990). Self-reported critical incidents should never be taken at face value.
Users often possess valuable insight into their own usability problems, BUT humans often reconstruct rather than recall experiences.
Just as users can contribute to requirements analysis and design, they can participate in evaluation. In field studies and retrospective interviewing, they participate as actors or reporters. But they can also become analysts themselves through self-reflection—a person is asked to interpret his or her own behaviors. In such a situation, the evaluator ends up with two sorts of data—the original episode and the actors’ thoughts about what it means. We are currently exploring this approach with a collaborative critical incident tool, in which a community of users and designers post and discuss usage episodes (Neale, et al. 2000).
7.3.2 Usability Testing in a Laboratory
A significant obstacle for field studies is that systems are often not fielded until development is complete. Even if a preliminary field trial is conducted, it may be costly to travel to the site to collect observational data. There are also specific technical reasons for evaluating usability in a laboratory setting: Laboratory studies can be small in scope and scale, and they can be controlled to focus on particular tasks, features, and user consequences. Laboratory studies do not have the overhead of installing or updating a system in a real work site, so they permit rapid cycles of user feedback and prototyping. In fact, laboratory tests can be useful well before any design work has been done—for example, by studying users’ performance on comparable systems using standardized benchmark tasks.
Because laboratory studies can only simulate real-world usage situations, test validity becomes a major concern (Tradeoff 7.5). For example, it is important that the users be representative—they should be similar to the target users in terms of background, age, ability, and so on (Figure 7.3). A team may inadvertently recruit test participants who know a lot about spreadsheet programs but very little about Web browsers, relative to the intended user population.

Laboratory studies enable focused attention on specific usage concerns, BUT the settings observed may be unrepresentative and thus misleading.
It is also important to recognize and interpret differences among individuals. For example, a novice user may like a system with extensive support for direct manipulation, but an expert user may be frustrated and critical. This is the general problem of variability in test results; dealing with variability is a challenge for all empirical work. Evaluators can address these concerns by studying a large enough set of users that general patterns emerge, or by carefully documenting user characteristics and restricting their conclusions to people who have these characteristics.
The prototype or mock-up tested in a laboratory study may also differ from the final system in key respects. The IBM PCjr failed in part because of the rubbery feel of its keyboard. Studies of keyboard prototypes focusing only on the small size of the miniature keyboard would have missed this critical element. The printed graphics pasted onto a cardboard mock-up may have a higher resolution than the resolution real users will experience with cheap displays. What if users working with such displays cannot see the critical cues?
The tasks tested in the laboratory may not be the ones that people will ultimately undertake with the system. Initially, the significance of the World Wide Web was thought to be its improved user interface for transferring files over the network. Spreadsheets were thought to be tools for arithmetic calculation; only later did it become clear that users would also use spreadsheets for planning, reporting, and communication tasks (Nielsen, et al. 1986).
Ironically, another concern for usability testing is the usability laboratory itself! A usability lab is a specially constructed observation room that is set up to simulate a work environment (e.g., an office), and instrumented with various data collection devices (e.g., video, one-way observation windows, and screen capture). Users are brought into the lab to perform and comment about carefully constructed test tasks. However, the participants in these studies are insulated from normal work distractions and deprived of many of their daily workplace resources. For example, most work environments involve significant interaction among employees, but this is very difficult to simulate in a laboratory environment.
Sometimes a usability test can approximate a field study. Gould, et al. (1987) describe storefront testing, in which a prototype is placed in a semi-public place, such as a hallway near the developers’ workroom. Colleagues passing by are invited to try out the prototype and provide feedback. Such user interactions are not examples of real work. The passersby do not have realistic user goals; they are just curious or are trying to be helpful. The usage context may also not be realistic. Gould, et al. were designing a system for a noisy environment, but tested it in the relatively quiet halls of an industrial research laboratory. Nonetheless, a storefront prototype can literally be wheeled out of the developers’ laboratory and into a usage setting. The method generates user feedback instantly and supports very rapid prototype refinement and iterative testing.
An important issue for laboratory studies is deciding what data to collect. Most studies gather task performance times, videotapes of user actions, screen displays, and so on. But much of a user’s experience is unobservable, taking place inside his or her head as information is interpreted and plans are constructed. Thus, it is also common for usability evaluators to gather think-aloud protocols: Users narrate their goals, plans, reactions, and concerns as they work through the test tasks (Ericsson & Simon 1993). The think-aloud protocol can then be analyzed to determine when the person became confused or experienced usage difficulties; the narration before and after a problem often provides insight into the causes and consequences of usability problems.
Usability testing is often conducted in usability labs designed to look like workplace settings (e.g., an office), and evaluators seek to make test participants feel as comfortable as possible. At the same time, it is important to realize that thinking out loud while working is not natural behavior for most computer users! Tracking and narrating mental activity are tasks in and of themselves, and they compete with the application task the user is trying to perform (Tradeoff 7.6). Task performance times and errors are much less meaningful in think-aloud studies. The reporting process also leads users to pay careful attention to their actions and to system responses, which may influence how they plan or execute their tasks.
Externalizing one’s goals, plans, and reactions reveals unobservable cognitive sources of usability problems, BUT self-reflection may alter what people do.
Think-aloud studies produce a lot of data, just like field observations. In making sense of the data, evaluators use some of the same techniques they would apply to field data. For example, they may identify critical incidents directly from the data record (e.g., Mack, Lewis, & Carroll 1983). A more systematic analysis might produce behavior graphs, in which each user action is indicated, along with comments revealing associated mental states (Rosson & Carroll 1996). Because the evaluator controls the requirements of the test tasks, this method can be used to carry out very detailed investigations of how users plan, execute, and make sense of their own behavior.
Almost all usability studies measure time and errors for users performing tasks. To ensure that the times collected are meaningful, evaluators must specify the test tasks precisely enough so that all participants will try to accomplish the same goal. For example, an email task might be “searching for a message received in spring 1997 from Kanazan Lebole that may have mentioned ACM SIGCHI.” Discovering that such a task is difficult or error prone would cause designers to think about how to better support message retrieval in this email system. (Remember that task times and errors collected during think-aloud studies are influenced by the demands of the reporting task.)
Most usability tests also gather users’ subjective reactions to a system. Users may be queried in a general fashion (e.g., “What did you [dis]like most?”) or they may be asked to rate the usability of specific tasks or features. An interesting and challenging aspect of user testing is that subjective reactions do not always correspond to performance data. A feature may improve efficiency but also annoy users, or it may slow users down but make them feel more comfortable. For example, early formative evaluation of the Xerox Star revealed that users spent a considerable time adjusting window location—they tried to keep their windows arranged so as to not overlap (Miller & Johnson 1996). As a result, designers decided to not allow overlapping windows. Soon after, however, it became clear that overlapping windows are preferred by most users; this is now the default for most windowing systems. The Star was perhaps so far in front of user and designer experience that it was impossible to make reliable formative inferences from time and error measures.
7.3.3 Controlled Experiments
Most usability evaluation examines performance or satisfaction with the current version of the system or prototype. It tries to answer questions about what is working well or poorly, what parts of the system need attention, and how close developers are to meeting overall usability objectives. On occasion, however, a more controlled study may be used to investigate a specific question. For example, suppose a team needs to understand the performance implications of three different joystick designs. A controlled experiment can be designed to compare and contrast the devices.
The first step in planning an experiment is to identify the variables that will be manipulated or measured. An independent variable is a characteristic that is manipulated to create different experimental conditions. It is very important to think carefully about how each variable will be manipulated or operationalized, to form a set of different test conditions. Participants (subjects) are then exposed to these varying conditions to see if different conditions lead to different behavior. In our example, the independent variable is joystick design. The three different designs represent three different levels of this variable. Attributes of study participants—for example, degree of experience with video games—could also be measured and incorporated as independent variables.
A dependent variable is an experiment outcome; it is chosen to reveal effects of one or more independent variables. In our example, a likely dependent variable is time to carry out a set of navigation tasks. Experimenters often include multiple independent and dependent variables in an experiment, so that they can learn as much as possible. For instance, task complexity might be manipulated as a second independent variable, so that the effects of joystick design can be examined over a broad range of user behavior. Other dependent variables could be performance accuracy or users’ subjective reactions. For complex tasks requiring many steps, an evaluator may implement some form of software logging, where user input events are captured automatically for later review (Rosson 1983).
Experimenters must specify how a dependent variable will be measured. Some cases are straightforward. Performance time is measured simply by deciding when to start and stop a timer, and choosing a level of timing precision. Other cases are less obvious. If task errors are to be measured, advance planning will be needed to decide what will count as an error. If subjective reactions are being assessed, questionnaires or rating scales must be developed to measure participants’ feelings about a system.
The independent and dependent variables of an experiment are logically connected through hypotheses that predict what causal effects the independent variables will have on dependent variables. In our example, the experimenter might predict faster performance times for one joystick but no performance differences for the other two. As the number of variables increases, the experimental hypotheses can become quite complex: For example, one joystick might be predicted to improve performance for simple tasks, while a second is predicted to improve complex tasks. Hypothesis testing requires the use of inferential statistics (see Appendix).
Once the experiment variables have been identified, experimenters must choose how participants will be exposed to the different experimental conditions. In a within-subjects design (also called repeated measures), the same participants are exposed to all levels of an independent variable. In contrast, a between-subjects design uses independent groups of participants for each test condition. In our example, we might have one group of users who work with all three joysticks (within subjects), or we might bring in different groups for each device.
A within-subjects design has the advantage that the variability in data due to differences among users (e.g., some people respond more quickly in general) can be statistically removed (controlled for). This makes it easier to detect effects of the independent variable(s). However, exposure to one level of an independent variable may influence people’s reactions to another (Tradeoff 7.7). For example, it is quite possible that experience with one joystick will cause people to learn physical strategies that would influence their success with a second.
Using the same participants in multiple testing conditions helps to control for individual differences, BUT may lead to task ordering or other unwanted effects.
Such concerns are often addressed by a mixed design, where some independent variables are manipulated within subjects and others are manipulated between subjects. For example, the different joysticks could be used by different groups of people, but task complexity could be left as a within-subjects variable.
Within-subjects designs are popular and convenient—fewer participants are required, and potentially large effects of individual variability are controlled. Exposing the same participants to two different conditions also allows for direct comparison (e.g., in a series of rating scales). However, experimenters must anticipate nuisance effects, such as task order, and counterbalance the testing conditions as necessary. In complex designs having many independent variables with multiple levels of each, preventing nuisance effects can be challenging.
In any usability evaluation, it is important to recruit subjects who are representative of the target population. But for experimental studies, there are also important questions of how participants are assigned to different conditions, and how many participants will be needed to measure the expected differences among conditions.
The simplest method is random assignment: Each participant is placed randomly in a group, with the constraint that groups end up being the same size (or as close as possible to equal sizes; unequal group sizes reduce the sensitivity of statistical tests). Under this strategy, nuisance variables such as age, background, or general motivation are randomly distributed across the different experimental conditions. Randomization increases the “noisiness” of the data but does not bias the results.
Random assignment is most effective when the number of participants is large; a rule of thumb is to have at least ten individuals in each condition. As the number of participants (the sample, or n) increases, the statistical estimate of random variation is more accurate, creating a more sensitive test of the independent variables. However, this can lead to a dilemma—an experiment with results of borderline significance can often be repeated with a larger number of participants to create a more powerful test, but results may not be worth the extra cost and effort (Tradeoff 7.8). Usability practitioners must carefully balance the needs of their work setting with the lure of reporting a “statistically significant” result. Ironically, a very large experiment may produce statistically significant differences that account for a very small portion of the overall variance in the data. Experimenters should be careful to report not only the statistical tests of differences, but also the proportion of the overall variability accounted for by these differences (see Appendix).
The sensitivity of a statistical test is enhanced by increasing sample size, BUT obtaining a statistically significant result may not be worth the cost and effort of running a very large experiment.
Another assignment strategy is to combine random assignment with control of one or more participant variables. For example, experimenters often randomly assign an equal number of men and women to each group because they worry that gender will influence the results. This helps to ensure that any effects of this particular nuisance variable will be equally distributed across the conditions of interest.
7.4 Science Fair Case Study: Usability Evaluation
Evaluation is central and continuous in SBD. From the first step of activity design, the use context provided by the scenarios serves as an implicit test of the emerging design ideas. The “what-if” reasoning used in analyzing claims expands and generalizes the situations that are envisioned and considered. The focus on design feature impacts is an ongoing source of formative evaluation feedback.
Evaluation becomes more systematic when usability specifications are created from design scenarios and their associated claims (Figure 7.4). The scenarios provide the motivation and activity context for a set of sequential subtasks that will be evaluated repeatedly as benchmarks of the system’s usability. The claims analyses are used to identify the subtasks to be tested—recall that claims have been used throughout to track design features with important usability implications. For each subtask, outcome measures of users’ performance and satisfaction are defined, creating a testable set of usability specifications (Carroll & Rosson 1985).

The high-level goal of any usability evaluation is to determine to what extent a design is easy or hard to learn and use, and is more or less satisfying. Usability specifications make this high-level goal more precise, transforming it into a set of empirically testable questions. The repeated testing of these tasks ascertains whether the project is meeting its usability goals, and if not, which design features are most in need of attention.
7.4.1 Usability Inspection
As we have seen, analytic evaluation takes place constantly in SBD when writing scenarios and claims. This ongoing analytic work forms a skeleton for empirical studies. Other analytic evaluation methods can be useful as well. For example, we carried out an informal usability inspection using the guidelines suggested by Nielsen (1994); Table 7.3 summarizes usability issues raised during this inspection.
Table 7.3 VSF usability problems identified through heuristic evaluation.
| Guideline | Potential VSF Usability Problems |
| Use simple and natural dialog | Control+F used to synchronize views; Control+l to query activity |
| Speak the user’s language | Young or inexperienced students may not understand “Nested Components” |
| Minimize user memory load Be consistent | Chat bubbles stay on the screen only for 20 seconds |
| People appear as avatars in exhibit space, but as a text list at exhibit; map is replaced by miniaturized windows in exhibit display | |
| Provide feedback | Information on others’ activities only available with extra effort; chat bubbles in room overlap for large groups; red color used for alerts will not be detectable by color-blind individuals |
| Provide clearly marked exits | Relationship between exhibit and nested components not clear; when you change view, what happens to nested component? |
| Provide shortcuts | Must open each nested component individually, i.e., no “display all” |
| Provide good error messages | “File type not recognized” doesn’t indicate how to fix problem when Excel or other source applications are not installed on client machine |
| Prevent errors | Multiple independent windows are difficult to distinguish and manage |
| Include good help and documentation | Help information on how to extend file types assumes familiarity with similar dialogs in Web browsers |
The inspection was carried out as an informal “walk-through” of the design scenarios. We stepped through each scenario and considered whether the actors might have problems in any of the ten areas identified by Nielsen’s (1994) guidelines (left column). We did not worry about the severity of the problems at this point, so some of the problems listed in the table may be unlikely or have little impact. For example, few people will have difficulty recognizing that avatars and text names are different views of the same individuals. However, a visitor forced to carry out many selections and double-clicks to open many nested components may become very frustrated.
A usability inspection such as in Table 7.3 provides an early indication of possible problems, similar to that provided by a claims analysis. Even if no empirical studies were carried out, this list of problems could be prioritized and handed back to the design team for their consideration and possible redesign. Of course, as for any inspection technique, the list of problems identified is meaningful only to the extent the problems will arise in actual use, and without empirical data these judgments can only be based on opinion.
7.4.2 Developing Usability Specifications
In parallel with ongoing inspection and claims analysis, usability specifications were developed for each of the science fair design scenarios. Table 7.4 illustrates the first step in developing usability specifications (we have focused on the two interaction design scenarios presented in Chapter 5; see Figures 5.5 and 5.6).
Table 7.4 Subtasks analyzed from the VSF design scenarios.
| Interaction Design Scenario | Subtasks Identified from Claims Analysis |
| Mr. King coaches Sally | Identify and synchronize views; Upload local file; Open and work with source application; Create nested component |
| Alicia and Delia visit the fair | Find location of specified visitor; Join an exhibit; View specified exhibit element; Open and work with source application; Review and modify FAQ; Access and view nested component |
Each scenario was decomposed into critical subtasks—the key features of the system that are influencing people’s experience. The claims analyzed during design were used as a guide in identifying the subtasks. The list is not exhaustive, but rather highlights the system functionality most likely to affect system usefulness, ease of learning or use, or satisfaction. Thus, the subtasks cover a number of the open issues discussed during design (e.g., nested components and use of the control-key commands). This is the sense in which usability specifications support mediated evaluation—the results of analytic evaluation are used to set up an empirical evaluation plan.
Table 7.5 presents two fully elaborated usability specifications. Each scenario has been broken into subtasks, and target levels for users’ performance and subjective reactions have been specified. The performance measures are based on time to perform a subtask and the number of errors made. Satisfaction is measured on a 5-point attitude scale. For example, “confusion” after the first subtask is rated on a scale from 1 = “not at all confusing” to 5 = “extremely confusing.”
Table 7.5 Detailed usability specifications for two scenario contexts.
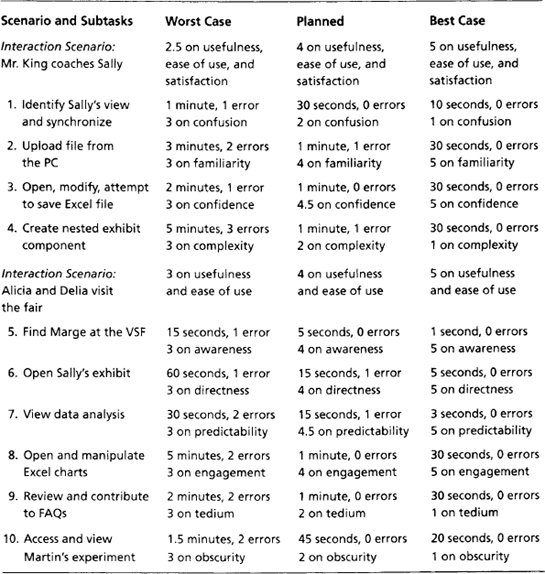
Some scales are written so that a higher number means a more positive rating, while some are reversed. In all cases, the target levels are interpreted as an average across all test participants.
It is important that the usability outcomes in the specification are concrete and testable. Each subtask names a test task that will be observed; the target performance and satisfaction levels specify exactly what measures should be collected. These subtasks are evaluated over and over during development as a benchmark of progress toward agreed usability objectives.
The three levels of outcomes bound the iterative development process: “Best case” is determined by having an expert carry out the task; anything below “worst case” indicates failure. “Planned level” is the actual target, and should be a feasible and realistic statement of usability objectives. Initially, these usability outcomes reflect an educated guess and are based on the design team’s experience with the prototype or with other systems having similar functionality. It is possible that these levels will change slightly as users’ actual performance and reactions are studied, but it is crucial that a team (and its management) take the numbers seriously as targets to be achieved.
Notice that along with time, errors, and satisfaction measures for each subtask, Table 7.5 specifies satisfaction judgments for the interaction design scenario itself. A full scenario includes so many features that it would be difficult to predict precise performance measures. However, the team can certainly ask test users to try out the functionality described in a scenario, and measure subjective reactions to this experience. Measures like these can be used to specify usability outcomes even for a rather open-ended scenario exploration.
7.4.3 Testing Usability Specifications
Usability testing should not be restricted to the design scenarios. Early in development, if a scenario machine is the only available prototype, empirical evaluation may necessarily be limited to these tasks. But when a more general-purpose prototype is ready, new activities and subtasks should be introduced into the evaluation. This is important in SBD, because exclusive attention to a small set of design scenarios can lead to a system that has been optimized for these situations at the expense of others.
Figure 7.5 shows one technique for generating new activity scenarios. The left column summarizes the five design scenarios developed in Chapters 3 through 5. The scenarios on the right were created by bringing in actors with differing backgrounds and motivations, but with overlapping system functionality and user interface features. This strategy works well early in a system’s lifecycle, when only some of a system’s features are available (i.e., that specified in the design scenarios), but the team wants to evaluate multiple use contexts. Later on, test scenarios representing more radical extensions of the core design (e.g., a teacher who takes her students on a “virtual tour” of the fair) can be developed and evaluated.

The scenarios in Figure 7.5 were used in two sorts of usability testing. Early on, we simply asked test participants to adopt the perspective of an actor (e.g., Sally or Mr. King), and to simulate the scenario activity. For example, a simple introduction such as the following was given:
The test participants then explored the system with these instructions in mind. We asked the participants to think out loud as they used the system, and we observed their actions with the system. After each scenario we asked them to rate their experience with respect to usefulness, ease of use, and satisfaction (see Table 7.5). The goals of these early tests were very informal—we tried to understand whether the system supported the scenarios as intended, and if not, the major problem areas. In the rest of this section, we describe the more careful testing we conducted on individual subtasks.
Recruiting Test Participants
The participants in usability studies represent the population the system is designed to support. This often means that evaluators will need to recruit individuals from multiple stakeholder groups. For example, our science fair scenarios include students, parents, teachers, community members, and school administrators as actors. The scenarios also assume certain experience and knowledge (recall the stakeholder profiles in Chapter 2). Sometimes it is difficult to recruit participants from each of these groups (e.g., there are not very many school administrators to draw from). A compromise is to ask individuals from one group to role play the perspective and concerns of another group.
Even when a team can identify representative users, persuading them to participate in a usability session can be challenging. Sometimes a system is novel enough that users will agree to work with it just for the experience. More typically, spending time evaluating a system means taking time away from something else (e.g., work or leisure time). Offering a small stipend will attract some individuals, but ironically, the most appropriate users are often those who are least available—they are busy doing just the tasks your system is designed to enhance! Participatory design addresses some of these problems, because stakeholders are involved in a variety of analysis and design activities. Unfortunately, end users who contribute to design are no longer good representatives of their peers; they are members of the design team.
Regardless of how participants are recruited, it is important to remember that they are just a sample of the entire population of users. Personality, experience, socioeconomic background, or other factors will naturally influence users’ behavior and reactions. Gathering relevant background information can demonstrate that a test group is (or is not) a representative sample of the target population. It also aids in interpretation of observed differences among individuals.
Developing Test Materials
Prior to beginning a usability test, the team must develop the instructions, surveys, and data collection forms that will be used to coordinate the test sessions. In this section, we illustrate the test materials developed for the science fair usability tests.
An important concern in any test with human participants is that they be treated fairly. The guidelines for ethical treatment of human subjects developed by the American Psychiatric Association emphasize informed consent: The study’s goals and procedures are summarized for each participant, questions if any are answered, and the person is asked to sign a form affirming that he or she is participating voluntarily and can withdraw at any time without penalty (Figure 7.6). In practice, this agreement often reads like a legal document—for example, it may promise that videotapes will not be used for commercial purposes, or that the participant will not disclose details of the prototype systems to other people.

In these situations, the wording must be developed even more carefully to ensure that participants understand their role and responsibilities.
A user background survey collects information about participants’ background and expectations prior to using a system. Typically, this survey will be completed at the beginning of a usability test session, but on occasion a usability team may recruit participants in an ongoing fashion, so that they always have a panel of users from which they select individuals for specific evaluation sessions. The background survey need not be extensive; indeed, if the users are asked to spend a lot of time in advance filling out a questionnaire, their interest in working on the system may decline or disappear. Consider carefully what participant characteristics are most likely to influence users’ interactions with the system.
Figure 7.7 shows the background survey developed for the science fair studies. We ask about participants’ occupations and their experience with science fairs so that we can categorize them into one of our major stakeholder groups. Their general computing experience, and more specifically their experience with MOOs, help us to understand their technology background and is useful in understanding any personal variations we might observe (e.g., a very successful experience of a high school student who has been using MOOs for several years). The final open-ended question gives participants a chance to disclose any other personal data that they believe might be relevant.

The background survey also measures pre-test attitudes about online science fairs. We developed three Likert scales—an assertion followed by a response scale ranging from Strongly Agree to Strongly Disagree—to measure pre-test expectations about online science fairs and science education. We will repeat these rating scales in a user reaction survey administered after the test tasks (i.e., a post-test), so that we can look for changes relative to the pre-test judgments.
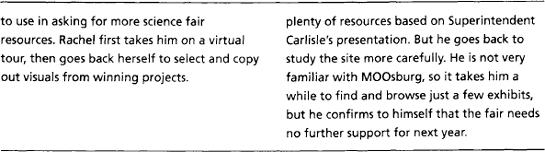
Figures 7.8 and 7.9 present instructions developed for the VSF testing. We show both general instructions (provided once at the beginning of the testing) and task-specific instructions (provided at the beginning of each subtask). The general instructions provide an overview of the procedure and communicate requirements shared by all tasks (e.g., thinking aloud and indicating task start and stop).

The task instructions should motivate and guide participants through the two groups of subtasks detailed in the earlier usability specifications (Table 7.5). In this example, the subtasks are the four elements selected from the coaching scenario. A brief context description sets the scene, specifying details of the actors and situation that are relevant to the individual tasks that will follow.
Each subtask is presented as briefly as possible—again, remember that the goal of the testing is to see how well the system supports the tasks, not how well the evaluator can describe what steps to take. However, it is important to supply the details needed to carry out a step, such as the name of a file to be uploaded. Each task assumes that the system is in an appropriate starting state. For example, when the user begins Task 1, he or she should see Sally’s exhibit as it would appear when Mr. King first arrives; a co-evaluator should be online playing the role of Sally.
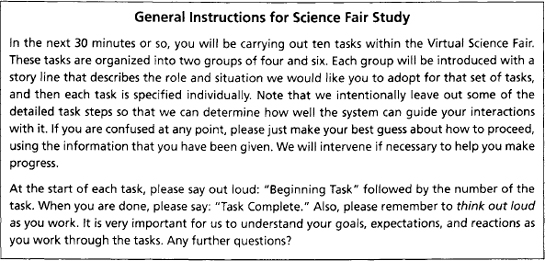
The task instructions guide users’ interactions with the prototype, and evaluators collect various pieces of data as these interactions take place. In some cases, the data collected by hand will be minimal. Software systems can be instrumented to collect user input events and system responses, and a video camera can easily capture visible user behavior and comments. However, the review and analysis of these comprehensive data records are very time consuming (e.g., two to four hours for each hour of videotape recorded), so most evaluations will also employ one or more human observers (perhaps hidden behind a one-way mirror). In the science fair study, we used the simple data collection form in Figure 7.10 to record times, errors, and other interesting behavior.
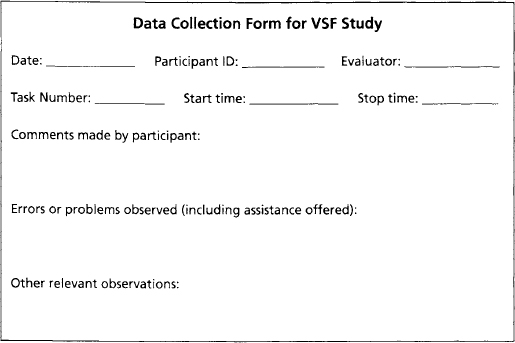
Figure 7.11 shows part of the user reaction survey we developed to assess participants’ subjective impressions of the science fair system. A reaction survey is usually more extensive than a background survey; by the time users complete this form, they have worked through a number of test tasks, and are primed to report their reactions. This particular survey combines several open-ended questions with a set of Likert rating scales. The former are probes similar to those used in critical incident interviews, where the goal is to discover what stands out in users’ memories.
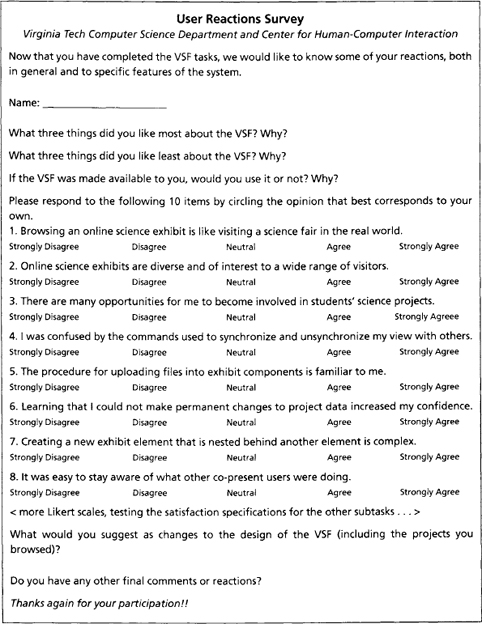
The Likert scales used in the pre-test survey are repeated, along with scales designed to measure the satisfaction outcomes specified earlier (Table 7.5). For example, Item 4 queries users’ confusion stemming from the Control +F mechanism for sychronizing views; Item 5 measures the extent to which the file-uploading procedure is familiar to users; and so on. The final open-ended questions again enable participants to voice any additional reactions or suggestions.
Conducting the Usability Test
For a usability test to be meaningful, participants must feel comfortable and able to concentrate on their assigned tasks. The evaluators must be certain that participants know what is expected, but once this is established, they should make themselves as invisible as possible. Usability labs equipped with remote video or one-way mirrors for observation help to distance evaluators from participants. If one or more evaluators stay in the room to observe and take notes, they should step back out of the participants’ peripheral vision and refrain from distracting movements or noises.
It is understandably difficult to keep an appropriate distance when participants have difficulty with a task—the natural human reaction is to offer assistance or advice. For this reason, it is essential to consider in advance which steps in a task are most likely to cause difficulties, and to develop an assistance policy that specifies when and how much help to provide.
The assistance policy should take into account the quality of the prototype and the goals of the test. If the prototype has a help system, experimenters may not intervene at all; participants are told to rely on the help documentation just as they would in the real world. However, prototypes are often incomplete. Sometimes an intervention is necessary simply to enable a participant to continue.
A good general strategy is to intervene in a graduated fashion: The first time a participant experiences a problem, direct him or her back to the task instructions and the screen display. If the problem persists or worsens, point to the specific instruction(s) or screen display that is most likely to help. Finally, if nothing else helps, specify exactly what to do (sometimes an evaluator must physically intervene to help the participant recover from an error).
A related issue arises when participants are asked to think aloud as they work. At the start of the session, individuals often need to be prompted, “What are you thinking?” to remind them to share their thoughts. As the test progresses, it is up to the evaluators to recognize when significant events take place (either successful or problematic), and to probe the users’ thoughts at that point if commentary is not provided. After testing, a semi-structured interview, or debriefing, helps to resolve any questions that come up during the evaluation.
Knowing when and how to intervene (whether for assistance or for prompting think-aloud commentary) requires extensive familiarity with task steps and with the current state of the prototype. For this reason, and to ensure that the instructions and survey questions are working as planned, evaluators should carry out one or more pilot tests—practice sessions in which one or two participants try out the materials, while the evaluators look for ways to refine the instructions, data-gathering procedures, and so on. Pilot tests can usually be carried out quite informally; for example, colleagues can be asked to test-drive the materials.
Reporting Test Results
The goal of an empirical evaluation is to discover as much as possible about whether and how a system is meeting its usability specifications, and to develop suggestions for improving the design. To fulfill this goal, the evaluators must understand not just what test participants did during the test tasks, but why they behaved and reacted as they did. This is accomplished by first characterizing the test participants, and then examining in detail their behavior (e.g., time, errors, and interaction episodes), and subjective reactions (e.g., comments while using the system and ratings or opinions provided after the tests).
Participant Background Several types of user characteristics were measured in our user background survey. Occupation is a categorical variable; the response of each participant is grouped into categories such as student or community member. Categorical variables are normally summarized as a frequency or count for each category (e.g., 5 students, 2 professionals, 3 housewives) and are often displayed in a bar chart (Figure 7.12). Categorical variables may also be expressed as percents or proportions, if the goal is to contrast different categories. Sometimes the data from more than one variable is graphed in the same chart, to illustrate relationships between variables.
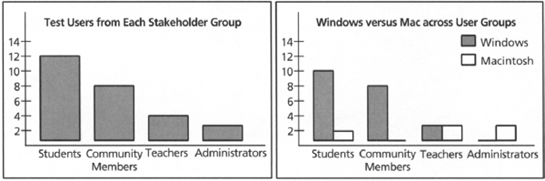
Figure 7.12 Categorical data from the VSF usability test. Each histogram shows the frequency of responses in that category.
Participants’ occupation responses on the background survey were used to assign them to one of four stakeholder groups; the chart on the left of Figure 7.12 shows that we tested 12 students, 8 community members, 4 teachers, and 2 school administrators. The histogram on the right summarizes computer use across the different user groups. It shows that, as expected, the students and community members are most likely to be using PCs, but that the education professionals are just as likely to use Macintosh computers.
An ordinal variable has values that have an inherent order, such as a scale that measures reactions from “positive” to “neutral” to “negative.” These variables are also summarized with frequencies and histograms. In contrast, the values of an interval variable represent an ordered scale where the difference between any two neighboring values is known to be equal. Examples of these variables are age, years of education, and years of residency. These data are normally summarized with descriptive statistics such as means, modes, medians, and measures of variability.
Table 7.6 reports descriptive statistics for several questions about user background; each cell reports the mean and standard deviation for users in that group (the number or n in each group is shown in the header). A summary such as Table 7.6, combined with charts such as those those in Figure 7.12, provides a comprehensive description of the people serving as test participants. Notice that both the students and community members tend to be longtime residents, despite their wide variation in age and level of education.
Table 7.6 Means (and standard deviations) for three background measures, broken down by user group.

Task Performance and Satisfaction The results from the usability test fall into two general groups: objective data concerning users’ performance (generally time and errors, sometimes an inventory of behaviors), and subjective data concerning their attitudes and reactions (the ratings and comments they make during or after their interactions with the system).
Summarizing performance data is straightforward. Task times are easy to report with means and measures of variability. Errors are counted and reported as total frequencies, or as an average frequency across users. If there are many errors, it may be useful to first categorize them into groups (e.g., navigation or editing).
Table 7.7 summarizes performance on the four subtasks from the coaching scenario. Generally, results are summarized task by task (e.g., the average time to complete Task 1 was 40.20 seconds, with an average of 1.6 errors made across the 26 participants). This allows easy comparison to the usability specifications developed earlier (Table 7.5), and makes clear which tasks are particularly problematic or successful. For example, we can see that creating a nested component took much longer than specified, and that most of the tasks produced some degree of error.
Table 7.7 Summary of time (and standard deviations) and errors on four VSF test tasks (across all 26 participants).

When there are many tasks, or when the tasks fall into natural groupings (e.g., by source scenario), it may be helpful to combine task times and errors, developing composite performance measures that represent more complex interaction sequences. If the evaluators suspect or observe differences related to user background, the data may also be decomposed and summarized as a function of the various user characteristics.
In summarizing satisfaction outcomes, usability evaluators often treat rating scales as if they are interval variables—in other words, they treat each scale position as if it were a number, and assume that the difference between any two positions is always the same. Even though experts agree that rating scales are not as precise a measure as implied here, treating ratings as interval data makes it much easier to summarize test results and to compare outcomes for different user groups or versions of a system. Thus, in Table 7.8 we use means and standard deviations of the data from seven Likert scales.
Table 7.8 Summary of satisfaction ratings for VSF test tasks (across 26 participants).
Strongly Disagree = 1; Disagree = 2; Neutral = 3; Agree = 4; and Strongly Agree = 5.
| Likert Item | Mean Rating | Change |
| 1. VSF is like real world | 3.2(1.55) | +1.01 (0.15) |
| 2. Exhibits diverse, interesting | 4.1 (1.67) | +0.55 (0.25) |
| 3. Opportunities for science project involvement | 2.9 (2.11) | +0.10(0.09) |
| 4. Confusion about synchronization | 3.5 (0.91) | |
| 5. Familiarity of file-uploading dialog | 4.2 (1.02) | |
| 6. Confidence when interacting with project data | 3.7 (2.24) | |
| 7. Complexity of creating a nested element | 4.0(1.94) |
Table 7.8 also presents change scores for the rating scales that were included in both surveys. These attitude items were of a general nature, probing views of an online science fair and involvement in science fair activities. The assumption is that a positive experience overall should increase the positive responses on these scales; such an effect would appear as an overall positive difference. The data in the table suggest that while participants’ interactions with the system may have enhanced their concept of a virtual science fair, they were not persuaded that it will change their opportunities for becoming more involved in science fairs.
Sometimes it is also useful to explore the relationship between user characteristics and the performance or attitude measures collected. For example, an evaluation team might be interested in task time for experienced versus inexperienced computer users. Indeed, even if there was no deliberate sampling of users with varying backgrounds, the performance or attitude data collected may be highly variable across individuals. Such diversity is often a signal that personal characteristics are influencing users’ experiences, and a careful examination of user background variables may be essential to fully understand the results obtained.
Verbal Protocols and User Behavior A more challenging data summary task is the organization and interpretation of the comments made by participants. Some of these comments emerge during the test tasks, as participants think aloud about their activities. Others are offered in response to open-ended questions included on the user reaction survey. It is the great diversity and subjective nature of these data that make them difficult to summarize.
The simplest approach is to develop categories that capture major themes in the comments. For example, comments might be categorized as positive or negative, or they might be divided into function areas, such as navigation, error recovery, and so on. For survey questions asking for “the three worst things,” a summary of this sort can be very helpful in guiding redesign, particularly if users are also asked why they highlighted a particular feature. Categorical data such as these could be summarized with frequency, percentage, or proportion scores (e.g., in a table or histogram).
A more detailed analysis may be developed to understand individual users’ interactions with a system. The raw data in this case are behaviors documented through observers’ notes, videotape or screen capture, and corresponding think-aloud protocols. Figure 7.13 shows such an episode from the science fair testing. Such episodes can be examined for events that reveal misunderstandings (or correct inferences) about the system. For example, this particular episode suggests that the user did not at first realize that she could double-click on the miniature windows to open the underlying application. If this same problem were observed for a number of users, the design team might consider a redesign that makes the “application-launch” functionality more apparent (e.g., recall the icon design discussion in Chapter 4).
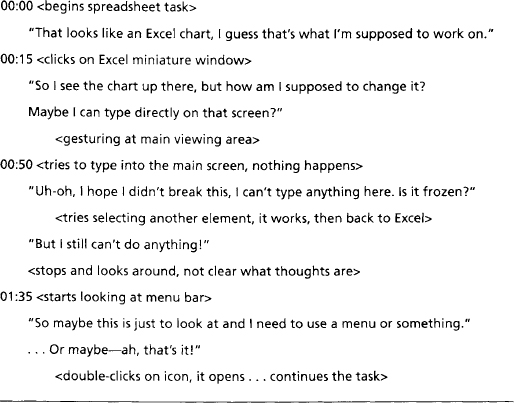
Figure 7.13 A partial episode transcript from Task 3, merging records of what the user was doing with her think-aloud commentary.
This sort of qualitative analysis demonstrates a form of critical incident analysis that is very common and very useful in formative usability evaluation. The data obtained through observation and think-aloud studies, although qualitative and somewhat anecdotal in character, can have a tremendous influence on software developers, simply because the usage experience it conveys is so rich.
7.4.4 Assessing and Refining Usability Specifications
It is easy to become lost in the details of data collected in an empirical study. The team must always keep in mind the relative costs and benefits of the techniques they are using—for instance, early in system development, control and precision may be less critical than seeing if a particular scenario or subtask is even possible for users. In such cases, it is perfectly reasonable to rely on informal testing situations, as long as the team understands the limitations of these more informal methods (e.g., lower test validity).
However, in the longer term, it is the development and constant reference to a set of usability specifications that guides a usability engineering process. Participants’ performance and subjective reactions are compared to the expected levels. When test data are considerably worse than the projected levels, a warning flag is raised; the evaluators must then carefully analyze the detailed usage data to determine how to resolve the problem. If the test data are considerably better than expected, a different warning flag is raised—in this case, the team may have been too conservative in their usability objectives, or may have inadvertently developed instructions or test procedures that oversimplified or trivialized a task.
Summary and Review
This chapter has presented the rationales and examples of usability evaluation in the design of interactive systems. The discussion was organized by Scriven’s (1967) contrasts of formative and summative evaluation, and of analytic and empirical evaluation. The science fair project was used to demonstrate how design scenarios and claims can be directed toward the goals of usability evaluation. Central points to remember include:
- Formative evaluation emphasizes guidance for redesign, whereas summative evaluation emphasizes assessment of a system’s overall quality.
- Scenarios can be reformulated as usability specifications, because they describe the usability consequences of specific system features. For testing purposes, scenarios are broken into subtasks that serve as usability benchmarks in development.
- Analytic methods such as inspection or model building can take place at any time in development, but may not reflect the issues that emerge during actual use.
- Important concerns in empirical evaluations include representative users, realistic tasks and work environment, and the quality of the prototype tested.
- Asking users to think aloud as they work through test tasks provides important insights into how they are forming and pursuing goals, and how they are making sense of what happens when they attempt actions.
- Summarizing user behavior and think-aloud reports in terms of critical incidents (both positive and negative) can be a highly evocative (albeit anecdotal) mechanism for educating and influencing software developers.
- Independent variables are the factors expected to have an effect on users’ experience; dependent variables are the behaviors or reactions measured to assess these effects.
- Claims analysis and other analytic methods (e.g., usability inspection) can be used to identify and prioritize subtasks for detailed analysis in usability testing.
- Writing new scenarios just for the purposes of usability testing is important to ensure generality and coverage of the design work.
- During usability testing, it is important to gather relevant background information about each user, so as to best interpret the behavior and satisfaction data obtained.
- Careful planning must be directed at all aspects of the usability test (e.g., instructions, assistance policy, background and reaction surveys) to ensure that useful and interpretable data are collected.
Exercises
- Carry out a usability inspection of the Web site for Amazon.com. Using the example in Table 7.3 as a model, play the role of a usability expert working from Nielsen’s guidelines. Scope the analysis by first choosing two concrete tasks (e.g., finding a particular product), and then identify usability problems associated with each task. Be sure to describe the tasks you focused on along with the problems that you identify.
- Discuss the problem of recruiting representative users for a usability test of a Java development environment. Suggest some strategies you might use to address these problems. What would you do if you could not recruit expert Java programmers?
- Think back over your last few weeks of surfing the Web. Can you remember any episodes that you would report as “critical incidents”? If so, what makes them critical? If you can’t remember any, interview friends and see what they remember.
- Complete the set of Likert scales in Figure 7.11. Using items 4 through 8 as models, write one additional rating scale for subtasks 6 through 10 in Table 7.5. Remember that the scale should be specific to the aspect of satisfaction singled out in the specification (i.e., directness, predictability, engagement, tedium, and obscurity).
- Add another column of new scenarios to Figure 7.5. Use the same technique demonstrated there, working with similar functionality in each case, but bringing in the goals and concerns of sets of actors.
- Collect a brief think-aloud protocol of a friend searching the Web for information about the International Space Station. Provide a version of the general instructions in Figure 7.8, and then record (preferably using a tape recorder) all remarks made. Create a transcript like the one in Figure 7.13, and then look for evidence of how your friend thinks about this task. What does it tell you about his or her mental model of the Web and understanding of search machines? What organizations and people are concerned with space stations?
Project Ideas
Plan, conduct, and report on a usability evaluation of your online shopping system:
- Use your scenarios and claims to define subtasks and create usability specifications. Discuss and select realistic performance and satisfaction levels, using performance on similar systems as a guide.
- Design and construct testing materials (consent form, instructions, background and reaction surveys, and data collection forms).
- Recruit five or six participants (subjects) and carry out the study. Be sure to plan all procedures in advance, including how errors will be recognized, what other data will be collected, when and how much assistance will be provided, and so on.
- Develop summary presentations and discussions of your test results. Focus on the findings that are most out of line with the specifications, and consider what you might do in redesign to address these issues.