
Chapter 4. Design and implement Azure PaaS compute and web and mobile services
The Azure platform provides a rich set of Platform-as-a-Service (PaaS) capabilities for hosting web applications and services. The platform approach provides more than just a host for running your application logic; it also includes robust mechanisms for managing all aspects of your web application lifecycle, from configuring continuous and staged deployments to managing runtime configuration, monitoring health and diagnostic data, and of course, helping with scale and resilience. Azure Apps Services includes a number of features to manage web applications and services including Web Apps, Logic Apps, Mobile Apps and API Apps. API Management provides additional features with first class integration to APIs hosted in Azure. Azure Functions and Azure Service Fabric enable modern microservices architectures for your solutions, in addition to several third-party platforms that can be provisioned via Azure Quickstart Templates. These key features are of prime importance to the modern web application, and this chapter explores how to leverage them.
Skills in this chapter:
![]() Skill 4.1: Design Azure App Service Web Apps
Skill 4.1: Design Azure App Service Web Apps
![]() Skill 4.2: Design Azure App Service API Apps
Skill 4.2: Design Azure App Service API Apps
![]() Skill 4.3: Develop Azure App Service Logic Apps
Skill 4.3: Develop Azure App Service Logic Apps
![]() Skill 4.4: Develop Azure App Service Mobile Apps
Skill 4.4: Develop Azure App Service Mobile Apps
![]() Skill 4.5: Implement API Management
Skill 4.5: Implement API Management
![]() Skill 4.6: Implement Azure Functions and WebJobs
Skill 4.6: Implement Azure Functions and WebJobs
![]() Skill 4.7: Design and implement Azure Service Fabric Apps
Skill 4.7: Design and implement Azure Service Fabric Apps
![]() Skill 4.8: Design and implement third-party Platform as a Service (PaaS)
Skill 4.8: Design and implement third-party Platform as a Service (PaaS)
![]() Skill 4.9: Design and implement DevOps
Skill 4.9: Design and implement DevOps
Skill 4.1: Design Azure App Service Web Apps
Azure App Service Web Apps (or, just Web Apps) provides a managed service for hosting your web applications and APIs with infrastructure services such as security, load balancing, and scaling provided as part of the service. In addition, Web Apps has an integrated DevOps experience from code repositories and from Docker image repositories. You pay for compute resources according to your App Service Plan and scale settings. This section covers key considerations for designing and deploying your applications as Web Apps.
This skill covers how to:
![]() Define and manage App Service plans
Define and manage App Service plans
![]() Configure Web App settings
Configure Web App settings
![]() Configure Web App certificates and custom domains
Configure Web App certificates and custom domains
![]() Manage Web Apps by using the API, Azure PowerShell, and Xplat-CLI
Manage Web Apps by using the API, Azure PowerShell, and Xplat-CLI
![]() Implement diagnostics, monitoring, and analytics
Implement diagnostics, monitoring, and analytics
![]() Design and configure Web Apps for scale and resilience
Design and configure Web Apps for scale and resilience
Define and manage App Service plans
An App Service plan defines the supported feature set and capacity of a group of virtual machine resources that are hosting one or more web apps, logic apps, mobile apps, or API apps (this section discusses web apps specifically, and the other resources are covered in later sections in this chapter).
Each App Service plan is configured with a pricing tier (for example, Free, Shared, Basic, and Standard), and each tier describes its own set of capabilities and cost. An App Service plan is unique to the region, resource group, and subscription. In other words, two web apps can participate in the same App Service plan only when they are created in the same subscription, resource group, and region (with the same pricing tier requirements).
This section describes how to create a new App Service plan without creating a web app, and how to create a new App Service plan while creating a web app. It also reviews some of the settings that can be useful for managing the App Service plan.
Creating a new App Service plan
To create a new App Service plan in the portal, complete the following steps:
Navigate to the portal accessed via https://portal.azure.com.
Select New on the command bar.
Within the Marketplace (Figure 4-1) search text box, type App Service Plan and press Enter.
Select App Service Plan from the results.
On the App Service Plan blade, select Create.
On the New App Service Plan blade (Figure 4-2), provide a name for your App Service plan, choose the subscription, resource group, operating system (Windows or Linux), and location into which you want to deploy. You should also confirm and select the desired pricing tier.
Click Create to create the new App Service plan.


Following the creation of the new App Service plan, you can create a new web app and associate this with the previously created App Service plan. Or, as discussed in the next section, you can create a new App Service plan as you create a new web app.
Creating a new Web App and App Service plan
To create a new Web App and a new App Service plan in the portal, complete the following steps:
Navigate to the portal accessed via https://portal.azure.com.
Select New on the command bar.
Within the Marketplace list (Figure 4-3), select the Web + Mobile option.
On the Web + Mobile blade, select Web App.
On the Web App blade (Figure 4-4), provide an app name, choose the subscription, resource group, operating system (Windows or Linux), and choose a setting for Application Insights. You also select the App Service plan into which you want to deploy.
When you click the App Service plan selection, you can choose an existing App Service plan, or create a new App Service plan. To create a new App Service plan, click Create New from the App Service Plan blade.
From the New App Service Plan blade (Figure 4-5), choose a name for the App Service plan, select a location, and select a pricing tier. Click OK and the new App Service plan is created with these settings.
From the Web App blade, click Create to create the web app and associate it with the new App Service plan.


Review App Service plan settings
Once you’ve created a new App Service plan, you can select the App Service plan in the portal and manage relevant settings including managing web apps and adjusting scale.
To manage an App Service plan, complete the following steps:
Navigate to the portal accessed via https://portal.azure.com.
Select More Services on the command bar.
In the filter text box, type App Service Plans, and select App Service Plans (Figure 4-6).
Review the list of App Service plans (Figure 4-7). Note the number of apps deployed to each is shown in the list. You can also see the pricing tiers. Select an App Service plan from the list to navigate to the App Service Plan blade.
From the left navigation pane, select Apps to view the apps that are deployed to the App Service plan (Figure 4-8). You can select from the list of apps to navigate to the app blade and manage its settings.
From the left navigation pane, select Scale Up to choose a new pricing tier for the App Service plan.
From the left navigation pane, select Scale Out to increase or decrease the number of instances of the App Service plan, or to configure Autoscale settings.


Configure Web App settings
Azure Web Apps provide a comprehensive collection of settings that you can adjust to establish the environment in which your web application runs, as well as tools to define and manage the values of settings used by your web application code. You can configure the following groups of settings for your applications:
![]() Application type and library versions
Application type and library versions
![]() Load balancing
Load balancing
![]() Slot management
Slot management
![]() Debugging
Debugging
![]() App settings and connection strings
App settings and connection strings
![]() IIS related settings
IIS related settings
To manage Web App settings follow these steps:
Navigate to the blade of your web app in the portal accessed via https://portal.azure.com.
Select the Application settings tab from the left navigation pane. The setting blade appears to the right.
Choose from the general settings required for the application:
Choose the required language support from .NET Framework, PHP, Java, or Python, and their associated versions.
Choose between 32bit and 64bit runtime execution.
Choose web sockets if you are building a web application that leverages this feature from the browser.
Choose Always On if you do not want the web application to be unloaded when idle. This reduces the load time required for the next request and is a required setting for web jobs to run effectively.
Choose the type of managed pipeline for IIS. Integrated is the more modern pipeline and Classic would only be used for legacy applications (Figure 4-9).
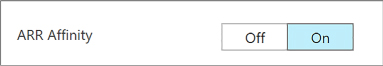
Choose your setting for ARR affinity (Figure 4-10). If you choose to enable ARR affinity your users will be tied to a particular host machine (creating a sticky session) for the duration of their session. If you disable this, your application will not create a sticky session and your application is expected to support load balancing between machines within a session.
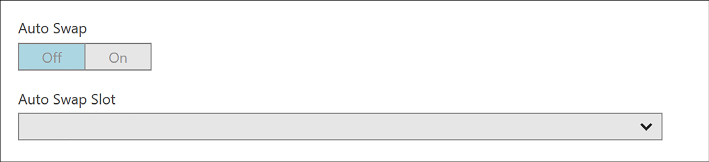
When you first create your web app, the auto swap settings are not available to configure. You must first create a new slot, and from the slot you may configure auto swap to another slot (Figure 4-11).
Enable remote debugging (Figure 4-12) if you run into situations where deployed applications are not functioning as expected. You can enable remote debugging for Visual Studio versions 2012, 2013, 2015, and 2017.
Configure the app settings required for your application. These app settings (Figure 4-13) override any settings matching the same name from your application.
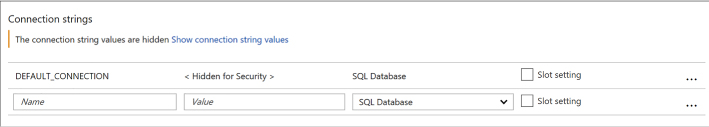
Configure any connection strings for your application (Figure 4-14). These connection string settings override any settings matching the same key name from your application configuration. For connection strings, once you create the settings, save, and later return to the application settings blade; those settings are hidden unless you select it to show the value again.
Configure IIS settings related to default documents, handlers, and virtual applications and directories required for your application (Figure 4-15). This allows you to control these IIS features related to your application.


Configure Web App certificates and custom domains
When you first create your web app, it is accessible through the subdomain you specified in the web app creation process, where it takes the form <yourwebappname>.azurewebsites.net. To map to a more user-friendly domain name (such as contoso.com), you must set up a custom domain name.
If your website will use HTTPS to secure communication between it and the browser using Transport Layer Security (TLS), more commonly (but less accurately) referred to in the industry as Secure Socket Layer (SSL), you need to utilize an SSL certificate. With Azure Web Apps, you can use an SSL certificate with your web app in one of two ways:
![]() You can use the “built-in” wildcard SSL certificate that is associated with the *.azurewebsites.net domain.
You can use the “built-in” wildcard SSL certificate that is associated with the *.azurewebsites.net domain.
![]() More commonly you use a certificate you purchase for your custom domain from a third-party certificate authority.
More commonly you use a certificate you purchase for your custom domain from a third-party certificate authority.
Mapping custom domain names
Web Apps support mapping to a custom domain that you purchase from a third-party registrar either by mapping the custom domain name to the virtual IP address of your website or by mapping it to the <yourwebappname>.azurewebsites.net address of your website. This mapping is captured in domain name system (DNS) records that are maintained by your domain registrar. Two types of DNS records effectively express this purpose:
![]() A records (or, address records) map your domain name to the IP address of your website.
A records (or, address records) map your domain name to the IP address of your website.
![]() CNAME records (or, alias records) map a subdomain of your custom domain name to the canonical name of your website, expressed as <yourwebappname>.azurewebsites.net.
CNAME records (or, alias records) map a subdomain of your custom domain name to the canonical name of your website, expressed as <yourwebappname>.azurewebsites.net.
Table 4-1 shows some common scenarios along with the type of record, the typical record name, and an example value based on the requirements of the mapping.
TABLE 4-1 Mapping domain name requirements to DNS record types, names, and values
Requirement |
Type of Record |
Record Name |
Record Value |
contoso.com should map to my web app IP address |
A |
@ |
138.91.240.81 IP address |
contoso.com and all subdomains demo.contoso.com and www.contoso.com should map to my web app IP address |
A |
* |
138.91.240.81 IP address |
www.contoso.com should map to my web app IP address |
A |
www |
138.91.240.81 IP address |
www.contoso.com should map to my web app canonical name in Azure |
CNAME |
www |
Canonical name in Azure |
Note that whereas A records enable you to map the root of the domain (like contoso.com) and provide a wildcard mapping for all subdomains below the root (like www.contoso.com and demo.contoso.com), CNAME records enable you to map only subdomains (like the www in www.contoso.com).
Configuring a custom domain
To configure a custom domain, you need access to your domain name registrar setup for the domain while also editing configuration for your web app in the Azure portal.

Exam Tip
Use of a custom domain name is not supported by the Free App Service plan pricing tier. All other pricing tiers including Shared, Basic, Standard, and Premium support custom domains.
These are the high-level steps for creating a custom domain name for your web app:
Navigate to the blade of your web app in the portal accessed via https://portal.azure.com.
Ensure your web app uses an App Service plan that supports custom domains.
Click Custom Domains from the left navigation pane.
On the Custom Domains blade (Figure 4-16) note the external IP address of your web app.
Select Add Hostname to open the Add Hostname blade. Enter the hostname and click Validate for the portal to validate the state of the registrar setup with respect to your web app. You can then choose to set up an A record or CNAME record (Figure 4-17).
To set up an A record, select A Record and follow the instructions provided in the blade. It guides you through the following steps for an A record setup:
You first add a TXT record at your domain name registrar, pointing to the default Azure domain for your web app, to verify you own the domain name. The new TXT record should point to <yourwebappname>.azurewebsites.net.
In addition, you add an A record pointing to the IP address shown in the blade, for your web app.
To set up a CNAME record, select CNAME record, and follow the instructions provided in the blade.
If using a CNAME record, following the instructions provided by your domain name registrar, add a new CNAME record with the name of the subdomain, and for the value, specify your web app’s default Azure domain with <yourwebappname>.azurewebsites.net.
Save your DNS changes. Note that it may take some time for the changes to propagate across DNS. In most cases, your changes are visible within minutes, but in some cases, it may take up to 48 hours. You can check the status of your DNS changes by doing a DNS lookup using third-party websites like http://mxtoolbox.com/DNSLookup.aspx.
After completing the domain name registrar setup, from the Custom Domains blade, click Add Hostname again to configure your custom domain. Enter the domain name and select Validate again. If validation has passed, select Add Hostname to complete the assignment.


Configuring SSL certificates
To configure SSL certificates for your custom domain, you first need to have access to an SSL certificate that includes your custom domain name, including the CNAME if it is not a wildcard certificate.
To assign an SSL certificate to your web app, follow these steps:
Navigate to the blade of your web app in the portal accessed via https://portal.azure.com.
Click SSL certificates from the left navigation pane.
From the SSL certificates (Figure 4-18) blade you may choose to import an existing app service certificate, or upload a new certificate.
You can then select Add Binding to set up the correct binding. You can set up bindings that point at your naked domain (contoso.com), or to a particular CNAME (www.contoso.com, demo.contoso.com), so long as the certificate supports it.
You can choose between Server Name Indication (SNI) or IP based SSL when you create the binding for your custom domain (Figure 4-19).


Manage Web Apps by using the API, Azure PowerShell, and Xplat-CLI
In addition to configuring and managing Web Apps via the Azure portal, programmatic or script-based access is available for much of this functionality and can satisfy many development requirements.
The options for this include the following:
![]() Azure Resource Manager (ARM) Azure Resource Manager provides a consistent management layer for the management tasks you can perform using Azure PowerShell, Azure CLI, Azure portal, REST API, and other development tools. For more information on this see https://docs.microsoft.com/en-us/azure/azure-resource-manager/.
Azure Resource Manager (ARM) Azure Resource Manager provides a consistent management layer for the management tasks you can perform using Azure PowerShell, Azure CLI, Azure portal, REST API, and other development tools. For more information on this see https://docs.microsoft.com/en-us/azure/azure-resource-manager/.
![]() REST API The REST API enables you to deploy and manage Azure infrastructure resources using HTTP request and JSON payloads. For more details on this see https://docs.microsoft.com/en-us/rest/api/resources/.
REST API The REST API enables you to deploy and manage Azure infrastructure resources using HTTP request and JSON payloads. For more details on this see https://docs.microsoft.com/en-us/rest/api/resources/.
![]() Azure PowerShell Azure PowerShell provides cmdlets for interacting with Azure Resource Manager to manage infrastructure resources. The PowerShell modules can be installed to Windows, macOS, or Linux. For additional details see https://docs.microsoft.com/en-us/powershell/azure/overview.
Azure PowerShell Azure PowerShell provides cmdlets for interacting with Azure Resource Manager to manage infrastructure resources. The PowerShell modules can be installed to Windows, macOS, or Linux. For additional details see https://docs.microsoft.com/en-us/powershell/azure/overview.
![]() Azure CLI Azure CLI (also known as XplatCLI) is a command line experience for managing Azure resources. This is an open source SDK that works on Windows, macOS, and Linux platforms to create, manage, and monitor web apps. For details see https://docs.microsoft.com/en-us/cli/azure/overview.
Azure CLI Azure CLI (also known as XplatCLI) is a command line experience for managing Azure resources. This is an open source SDK that works on Windows, macOS, and Linux platforms to create, manage, and monitor web apps. For details see https://docs.microsoft.com/en-us/cli/azure/overview.
Implement diagnostics, monitoring, and analytics
Without diagnostics, monitoring, and analytics, you cannot effectively investigate the cause of a failure, nor can you proactively prevent potential problems before your users experience them. Web Apps provide multiple forms of logs, features for monitoring availability and automatically sending email alerts when the availability crosses a threshold, features for monitoring your web app resource usage, and integration with Azure Analytics via Application Insights.
Exam Tip
App Services are also governed by quotas depending on the App Service plan you have chosen. Free and Shared apps have CPU, memory, bandwidth, and filesystem quotas; when reached the web app no longer runs until the next cycle, or the App Service plan is changed. Basic, Standard, and Premium App Services are only limited by filesystem quotas based on the SKU size selected for the host.
Configure diagnostics logs
A web app can produce many different types of logs, each focused on presenting a particular source and format of diagnostic data. The following list describes each of these logs:
![]() Event Log The equivalent of the logs typically found in the Windows Event Log on a Windows Server machine, this is a single XML file on the local file system of the web application. In the context of web apps, the Event Log is particularly useful for capturing unhandled exceptions that may have escaped the application’s exception handling logic and surfaced to the web server. Only one XML file is created per web app.
Event Log The equivalent of the logs typically found in the Windows Event Log on a Windows Server machine, this is a single XML file on the local file system of the web application. In the context of web apps, the Event Log is particularly useful for capturing unhandled exceptions that may have escaped the application’s exception handling logic and surfaced to the web server. Only one XML file is created per web app.
![]() Web server logs Web server logs are textual files that create a text entry for each HTTP request to the web app.
Web server logs Web server logs are textual files that create a text entry for each HTTP request to the web app.
![]() Detailed error message logs These HTML files are generated by the web server and log the error messages for failed requests that result in an HTTP status code of 400 or higher. One error message is captured per HTML file.
Detailed error message logs These HTML files are generated by the web server and log the error messages for failed requests that result in an HTTP status code of 400 or higher. One error message is captured per HTML file.
![]() Failed request tracing logs In addition to the error message (captured by detailed error message logs), the stack trace that led to a failed HTTP request is captured in these XML documents that are presented with an XSL style sheet for in-browser consumption. One failed request trace is captured per XML file.
Failed request tracing logs In addition to the error message (captured by detailed error message logs), the stack trace that led to a failed HTTP request is captured in these XML documents that are presented with an XSL style sheet for in-browser consumption. One failed request trace is captured per XML file.
![]() Application diagnostic logs These text-based trace logs are created by web application code in a manner specific to the platform the application is built in using logging or tracing utilities.
Application diagnostic logs These text-based trace logs are created by web application code in a manner specific to the platform the application is built in using logging or tracing utilities.
To enable these diagnostic settings from the Azure portal, follow these steps:
Navigate to the blade of your web app in the portal accessed via https://portal.azure.com.
Select the Diagnostics Logs tab from the left navigation pane. The Diagnostics Logs blade (Figure 4-20) will appear to the right. From this blade you can choose to configure the following:
Enable application logging to the file system for easy access through the portal.
Enable storing application logs to blob storage for longer term access.
Enable Web Server logging to the file system or to blob storage for longer term access.
Enable logging detailed error messages.
Enable logging failed request messages.
If you enable files system logs for application and Web Server logs, you can view those from the Log Streaming tab (Figure 4-21).
You can access more advanced debugging and diagnostics tools from the Advanced Tools tab (Figure 4-22).


Table 4-2 describes where to find each type of log when retrieving diagnostic data stored in the web app’s local file system. The Log Files folder is physically located at D:homeLogFiles.
TABLE 4-2 Locations of the various logs on the web app’s local file system
Log Type |
Location |
Event Log |
LogFileseventlog.xml |
Web server logs |
LogFileshttpRawLogs*.log |
Detailed error message logs |
LogFilesDetailedErrorsErrorPage######.htm |
Failed request tracing logs |
LogFilesW3SVC**.xml |
Application diagnostic logs (.NET) |
LogFilesApplication*.txt |
Deployment logs |
LogFilesGit. This folder contains logs generated by the internal deployment processes used by Azure web apps, as well as logs for Git deployments |
Exam Tip
You can retrieve diagnostics logs data by using Visual Studio Server Explorer, the Site Control Management (SCM) website (also known as Kudu), the command line in Windows PowerShell or the xplat-cli, or direct download via FTP to query Table or Blob storage.
Configure endpoint monitoring
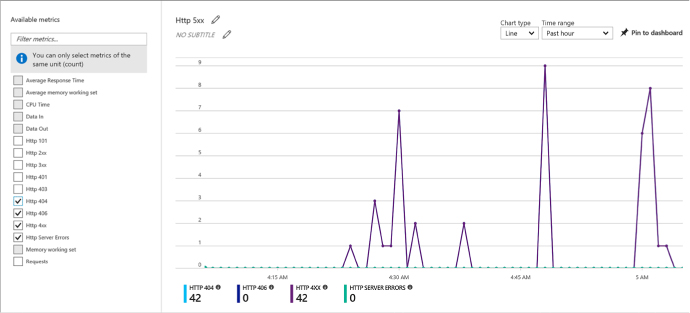
App Services provide features for monitoring your applications directly from the Azure portal. There are many metrics available for monitoring, as listed in Table 4-3.
TABLE 4-3 List of available metrics that are monitored for your web apps
METRIC |
DESCRIPTION |
Average Response Time |
The average time taken for the app to serve requests in ms. |
Average memory working set |
The average amount of memory in MiBs used by the app. |
CPU Time |
The amount of CPU in seconds consumed by the app. |
Data In |
The amount of incoming bandwidth consumed by the app in MiBs. |
Data Out |
The amount of outgoing bandwidth consumed by the app in MiBs. |
Http 2xx |
Count of requests resulting in a http status code >= 200 but < 300. |
Http 3xx |
Count of requests resulting in a http status code >= 300 but < 400. |
Http 401 |
Count of requests resulting in HTTP 401 status code. |
Http 403 |
Count of requests resulting in HTTP 403 status code. |
Http 404 |
Count of requests resulting in HTTP 404 status code. |
Http 406 |
Count of requests resulting in HTTP 406 status code. |
Http 4xx |
Count of requests resulting in a http status code >= 400 but < 500. |
Http Server Errors |
Count of requests resulting in a http status code >= 500 but < 600. |
Memory working set |
Current amount of memory used by the app in MiBs. |
Requests |
Total number of requests regardless of their resulting HTTP status code. |
You can monitor metrics from the portal and customize which metrics should be shown by following these steps:
Navigate to the blade of your web app in the portal accessed via https://portal.azure.com.
Select the Overview tab from the left navigation pane. This pane shows a few default charts for metrics including server errors, data in and out, requests, and average response time (Figure 4-23 and 4-24).
You can customize the metrics (Figure 4-25) shown by creating new graphs and pinning those to your dashboard.
Click one of the graphs. You’ll be taken to edit the metrics blade for the graph, limited to compatible metrics for the selection.
Select the metrics to add or remove from the graph.
Save the graph to the dashboard. You can now navigate to your portal dashboard to view the selected metrics without having to navigate to the web app directly. From here you can also edit the graph by selecting it, editing metrics, and saving back to the same pinned graph.
You can also add alerts for metrics. From the Metrics blade click Add Metric alert from the command bar at the top of the blade. This takes you to the Add Rule blade (Figure 4-26) where you can configure the alert. To configure an alert for slow requests, as an example, do the following:
Provide a name for the rule.
Optionally change the subscription, resource group, and resource but it will default to the current web app.
Choose Metrics for the alert type.
Choose the metric from the drop-down list (Figure 4-27), in this case Average Response Time with a condition greater than a threshold of 2 seconds over a 15 minute period.
From the same blade you can also indicate who to notify, configure a web hook, or even configure a Logic App to produce a workflow based on the alert.
Click OK to complete the alert configuration.
You can view the alerts from the Alerts tab of the navigation pane.


Design and configure Web Apps for scale and resilience
App Services provide various mechanisms to scale your web apps up and down by adjusting the number of instances serving requests and by adjusting the instance size. You can, for example, increase the number of instances (scale out) to support the load you experience during business hours, but then decrease (scale in) the number of instances during less busy hours to save costs. Web Apps enable you to scale the instance count manually, automatically via a schedule, or automatically according to key performance metrics. Within a datacenter, Azure load balances traffic between all of your Web Apps instances using a round-robin approach.
You can also scale a web app by deploying to multiple regions around the world and then utilizing Microsoft Azure Traffic Manager to direct web app traffic to the appropriate region based on a round robin strategy or according to performance (approximating the latency perceived by clients of your application). Alternately, you can configure Traffic Manager to use the alternate regions as targets for failover if the primary region becomes unavailable.
In addition to scaling instance counts, you can manually adjust your instance size (scale up or down). For example, you can scale up your web app to utilize more powerful VMs that have more RAM memory and more CPU cores to serve applications that are more demanding of memory consumption or CPU utilization, or scale down your VMs if you later discover your requirements are not as great.
Exam Tip
Web Apps provide a high availability SLA of 99.9 percent using only a single standard instance. You do not need to provision more than one instance to benefit from this SLA.
To scale your web app, follow these steps:
Navigate to the blade of your web app in the portal accessed via https://portal.azure.com.
Select the App Service plan tab from the left navigation pane. This takes you to the App Service Plan blade.
Select the Scale Up tab from the left navigation pane and you’ll be taken to a blade to select the new pricing tier for your web app VMs.
Select the Scale Out tab and you’ll be taken to the Scale Out blade to choose the number of instances to scale out or into (Figure 4-28).
If you select Enable autoscale, you can create conditions based on metrics and rules in order for the site to automatically adjust instance count.

Skill 4.2: Design Azure App Service API Apps
Azure API Apps provide a quick and easy way to create and consume scalable RESTful APIs, using the language of your choice, in the cloud. As part of the Azure infrastructure, you can integrate API Apps with many Azure services such as API Management, Logic Apps, Functions, and many more. Securing your APIs can be done with a few clicks, whether you are using Azure Active Directory, OAuth, or social networks for single sign-on.
If you have existing APIs written in .NET, Node.js, Java, Python, or PHP, they can be brought into App Services as API Apps. When you need to consume these APIs, enable CORS support so you can access them from any client. Swagger support makes generating client code to use your API simple. Once you have your API App set up, and clients are consuming it, it is important to know how to monitor it to detect any issues early on.
This skill covers how to:
![]() Create and deploy API Apps
Create and deploy API Apps
![]() Automate API discovery by using Swashbuckle
Automate API discovery by using Swashbuckle
![]() Use Swagger API metadata to generate client code for an API app
Use Swagger API metadata to generate client code for an API app
![]() Monitor API Apps
Monitor API Apps
Create and deploy API Apps
There are different ways you can create and deploy API Apps, depending on the language and development environment of choice. For instance, if you are using Visual Studio, you can create a new API Apps project and publish to a new API app, which provisions the service in Azure. If you are not using Visual Studio, you can provision a new API App service using the Azure portal, Azure CLI, or PowerShell.
Creating a new API App from the portal
To create a new API app in the portal, complete the following steps:
Navigate to the portal accessed via https://portal.azure.com.
Select New on the command bar.
Within the Marketplace (Figure 4-29) search text box, type API App, and press Enter.
Select API App from the results.
On the API App blade, select Create.
On the Create API App blade, choose your Azure subscription, select a Resource Group, select or create an App Service Plan, select whether you want to enable Application Insights, and then click Create.

Creating and deploying a new API app with Visual Studio 2017
Visual Studio 2017 comes preconfigured with the ability to create an API app when you have installed the ASP.NET and web development, as well as Azure development workloads. Follow these steps to create a new API app with Visual Studio 2017:
Launch Visual Studio, and then select File > New > Project.
In the New Project dialog, select ASP.NET Web Application (.NET Framework) within the Cloud category (Figure 4-30). Provide a name and location for your new project, and then click OK.

FIGURE 4-30 The ASP.NET Web Application Cloud project type
Select the Azure API App template (Figure 4-31), and then click OK.

Visual Studio creates a new API App project within the specified directory, adding useful NuGet packages, such as:
![]() Newtonsoft.Json for deserializing requests and serializing responses to and from your API app.
Newtonsoft.Json for deserializing requests and serializing responses to and from your API app.
![]() Swashbuckle to add Swagger for rich discovery and documentation for your API REST endpoints.
Swashbuckle to add Swagger for rich discovery and documentation for your API REST endpoints.
In addition, Web API and Swagger configuration classes are created in the project’s startup folder. All you need to do from this point, to deploy your API app is to complete your Controller actions, and publish from Visual Studio.
Follow these steps to deploy your API app from Visual Studio:
Right-click your project in the Visual Studio Solution Explorer (Figure 4-32), then click Publish.
In the Publish dialog (Figure 4-33), select the Create New option underneath Microsoft Azure App Service, and then click Publish. This creates a new API app in Azure and publishes your solution to it. You could alternately select the Select Existing option to publish to an existing API App service.
In the Create App Service dialog (Figure 4-34), provide a unique App name, select your Azure subscription and resource group, select or create an App Service Plan, and then click Create.
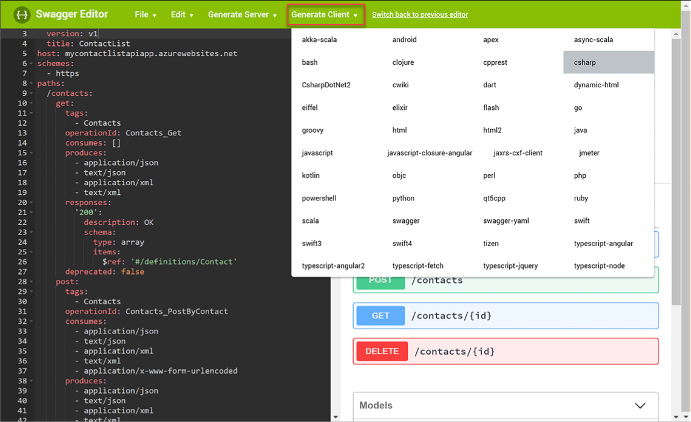
When your API app is finished publishing, it will open in a new web browser. When the page is displayed, navigate to the /swagger path to view your generated API details, and to try out the REST methods. For example http://<YOUR-API-APP>.azurewebsites.net/swagger/ (Figure 4-35).


Automate API discovery by using Swashbuckle
Swagger is a popular, open source framework backed by a large ecosystem of tools that helps you design, build, document, and consume your RESTful APIs. The previous section included a screenshot of the Swagger page generated for an API App. This was generated by the Swashbuckle NuGet package.
The core component of Swagger is the Swagger Specification, which is the API description metadata in the form of a JSON or YAML file. The specification creates the RESTful contract for your API, detailing all its resources and operations in a human and machine-readable format to simplify development, discovery, and integration with other services. This is a standardized OpenAPI Specification (OAS) for defining RESTful interfaces, which makes the generated metadata valuable when working with a wide range of consumers. Included in the list of consumers that can read the Swagger API metadata are several Azure services, such as Microsoft PowerApps, Microsoft Flow, and Logic Apps. Meaning, when you publish your API App service with Swagger, these Azure services and more immediately know how to interact with your API endpoints with no further effort on your part.
Beyond other Azure services being able to more easily use your API App, Swagger RESTful interfaces make it easier for other developers to consume your API endpoints. The API explorer that comes with swagger-ui makes it easy for other developers (and you) to test the endpoints and know what the data format looks like that need to be sent and should be returned in kind.
Generating this Swagger metadata manually can be a very tedious process. If you build your API using ASP.NET or ASP.NET Core, you can use the Swashbuckle NuGet package to automatically do this for you, saving a lot of time initially creating the metadata, and maintaining it. In addition to its Swagger metadata generator engine, Swashbuckle also contains an embedded version of swagger-ui, which it will automatically serve up once Swashbuckle is installed.
Use Swashbuckle in your API App project
Swashbuckle is provided by way of a set of NuGet packages: Swashbuckle and Swashbuckle.Core. When you create a new API App project using the Visual Studio template, these NuGet packages are already included. If you don’t have them installed, follow these steps to add Swashbuckle to your API App project:
Install the Swashbuckle NuGet package, which includes Swashbuckle.Core as a dependency, by using the following command from the NuGet Package Manager Console:
Install-Package Swashbuckle
The NuGet package also installs a bootstrapper (App_Start/SwaggerConfig.cs) that enables the Swagger routes on app start-up using WebActivatorEx. You can configure Swashbuckle’s options by modifying the GlobalConfiguration.Configuration.EnableSwagger extension method in SwaggerConfig.cs. For example, to exclude API actions that are marked as Obsolete, add the following configuration:
public static void Register()
{
var thisAssembly = typeof(SwaggerConfig).Assembly;
GlobalConfiguration.Configuration
.EnableSwagger(c =>
{
…
…
// Set this flag to omit descriptions for any actions
decorated with the Obsolete attribute
c.IgnoreObsoleteActions();
…
…
});
}Modify your project’s controller actions to include Swagger attributes to aid the generator in building your Swagger metadata. Listing 4-1 illustrates the use of the SwaggerResponseAttribute at each controller method.
Swashbuckle is now configured to generate Swagger metadata for your API endpoints with a simple UI to explore that metadata. For example, the controller in Listing 4-1 may produce the UI shown in Figure 4-36.

LISTING 4-1 C# code showing Swagger attributes added to the API App’s controller actions
/// <summary>
/// Gets the list of contacts
/// </summary>
/// <returns>The contacts</returns>
[HttpGet]
[SwaggerResponse(HttpStatusCode.OK,
Type = typeof(IEnumerable<Contact>))]
[Route("~/contacts")]
public async Task<IEnumerable<Contact>> Get()
{
…
}
/// <summary>
/// Gets a specific contact
/// </summary>
/// <param name="id">Identifier for the contact</param>
/// <returns>The requested contact</returns>
[HttpGet]
[SwaggerResponse(HttpStatusCode.OK,
Description = "OK",
Type = typeof(IEnumerable<Contact>))]
[SwaggerResponse(HttpStatusCode.NotFound,
Description = "Contact not found",
Type = typeof(IEnumerable<Contact>))]
[SwaggerOperation("GetContactById")]
[Route("~/contacts/{id}")]
public async Task<Contact> Get([FromUri] int id)
{
…
}
/// <summary>
/// Creates a new contact
/// </summary>
/// <param name="contact">The new contact</param>
/// <returns>The saved contact</returns>
[HttpPost]
[SwaggerResponse(HttpStatusCode.Created,
Description = "Created",
Type = typeof(Contact))]
[Route("~/contacts")]
public async Task<Contact> Post([FromBody] Contact contact)
{
…
}
You can test any of the API methods by selecting it from the list. Here we selected the /contacts/{id} GET method and tested it by entering a value of 2 in the id parameter, and clicking the Try It Out! button. Notice that Swagger details the return model schema, shows a Curl command and a Request URL for invoking the method, and shows the actual response body after clicking the button (Figure 4-37).

Enable CORS to allow clients to consume API and Swagger interface
Before clients, such as other web services or client code generators, can consume your API endpoints and Swagger interface, you need to enable CORS on the API App in Azure. To enable CORS, follow these steps:
Navigate to the portal accessed via https://portal.azure.com.
Open your API App service. You can find this by navigating to the Resource Group in which you published your service.
Select CORS from the left-hand menu (Figure 4-38). Enter one or more allowed origins, then select Save. To allow all origins, enter an asterisk (*) in the Allowed Origins field and remove all other origins from the list.

Use Swagger API metadata to generate client code for an API app
There are tools available to generate client code for your API Apps that have Swagger API definitions, like the swagger.io online editor. The previous section demonstrated how you can automatically generate the Swagger API metadata, using the Swashbuckle NuGet package.
To generate client code for your API app that has Swagger API metadata, follow these steps:
Find your Swagger 2.0 API definition document by navigating to http://<your-api-app/swagger/docs/v1 (v1 is the API version). Alternately, you can find it by navigating to the Azure portal, opening your API App service, and selecting API definition from the left-hand menu. This displays your Swagger 2.0 API definition URL (Figure 4-39).
Navigate to https://editor.swagger.io to use the Swagger.io Online Editor.
Select File > Import URL. Enter your Swagger 2.0 metadata URL in the dialog box and click OK (Figure 4-40).
After a few moments, your Swagger metadata appears on the left-hand side of the editor, and the discovered API endpoints will be displayed on the right. Verify that all desired API endpoints appear, and then select Generate Client from the top menu. Select the desired language or platform for the generated client app. This initiates a download of a zip file containing the client app (Figure 4-41).


Monitor API Apps
App Service, under which API Apps reside, provides built-in monitoring capabilities, such as resource quotas and metrics. You can also set up alerts and automatic scaling based on these metrics. In addition, Azure provides built-in diagnostics to assist with debugging an App Service web or API app. A combination of the monitoring capabilities and logging should provide you with the information you need to monitor the health of your API app, and determine whether it is able to meet capacity demands.
Using quotas and metrics
API Apps are subject to certain limits on the resources they can use. The limits are defined by the App Service plan associated with the app. If the application is hosted in a Free or Shared plan, and then the limits on the resources the app can use are defined by Quotas, as discussed earlier for Web Apps.
If you exceed the CPU and bandwidth quotas, your app will respond with a 403 HTTP error, so it’s best to keep an eye on your resource usage. Exceeding memory quotas causes an application reset, and exceeding the filesystem quota will cause write operations to fail, even to logs. If you need to increase or remove any of these quotas, you can upgrade your App Service plan.
Metrics that you can view pertaining to your apps are the same as shown earlier in Table 4-3. As with Web Apps, metrics are accessed from the Overview blade of your API App within the Azure portal by clicking one of the metrics charts, such as Requests or Average Response Time. Once you click a chart, you can customize it by clicking it and selecting edit chart. From here you can change the time range, chart type, and metrics to display.
Enable and review diagnostics logs
By default, when you provision a new API App, diagnostics logs are disabled. These are detailed server logs you can use to troubleshoot and debug your app. To enable diagnostics logging, perform the following steps:
Navigate to the portal accessed via https://portal.azure.com.
Open your API App service. You can find this by navigating to the Resource Group in which you published your service.
Select Diagnostics logs from the left-hand menu (Figure 4-42). Turn on any logs you wish to capture. When you enable application diagnostics, you also choose the Level. This setting allows you to filter the information captured to informational, warning, or error information. Setting this to verbose will log all information produced by the application. This is also where you can go to retrieve FTP information for downloading the logs.

You can download the diagnostics logs via FTP, or they can be downloaded as a zip archive by using PowerShell or the Azure CLI.
The types of logs and structure for accessing logs follow that described for Web Apps and shown in Table 4-2.
Skill 4.3: Develop Azure App Service Logic Apps
Azure Logic Apps is a fully managed iPaaS (integration Platform as a Service) that helps you simplify and implement scalable integrations and workflows in the cloud. As such, you don’t have to worry about infrastructure, management, scalability, and availability because all of that is taken care of for you. Its Logic App Designer gives you a nice way to model and automate your process visually, as a series of steps known as a workflow. At its core, it allows you to quickly integrate with many services and protocols, inside of Azure, outside of Azure, as well as on-premises. When you create a Logic App, you start out with a trigger, like ‘When an email arrives at this account,’ and then you act on that trigger with many combinations of actions, condition logic, and conversions.
This skill covers how to:
![]() Create a Logic App connecting SaaS services
Create a Logic App connecting SaaS services
![]() Create a Logic App with B2B capabilities
Create a Logic App with B2B capabilities
![]() Create a Logic App with XML capabilities
Create a Logic App with XML capabilities
![]() Trigger a Logic App from another app
Trigger a Logic App from another app
![]() Create custom and long-running actions
Create custom and long-running actions
![]() Monitor Logic Apps
Monitor Logic Apps
Create a Logic App connecting SaaS services
One of the strengths of Logic Apps is its ability to connect a large number of SaaS (Software as a Service) services to create your own custom workflows. In this example, we will connect Twitter with an Outlook.com or hosted Office 365 mailbox to email certain tweets as they arrive.
To create a new Logic App in the portal, complete the following steps:
Navigate to the portal accessed via https://portal.azure.com.
Select New on the command bar.
Select Enterprise Integration, then Logic App (Figure 4-43).
Provide a unique name, select a resource group and location, check Pin To Dashboard, and then click Create (Figure 4-44).


Follow the above steps to create new Logic Apps as needed in the remaining segments for this skill.
Once the Logic App has been provisioned, open it to view the Logic Apps Designer. This is where you design or modify your Logic App. You can select from a series of commonly used triggers, or from several templates you can use as a starting point. The following steps show how to create one from scratch.
Select Blank Logic App under Templates.
All Logic Apps start with a trigger. Search the list for Twitter, and then select it.
Click Sign in to create a connection to Twitter with your Twitter account. A dialog will appear where you sign in and authorize the Logic App to access your account.
In the Twitter trigger form on the designer (Figure 4-45), enter your search text to return certain tweets (such as #nasa), and select an interval and frequency, establishing how often you wish to check for items, returning all tweets during that time span.
Select the + New Step button, and then choose Add An Action.
Type outlook in the search box, and then select Office 365 Outlook (Send An Email) from the results. Alternately, you can select Outlook.com from the list (Figure 4-46).
Click Sign In to create a connection to your Office 365 Outlook account (Figure 4-47).
In the Send An Email form, provide values for the email recipient, the subject of the email, and the body. In each of these fields, you can select parameters from the Twitter Connector, such as the tweet’s text and who posted it.
Click Save in the Logic Apps Designer menu. Your Logic App is now live. If you wish to test right away and not wait for your trigger interval, click Run.


Create a Logic App with B2B capabilities
Logic Apps support business-to-business (B2B) workflows and communication through the Enterprise Integration Pack. This allows organizations to exchange messages electronically, even if they use different protocols and formats. Enterprise integration allows you to store all your artifacts in one place, within your integration account, and secure messages through encryption and digital signatures. To access these artifacts from a logic app, you must first link it to your integration account. Your integration account needs both Partner and Agreement artifacts prior to creating B2B workflows for your logic app.
Create an integration account
To get started with the Enterprise Integration Pack so you can create B2B workflows, you must first create an integration account, following these steps:
Navigate to the portal accessed via https://portal.azure.com.
Select More Services on the command bar.
In the filter box, type integration, and then select Integration Accounts in the results list (Figure 4-48).
At the top of the Integration Accounts blade, select + Add.
Provide a name for your Integration Account (Figure 4-49), select your resource group, location, and a pricing tier. Once validation has passed, click Create.


Add partners to your integration account
Partners are entities that participate in B2B transactions and exchange messages between each other. Before you can create partners that represent you and another organization in these transactions, you must both share information that identifies and validates messages sent by each other. After you discuss these details and are ready to start your business relationship, you can create partners in your integration account to represent you both. These message details are called agreements. You need at least two partners in your integration account to create an agreement. Your organization must be the host partner, and the other partner(s) guests. Guest partners can be outside organizations, or even a department in your own organization.
To add a partner to your integration account, follow these steps:
Navigate to the portal accessed via https://portal.azure.com.
Select More Services on the command bar.
In the filter box, type integration, then select Integration Accounts in the results list.
Select your integration account, and then select the Partners tile.
In the Partners blade, select + Add.
Provide a name for your partner (Figure 4-50), select a Qualifier, and then enter a Value to help identify documents that transfer through your apps. When finished, click OK.
After a few moments, the new partner (Figure 4-51) will appear in your list of partners.


Add an agreement
Now that you have partners associated with your integration account, you can allow them to communicate seamlessly using industry standard protocols through agreements. These agreements are based on the type of information exchanged, and through which protocol or transport standards they will communicate: AS2, X12, or EDIFACT.
Follow these steps to create an AS2 agreement:
Navigate to the portal accessed via https://portal.azure.com.
Select More Services on the command bar.
In the filter box, type integration, and then select Integration Accounts in the results list (Figure 4-52).
Select your integration account, and then select the Agreements tile.
In the Agreements blade, select + Add.
Provide a name for your agreement and select AS2 for the agreement type. Now select the Host Partner, Host Identity, Guest Partner, and Guest Identity. You can override send and receive settings as desired. Click OK.

Link your Logic app to your Enterprise Integration account
You will need to link your Logic app to your integration account so you can create B2B workflows using the partners and agreements you’ve created in your integration account. You must make sure that both the integration account and Logic app are in the same Azure region before linking.
To link, follow these steps:
Navigate to the portal accessed via https://portal.azure.com.
Select More Services on the command bar.
In the filter box, type logic, and then select Logic Apps in the results list.
Select your logic app, and then select Workflow settings.
In the Workflow settings blade, select your integration account from the select list, and click Save (Figure 4-53).

Use B2B features to receive data in a Logic App
After creating an integration account, adding partners and agreements to it, and linking it to a Logic app, you can now create a B2B workflow using the Enterprise Integration Pack, following these steps:
Open the Logic App Designer on the Logic app that has a linked integration account.
Select Blank Logic App under Templates.
Search for “http request” in the trigger filter, and then select Request (When an HTTP request is received) from the list of results (Figure 4-54).
Select the + New Step button, and then choose Add An Action.
Type as2 in the search box, and then select AS2 (Decode AS2 Message) from the results (Figure 4-55).
In the form that follows, provide a connection name, and then select your integration account, and click Create (Figure 4-56).
Add the Body that you want to use as input. In this example, we selected the body of the HTTP request that triggers the Logic app. Add the required Headers for AS2. In this example, we selected the headers of the HTTP request that triggers the Logic app (Figure 4-57).
Select the + New Step button, and then choose Add An Action.
Type x12 in the search box, and then select X12 (Decode X12 Message) from the results (Figure 4-58).
In the form that follows, provide a connection name, and then select your integration account as before, and click Create (Figure 4-59).
The input for this new action is the output for the previous AS2 action. Because the actual message content is JSON-formatted and base64-encoded, you must specify an expression as the input. To do this, you type the following into the X12 Flat File Message to Decode field: @base64ToString(body(‘Decode_AS2_Message’)?[‘AS2Message’]?[‘Content’])
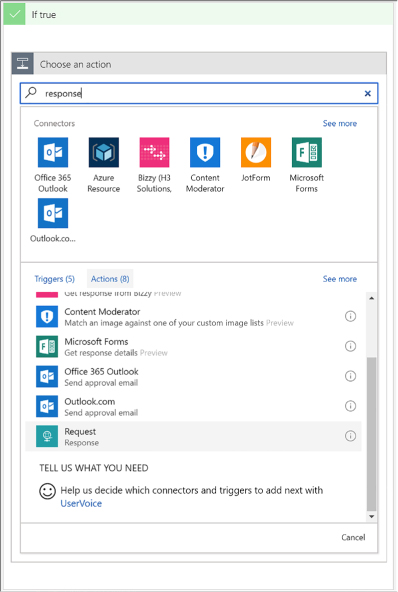
Select the + New Step button, and then choose Add An Action (Figure 4-60).
Type response in the search box, and then select Request (Response) from the results.
The response body should include the MDN from the output of the Decode X12 Message action (Figure 4-61). To do this, we type the following into the Body field: @base64ToString(body(‘Decode_AS2_message’)?[‘OutgoingMdn’]?[‘Content’])
Click Save in the Logic Apps Designer menu.


Create a Logic App with XML capabilities
Oftentimes, businesses send and receive data between one or more organizations in XML format. Due to the dynamic nature of XML documents, schemas are used to confirm that the documents received are valid and are in the correct format. Schemas are also used to transform data from one format to another. Transforms are also known as maps, which consist of source and target XML schemas. When you link your logic app with an integration account, the schema and map artifacts within enable your Logic app to use these Enterprise Integration Pack XML capabilities.
The XML features included with the Enterprise Integration pack are:
![]() XML validation Used to validate incoming and outgoing XML messages against a specific schema.
XML validation Used to validate incoming and outgoing XML messages against a specific schema.
![]() XML transform Used to convert data from one format to another.
XML transform Used to convert data from one format to another.
![]() Flat file encoding/decoding Used to encode XML content prior to sending, or to convert XML content to flat files.
Flat file encoding/decoding Used to encode XML content prior to sending, or to convert XML content to flat files.
![]() XPath Used to extract specific properties from a message, using an xpath expression.
XPath Used to extract specific properties from a message, using an xpath expression.
Add schemas to your integration account
Since schemas are used to validate and transform XML messages, you must add one or more to your integration account before working with the Enterprise Integration Pack XML features within your linked logic app. To add a new schema, follow these steps:
Navigate to the portal accessed via https://portal.azure.com.
Select More Services on the command bar.
In the filter box, type integration, and then select Integration Accounts in the results list (Figure 4-62).
Select your integration account, and then select the Schemas tile.
In the Schemas blade, select + Add.
Provide a name for your schema and select whether it is a small file (<= 2MB) or a large file (> 2MB). If it is a small file, you can upload it here. If you select Large file, then you need to provide a publicly accessible URI to the file. In this case, we’re uploading a small file. Click the Browse button underneath Schema to select a local XSD file to upload. Click OK.

Add maps to your Integration account
When you want to your Logic app to transform data from one format to another, you first add a map (schema) to your linked Integration account.
To add a new schema, follow these steps:
Navigate to the portal accessed via https://portal.azure.com.
Select More Services on the command bar.
In the filter box, type integration, then select Integration Accounts in the results list.
Select your integration account, and then select the Maps tile.
In the Maps blade, select + Add.
Provide a name for your map and click the Browse button underneath Map to select a local XSLT file to upload. Click OK (Figure 4-63).

Add XML capabilities to the linked Logic App
After adding an XML schema and map to the Integration account, you are ready to use the Enterprise Integration Pack’s XML validation, XPath Extract, and Transform XML operations in a Logic App.
Once your LogicAapp has been linked to the Integration account with these artifacts, follow these steps to use the XML capabilities in your Logic App:
Open the Logic App Designer on the Logic pp that has a linked Integration account.
Select Blank Logic App under Templates.
Search for “http request” in the trigger filter, and then select Request (When An HTTP Request Is Received) from the list of results (Figure 4-64).
Select the + New Step button, and then choose Add An Action.
Type xml in the search box, and then select XML (XML Validation) from the results.
In the form that follows, select the Body parameter from the HTTP request trigger for the Content value. Select the Order schema in the Schema Name select list, which is the schema we added to the Integration account (Figure 4-65).
Select the + New Step button, and then choose Add An Action.
Type xml in the search box, and then select Transform XML from the results (Figure 4-66).
In the form that follows, select the Body parameter from the HTTP request trigger for the Content value. Select the SAPOrderMap map in the Map select list, which is the map we added to the Integration account (Figure 4-67).
In the Condition form that appears, select the Edit In Advanced Mode link, and then type in your XPath expression. In our case, we type in the following (Figure 4-68): @equals(xpath(xml(body(‘Transform_XML’)), ‘string(count(/.))’), ‘1’)
In the “If true” condition block beneath, select Add An Action. Search for “response,” and then select Request (Response) from the resulting list of actions (Figure 4-69).
In the Response form, select the Transformed XML parameter from the previous Transform XML step. This returns a 200 HTTP response containing the transformed XML (an SAP order) within the body (Figure 4-70).
Click Save in the Logic Apps Designer menu.


Trigger a Logic App from another app
There are many triggers that can be added to a Logic App. Triggers are what kick off the workflow within. The most common type of triggers you can use to trigger, or call, your Logic Apps from another app, are those that create HTTP endpoints. Triggers based on HTTP endpoints tend to be more widely used due to the simplicity of making REST-based calls from practically any web-enabled development platform.
These are the triggers that create HTTP endpoints:
![]() Request Responds to incoming HTTP requests to start the Logic App’s workflow in real time. Very versatile, in that it can be called from any web-based application, external webhook events, even from another Logic App with a request and response action.
Request Responds to incoming HTTP requests to start the Logic App’s workflow in real time. Very versatile, in that it can be called from any web-based application, external webhook events, even from another Logic App with a request and response action.
![]() HTTP Webhook Event-based trigger that does not rely on polling for new items. Register subscribe and unsubscribe methods with a callback URL used to trigger the logic app. Whenever your external app or service makes an HTTP POST to the callback URL, the logic app fires, and includes any data passed into the request.
HTTP Webhook Event-based trigger that does not rely on polling for new items. Register subscribe and unsubscribe methods with a callback URL used to trigger the logic app. Whenever your external app or service makes an HTTP POST to the callback URL, the logic app fires, and includes any data passed into the request.
![]() API Connection Webhook The API connection trigger is similar to the HTTP trigger in its basic functionality. However, the parameters for identifying the action are slightly different.
API Connection Webhook The API connection trigger is similar to the HTTP trigger in its basic functionality. However, the parameters for identifying the action are slightly different.
Create an HTTP endpoint for your logic app
To create an HTTP endpoint to receive incoming requests for a Request Trigger, follow these steps:
Open the Logic App Designer on the logic app to which you will be adding an HTTP endpoint.
Select Blank Logic App under Templates.
Search for “http request” in the trigger filter, and then select Request (When An HTTP Request Is Received) from the list of results.
You can optionally enter a JSON schema for the payload, or data, that you expect to be sent to the trigger. This schema can be added to the Request Body JSON Schema field. To generate the schema, select the Use Sample Payload To Generate Schema link at the bottom of the form. This displays a dialog where you can type in or paste a sample JSON payload. This generates the schema when you click Done. The advantage to having a schema defined is that the designer will use the schema to generate tokens that your logic app can use to consume, parse, and pass data from the trigger through your workflow (Figure 4-71).
Click Save in the Logic Apps Designer menu.
After saving, the HTTP POST URL is generated on the Receive trigger (Figure 4-72). This is the URL your app or service uses to trigger your logic app. The URL contains a Shared Access Signature (SAS) key used to authenticate the incoming requests.


Create custom and long-running actions
You can create your own APIs that provide custom actions and triggers. Because these are web-based APIs that use REST HTTP endpoints, you can build them in any language framework like .NET, Node.js, or Java. You can also host your APIs on Azure App Service as either web apps or API apps. However, API apps are preferred because they will make it easier to build, host, and consume your APIs used by Logic Apps. Another recommendation is to provide an OpenAPI (previously Swagger) specification to describe your RESTful API endpoints, their operations, and parameters. This makes it much easier to reference your custom API from a logic app workflow because all of the endpoints are selectable within the designer. You can use libraries like Swashbuckle to automatically generate the OpenAPI (Swagger) file for you.
If your custom API has long-running tasks to perform, it is more than likely that your logic app will time out waiting for the operation to complete. This is because Logic Apps will only wait around two minutes before timing out a request. If your long-running task takes several minutes, or hours to complete, you need to implement a REST-based async pattern on your API. These types of patterns are already fully supported natively by the Logic Apps workflow engine, so you don’t need to worry about the implementation there.
Long-running action patterns
Your custom API operations serve as endpoints for the actions in your Logic App’s workflow. At a basic level, the endpoints accept an HTTP request and return an HTTP response within the Logic App’s request timeout limit. When your custom action executes a long-running operation that will exceed this timeout, you can follow either the asynchronous polling pattern or the asynchronous webhook pattern. These patterns allow your logic app to wait for these long-running tasks to finish.
Asynchronous polling
The way the asynchronous polling pattern works is as follows:
When your API receives the initial request to start work, it starts a new thread with the long-running task, and immediately returns an HTTP Response “202 Accepted” with a location header. This immediate response prevents the request from timing out, and causes the workflow engine to start polling for changes.
The location header points to the URL for the Logic Apps to check the status of the long-running job. By default, the engine checks every 20 seconds, but you can also add a “Retry-after” header to specify the number of seconds until the next poll.
After the allotted time (20 seconds), the engine polls the URL on the location header. If the long-running job is still going, you should return another “202 Accepted” with a location header. If the job has completed, you should return a “200 OK” along with any relevant data. This is what the Logic Apps engine will continue the workflow with.
Asynchronous Webhooks
The asynchronous webhook pattern works by creating two endpoints on your API controller:
![]() Subscribe The Logic Apps engine calls the subscribe endpoint defined in the workflow action for your API. Included in this call is a callback URL created by the logic app that your API stores for when work is complete. When your long-running task is complete, your API calls back with an HTTP POST method to the URL, along with any returned content and headers, as input to the logic app.
Subscribe The Logic Apps engine calls the subscribe endpoint defined in the workflow action for your API. Included in this call is a callback URL created by the logic app that your API stores for when work is complete. When your long-running task is complete, your API calls back with an HTTP POST method to the URL, along with any returned content and headers, as input to the logic app.
![]() Unsubscribe This endpoint is called any time the logic app run is cancelled. When your API receives a request to this endpoint, it should unregister the callback URL and stop any running processes.
Unsubscribe This endpoint is called any time the logic app run is cancelled. When your API receives a request to this endpoint, it should unregister the callback URL and stop any running processes.
Monitor Logic Apps
When you create a logic app, you can use out-of-the-box tools within Logic Apps to monitor your app and detect any issues it may have, such as failures. You can view runs and trigger history, overall status, and performance.
If you want real-time event monitoring, as well as richer debugging, you can enable diagnostics on your logic app and send events to OMS with Log Analytics, or to other services, such as Azure Storage and Event Hubs.
Select Metrics (Figure 4-73) under Monitoring in the left-hand menu of your logic app to view performance information and the overall state, such as how many actions succeeded or failed, over the specified time period. It will display an interactive chart based on the selected metrics.

Select Alert Rules under Monitoring to create alerts based on metrics (such as any time failures occur over a 1-hour period), activity logs (with categories such as security, service health, autoscale, etc.), and near real time metrics, based on the data captured by your Logic App’s metrics, in time periods spanning from one minute to 24 hours. Alerts can be emailed to one or more recipients, route alerts to a webhook, or run a logic app.
The overview blade of your logic app displays both Runs History and Trigger History (Figure 4-74). This view lets you see at a glance how often the app was called, and whether those operations succeeded. Select a run history to see its details, including any data it received.

Skill 4.4: Develop Azure App Service Mobile Apps
Mobile Apps in Azure App Service provides a platform for the development of mobile applications, providing a combination of back-end Azure hosted services with device side development frameworks that streamline the integration of the back-end services.
This skill covers how to:
![]() Create a mobile app
Create a mobile app
![]() Add authentication to a mobile app
Add authentication to a mobile app
![]() Add offline sync to a mobile app
Add offline sync to a mobile app
![]() Add push notifications to a mobile app
Add push notifications to a mobile app
Mobile Apps enables the development of applications across a variety of platforms, targeting native iOS, Android, and Windows apps, cross-platform Xamarin (Android, Forms and iOS) and Cordova. Mobile Apps includes a comprehensive set of open source SDKs for each of the aforementioned platforms, and together with the services provided in Azure provide functionality for:
![]() Authentication and authorization Enables integration with identity providers including Azure Active Directory, Facebook, Google, Twitter, and Microsoft Account.
Authentication and authorization Enables integration with identity providers including Azure Active Directory, Facebook, Google, Twitter, and Microsoft Account.
![]() Data access Enables access to tabular data stored in an Azure SQL Database or an on-premises SQL Server (via a hybrid connection) via an automatically provisioned and mobile-friendly OData v3 data source.
Data access Enables access to tabular data stored in an Azure SQL Database or an on-premises SQL Server (via a hybrid connection) via an automatically provisioned and mobile-friendly OData v3 data source.
![]() Offline sync Enables reads as well as create, update, and delete activity to happen against the supporting tables even when the device is not connected to a network, and coordinates the synchronization of data between local and cloud stores as dictated by the application logic (e.g., network connectivity is detected or the user presses a “Sync” button).
Offline sync Enables reads as well as create, update, and delete activity to happen against the supporting tables even when the device is not connected to a network, and coordinates the synchronization of data between local and cloud stores as dictated by the application logic (e.g., network connectivity is detected or the user presses a “Sync” button).
![]() Push notifications Enables the sending of push notifications to app users via Azure Notifications Hubs, which in turn supports the sending of notifications across the most popular push notifications services for Apple (APNS), Google (GCM), Windows (WNS), Windows Phone (MPNS), Amazon (ADM) and Baidu (Android China) devices.
Push notifications Enables the sending of push notifications to app users via Azure Notifications Hubs, which in turn supports the sending of notifications across the most popular push notifications services for Apple (APNS), Google (GCM), Windows (WNS), Windows Phone (MPNS), Amazon (ADM) and Baidu (Android China) devices.
Identify the target device platforms you want your app to target.
Prepare your development environment.
Deploy an Azure Mobile App Service instance.
Configure the Azure Mobile App Service.
Configure your client application.
Augment your project with authentication/authorization, offline data sync, or push notification capabilities.
The sections that follow cover each of these steps in greater detail.
Identify the target device platforms
The first decision you make when creating an mobile app is choosing which device platforms to support. For device platforms, you can choose from the set that includes native Android, Cordova, native iOS (Objective-C or Swift), Windows (C#), Xamarin Android, Xamarin Forms and Xamarin iOS.
Because each device platform brings with it a set of requirements, it can make getting started an almost overwhelming setup experience. One way to approach this is to start with one device platform so that you can complete the end-to-end process, and then layer on additional platforms after you have laid the foundation for one platform. Additionally, if you choose to use Xamarin or Cordova as your starting platform you gain the advantage that these platforms can themselves target multiple device platforms, allowing you to write portable code libraries once that is shared by projects that are specific to each target device.
Prepare your development environment
The requirements for your development environment vary depending on the device platforms you wish to target. The pre-requisites here include the supported operating system (e.g., macOS, Windows), the integrated development environment (e.g., Android Studio, Visual Studio for Windows, Visual Studio for Mac or Xcode) and the devices (e.g., the emulators/simulators or physical devices used for testing your app from the development environment of your choice).
Table 4-4 summarizes key requirements by device platform.
TABLE 4-4 Requirements for each target platform
Target Platform |
Requirements |
Android |
OS: macOS or Windows IDE: Android Studio Devices: Android emulator and devices |
Cordova |
OS: macOS and Windows IDE: Visual Studio for Windows Devices: Android, iOS*, Windows emulators and devices. |
iOS |
OS: macOS IDE: Xcode Devices: iOS simulator and devices |
Windows |
OS: Windows IDE: Visual Studio for Windows Devices: Windows desktop and phone |
Xamarin.Android |
OS: macOS or Windows IDE: Visual Studio for mac or Windows Devices: Android emulators and devices. |
Xamarin.Forms |
OS: macOS and Windows IDE: Visual Studio for mac or Windows Devices: Android, iOS*, Windows emulators and devices. |
Xamarin.iOS |
OS: macOS IDE: Visual Studio for mac or Windows Devices: iOS* simulator and devices |
* Running the iOS simulator or connecting to an iOS device requires a computer running macOS that is reachable across the network from the Windows development computer, or running the indicated IDE on a macOS.
Deploy an Azure Mobile App Service
With the aforementioned decisions in place, you are now ready to deploy an Azure Mobile App Service instance to provide the backend services to your app. Follow these steps:
In the Azure Portal, select New, and search for Mobile App, and select the Mobile App entry.
Select Create.
Provide a unique name for your Mobile App.
Select an Azure subscription and Resource Group.
Select an existing App Service Plan or create a new one.
Select Create to deploy the mobile app.
Configure the mobile app
Once you have deployed your mobile app, you need to configure where it will store its tabular data and the language (your options are C# or Node.js) in which the backend APIs are implemented (which affects the programming language you use when customizing the backend behavior). The following steps walk you through preparing the quick start solution, which you can use as a starting point for your mobile app. Follow these steps:
In the Azure Portal, navigate to the blade for your mobile app.
From the menu, under the Deployment heading, select Quick Start.
On the General listing, select the platform you wish to target first.
On the Quick Start blade, select the button underneath the header 1 Connect a database that reads You Will Need A Database In Order To Complete This Quickstart. Click Here To Create One.”
On the Data Connections blade, select + Add.
On the Add Data Connection blade, leave the Type drop-down at SQL Database.
Select SQL Database - Configure Required Settings.
On the Database blade, select an existing Azure SQL Database, or create a new database (and optionally a new SQL Database Server).
Back on the Add Data Connection blade, select Connection String.
Provide the name to use for referring to this connection string in configuration.
Select OK.
Select OK once more to add the data connection (and create the SQL Database if so configured).
In a few minutes (when creating a new SQL Database), the new entry appears in the Data Connections blade. When it does, close the Data Connections blade.
On the Quick Start blade, underneath the header, Create A Table API, choose Node.js and select the check box I Acknowledge That This Will Overwrite All Site Contents. Then select the Create TodoItem table button that is enabled. If you choose to use C#, note that you will have to download the zip provided, extract it, open it in Visual Studio, compile and then publish the App Service to your Mobile App instance. This is performed in the same way as you deploy Web Apps as described previously.
Leave the Quick Start blade open and continue to the next section.
Configure your client application
Now that you have a basic mobile app backend deployed, you are now ready to create the application that will run on your targeted devices. You can create a new application from a generated quick start project or by connecting an existing application:
From the Quick Start blade of your mobile app, underneath the header, Configure Your Client Application, set the toggle to create A New App If You Want To Create A Solution or Connect An Existing App If You Already Have A Solution Built and just need to connect it to the mobile app.
If you select Create A New App, you will be provided with instructions specific to the device platform you selected previously as well as a download link from which you can download a generated solution that includes the code customized for access to the deployed mobile app backend. For example, if you selected Xamarin.Forms as your platform, you are provided with a zip file that contains a personalized project that you can open in Visual Studio for Windows or Visual Studio for macOS, which has been pre-configured to connect to your mobile app backend.
If you select Connect An Existing App, you are provided with instructions and code you can copy and paste into your project to connect it to the mobile app backend.
Once you have completed the steps for either option, you can open and run the project in the IDE and start working against your mobile app backend.
Add authentication to a mobile app
Once you have your project in place and connected to your mobile app backend, you can enable authentication and authorization. Recall that this enables integration with identity providers including Azure Active Directory, Facebook, Google, Twitter and Microsoft Account such that your app users need to sign in using credentials from one of these providers. To do so, follow these steps.
Identify the set of identity providers you want to support.
For each identity provider, you need to follow the provider’s specific instructions to register your app and retrieve the credentials needed to authenticate using that provider. The up-to-date instructions for each provider are available:
Configure authentication / authorization in your mobile app.
Navigate to the blade of your mobile app in the Azure Portal.
From the menu, under the Settings header, select Authentication / Authorization.
Under the Allowed External Redirect URLs header, in the text box provide a callback URL that will be used to invoke your application. It should be of the form [scheme]://easyauth.callback where the value of [scheme] is a string you specify that starts with a letter and consists of only letters and numbers. For example, myapp://easyauth.callback.
Select Save from the command bar.
Restrict permissions to authenticated users on the service side. The approach you take varies depending on how you configured your backend language and if you have deployed custom backend code.
If you are using the Node.js backend created through the quick start in the Azure Portal, you can control access to data on a table-by-table basis. From your Mobile App blade, in the menu select Easy Tables, and then select the table you want to secure. For all of the permission options, set the value to Authenticated Access Only and select Save.
If you deployed a C# backend, in the controller for your project that inherits from TableController, decorate the class with the Authorize attribute. For example:
[Authorize]
public class TodoItemController : TableController<TodoItem>If you have deployed a customized Node.js backend, you need to modify the code accessing the table and set the access property to authenticated. For example:
table.access = 'authenticated';
Add the authentication logic to your app project. The specific steps to take vary based upon the target platform for your app, but in general they amount adding user interface elements to initiate sign-in and handling the authentication events. An important step in the configuration of the authentication is providing the value of your scheme you defined for the Allowed External Redirects URL (e.g., myapp).
Run your application in your local simulator or device to verify the authentication flow.
Add offline sync to a mobile app
The offline data sync capability comes from a mix of client-side SDK and service-side features. This capability enables reads as well as create, update and delete activity to happen against the supporting tables even when the device is not connected to a network, and coordinates the synchronization of data between local and cloud stores as dictated by the application logic (e.g., network connectivity is detected or the user presses a “Sync” button). The feature includes support for conflict detection when the same record is changed on both the client and the backend, and it allows for the conflicts to be resolved on either the client side or service side.
![]() On the Mobile App service side, you need a table that leverages Mobile App easy tables. This is typically a table in SQL Database that is exposed by Mobile Apps using the OData endpoint. Easy tables can be managed in the Mobile App blade in the portal, including adjusting their schema, setting permissions, and modifying the service side script (for Node.js backends) that processes the create, read, update, delete (CRUD) operations.
On the Mobile App service side, you need a table that leverages Mobile App easy tables. This is typically a table in SQL Database that is exposed by Mobile Apps using the OData endpoint. Easy tables can be managed in the Mobile App blade in the portal, including adjusting their schema, setting permissions, and modifying the service side script (for Node.js backends) that processes the create, read, update, delete (CRUD) operations.
![]() On the client side, the Azure Mobile App SDKs provide an interface referred to as a SyncTable that wraps access to the remote easy table. When using a SyncTable all the CRUD operations work from a local store, whose implementation is device platform specific. The local store provides the data persistence capability on the client device. In iOS the local store is based on Core Data, and for Windows, Xamarin, and Android the local store is based on SQL lite.
On the client side, the Azure Mobile App SDKs provide an interface referred to as a SyncTable that wraps access to the remote easy table. When using a SyncTable all the CRUD operations work from a local store, whose implementation is device platform specific. The local store provides the data persistence capability on the client device. In iOS the local store is based on Core Data, and for Windows, Xamarin, and Android the local store is based on SQL lite.
Changes to the data are made through a sync context object that tracks the changes that are made across all of the tables. This sync context maintains an operation queue that is an ordered list of create, update and delete operations that have been performed against the data locally.
![]() To modify the backend table data with the changes performed against the local store, you have to perform a push. To populate the local store with data from the backend, you have to perform a pull. A push operation executes a series of REST calls to your mobile app backend that applies all the CUD changes since the last push. It’s important to note that when you push changes, you are always pushing a set containing at least one operation; you are not pushing a specific table. This restriction ensures that multiple operations against the context that may span across multiple tables are replayed against the backend table in the correct order.
To modify the backend table data with the changes performed against the local store, you have to perform a push. To populate the local store with data from the backend, you have to perform a pull. A push operation executes a series of REST calls to your mobile app backend that applies all the CUD changes since the last push. It’s important to note that when you push changes, you are always pushing a set containing at least one operation; you are not pushing a specific table. This restriction ensures that multiple operations against the context that may span across multiple tables are replayed against the backend table in the correct order.
![]() There is a notion of an implicit push; this occurs when you execute a pull operation but have pending operations to push. In this case, the pull will first execute a push against the sync context.
There is a notion of an implicit push; this occurs when you execute a pull operation but have pending operations to push. In this case, the pull will first execute a push against the sync context.
![]() Offline sync supports incremental sync, whereby each time you pull records from the source only the source records that are new or have changed are retrieved (as opposed to downloading the entire table worth of data every time). You can clear the contents of the local store by performing a purge.
Offline sync supports incremental sync, whereby each time you pull records from the source only the source records that are new or have changed are retrieved (as opposed to downloading the entire table worth of data every time). You can clear the contents of the local store by performing a purge.
You can enable Offline Sync by following these high-level steps:
Modify the client code that accesses your easy tables to use objects of the SyncTable variety.
Implement a method that is run when your application first launches that defines the table schema and initializes the local store with data from the remote table.
Implement a method that launches initiate sync operation. This could be triggered from a button or refresh gesture.
You can test the offline behavior of your app by:
Running the application once as normal and adding data to your table.
Modifying the application’s configuration so that it no longer points to the correct URI of your mobile app backend.
Run the application again. This time the offline behavior should take affect. Make some modifications to the data.
Restore the application’s configuration.
Run the application again and verify that the changes you made while offline appear in your easy table. To do this, navigate to the blade of your mobile app, select Easy Tables from the menu, and then select your table to view its contents.
Add push notifications to a mobile app
Push notifications enable you to send app-specific messages to your app running across a variety of platforms. In Azure Mobile Apps, push notification capabilities are provided by Azure Notification Hubs, which is accessed using the Mobile Apps SDKs for the platform of choice. Notification Hubs, in turn, abstract your application from the complexities of dealing with the various push notification systems (PNS) that are specific to each platform, which includes challenges like device registration with the PNS, backend services to send messages to the PNS, and provides for routing of messages to targeted users or groups of users (which requires maintaining a mapping of users to devices), and scaling to support such functions across a huge base of devices. Notifications Hubs supports the sending of notifications across the most popular push notifications services for Apple (APNS), Google (GCM), Windows (WNS), Windows Phone (MPNS), Amazon (ADM), and Baidu (Android China) devices.
To add push notifications, follow these steps:
Deploy a Notification Hub with your mobile app.
Navigate to the blade of your mobile app, and on the menu under the Settings heading, select Push.
From the Command bar, select Connect.
On the Notification Hub blade, choose an existing Notification Hub or provision a new one. If you choose to provision a new Notification Hub, provide a name for the hub, a name for the new namespace, and select the desired pricing tier, and then select OK.
Select the link Configure Push Notification Services.
On the Push Notification Services blade, select the PNS to which you want to connect the Notification Hub.
On the blade for the PNS, enter the PNS specific configuration, and select Save.
Configure your backend server project to send push notifications.
Modify the app project to respond to push notifications.
Skill 4.5: Implement API Management
Azure API Management is a turnkey solution for publishing, managing, securing, and analyzing APIs to both external and internal customers in minutes. You can create an API gateway for back-end services hosted anywhere, not just those hosted on Azure. Many modern APIs protect themselves by rate-limiting consumers, meaning, limiting how many requests can be made in a certain amount of time. Traditionally, there is a lot of work that goes into that process. When you use API Management to manage your API, you can easily secure it and protect it from abuse and overuse with an API key, JWT validation, IP filtering, and through quotas and rate limits.
If you have several APIs as part of your solution, and they are hosted across several services or platforms, you can group them all behind a single static IP and domain, simplifying communication, protection, and reducing maintenance of consumer software due to API locations changing. You also can scale API Management on demand in one or more geographical locations. Its built-in response caching also helps with improving latency and scale.
Hosting your APIs on the API Management platform also makes it easier for developers to use your APIs, by offering self-service API key management, and an auto-generated API catalog through the developer portal. APIs are also documented and come with code examples, reducing developer on-boarding time using your APIs.
API Management is made up of the following components:
![]() The API gateway is the endpoint that:
The API gateway is the endpoint that:
![]() Accepts API calls and routes them to your backends.
Accepts API calls and routes them to your backends.
![]() Verifies API keys, JWT tokens, certificates, and other credentials.
Verifies API keys, JWT tokens, certificates, and other credentials.
![]() Enforces usage quotas and rate limits.
Enforces usage quotas and rate limits.
![]() Transforms your API on the fly without code modifications.
Transforms your API on the fly without code modifications.
![]() Caches backend responses where set up.
Caches backend responses where set up.
![]() Logs call metadata for analytics purposes.
Logs call metadata for analytics purposes.
![]() The publisher portal is the administrative interface where you set up your API program. Use it to:
The publisher portal is the administrative interface where you set up your API program. Use it to:
![]() Define or import API schema.
Define or import API schema.
![]() Package APIs into products.
Package APIs into products.
![]() Set up policies like quotas or transformations on the APIs.
Set up policies like quotas or transformations on the APIs.
![]() Get insights from analytics.
Get insights from analytics.
![]() Manage users.
Manage users.
![]() The developer portal serves as the main web presence for developers, where they can:
The developer portal serves as the main web presence for developers, where they can:
![]() Read API documentation.
Read API documentation.
![]() Try out an API via the interactive console.
Try out an API via the interactive console.
![]() Create an account and subscribe to get API keys.
Create an account and subscribe to get API keys.
![]() Access analytics on their own usage.
Access analytics on their own usage.
This skill covers how to:
![]() Create managed APIs
Create managed APIs
![]() Configure API management policies
Configure API management policies
![]() Protect APIs with rate limits
Protect APIs with rate limits
![]() Add caching to improve performance
Add caching to improve performance
![]() Monitor APIs
Monitor APIs
![]() Customize the Developer Portal
Customize the Developer Portal
Create managed APIs
The API Management service is the platform on which the API gateway, publisher portal, and developer portal are hosted. As such, before you can create APIs, you must first create a service instance.
Create an API Management service
Navigate to the portal accessed via https://portal.azure.com.
Select New on the command bar.
Select Developer Tools, and then API Management (Figure 4-75).
Provide a unique name, select a resource group and location, enter an organization name that will appear on the developer portal and emails, an administrator email, your pricing tier, select Pin To Dashboard, and then click Create.

Add a product
Before you can publish an API, it needs to be added to a product. A product in API Management contains one or more APIs, as well as constraints such as a usage quota and terms of use. This is a great way to add API access levels, like starter (limit to five calls/minute) or unlimited. You can create several products to group APIs with their own usage rules. Developers can subscribe to a product once it is published, and then begin using its APIs.
Follow these steps to add and publish a new product:
Navigate to your API Management service on the portal.
Select Publisher Portal on the top of the overview blade.
Select Products on the left-hand menu, and then click Add Product.
Within the new product form, provide a Title, which should be a descriptive name for your product that appears on the developer and admin portals. Provide a Description that explains the product’s purpose and any other information you want to display. The remaining fields allow you to set your level of protection, meaning, whether your product requires a subscription, and if so, whether the subscription needs to be approved by an administrator, and whether developers can subscribe more than once. Once finished, click Save.
Once the product has been added, you need to add one or more APIs to it before you can publish it. Select a product, and then click the Add API To Product link. This gives you a list of APIs that you can assign to the product.
Create a new API
Navigate to your API Management service on the portal.
Select Publisher Portal on the top of the overview blade.
Select APIs on the left-hand menu, and then click Add API.
Within the new product form (Figure 4-76):
Provide a unique Web API Name, which should be a descriptive name for your API that appears on the developer and publisher portals.
Enter the Web Service URL, which is the HTTP endpoint for your API.
Enter the Web Service URL suffix, which is unique to your API, and is the last part of the API’s public URL.
Select the desired Web API URL Scheme (HTTP or HTTPS (default)).
Select the product you created and any others you want to add it to.
When finished, click OK.

Add an operation to your API
Before you can use your new API, you must add one or more operations. These operations do things like enable service documentation, the interactive API console, set per operation limits, set request/response validation, and configure operation-level statistics.
Navigate to your API Management service on the portal.
Select Publisher Portal on the top of the overview blade.
Select APIs on the left-hand menu, select your API from the list, and then select the Operations tab.
Click + Add Operation.
By default, the Signature tab will be selected. The Signature is the URL template used to send requests to the underlying API. Here you select (Figure 4-77):
The HTTP verb (GET, POST, etc.).
Type in the URL template (e.g. /contacts/{id}).
Type in a display name, and description.
You can also add a rewrite URL template to call the back-end with a converted URL.
Select the Parameters tab. New query parameters are automatically generated based on the URL template defined in the signature. In our case, an id template parameter was generated because the URL template of our signature for this operation is /contacts/{id}. Specify the type (string, number, etc.) and provide a description for each query parameter (Figure 4-78).
You can optionally use the other tabs to specify caching and responses for the operation. Click Save when finished.


Publish your product to make your API available
The last step to making your API available to other developers is to publish your product to which this and any other APIs have been added.
To publish your product, follow these steps:
Navigate to your API Management service on the portal.
Select Publisher portal on the top of the overview blade.
Select Products on the left-hand menu, and then click select your product from the list.
The summary tab will indicate whether your product has been published, and any associated APIs. You must have at least one API added before you can publish. Click the Publish link.
When the confirmation appears, click Yes, and then publish it.
After publishing, select the Visibility tab. Choose which roles, such as developers, you want to be able to see the product on the developer portal and subscribe to the product. Click Save when finished.
Configure API Management policies
API Management policies allow you, as the publisher, to determine the behavior of your APIs through configuration, requiring no code changes. You define a policy definition, which is a collection of statements that are executed sequentially on the request or response of your API. There are many policies you can select from, such as whether to allow cross domain calls, how to authenticate requests, find and replace strings in the body, setting rate limits, and many more.
Because the API gateway receives all requests to your APIs, the policies you defined are applied at this level. The policies statements you choose affect both inbound requests and outbound responses. Policies can be applied globally, or scoped to the Product, API, or Operation level.
To configure a policy, follow these steps:
Navigate to your API Management service on the portal.
Select Publisher Portal on the top of the overview blade.
Select Policies on the left-hand menu.
At the top of the policies page, you will find select lists to define the policy scope at the Product, API, and Operations levels. If you do not select a specific operation, all operations are included in this policy. To create a policy scoped globally, simply deselect any options from these select lists (Figure 4-79).
To add a new policy to the selected policy scope, select + Add Policy link in the Policy definition area.
The policy definition will appear in XML format. To add an inbound policy that limits the call rate per key, place your cursor just inside the content of the inbound XML element, and then click the Limit Call Rate Per Key policy statement on the right. This adds the statement to rate limit inbound requests to the number of calls you specify within your defined period of time in seconds, and any other conditions you desire (Figure 4-80).
When you are finished, click Save. Your changes will be immediately applied to the API Management gateway.


Protect APIs with rate limits
Protecting your published APIs by throttling incoming requests is one of the most attractive offerings of API Management. When you open up your API for others to use, it is difficult to guarantee a promised level of service if you cannot control the demand on your resources. Or, you may be interested in controlling your resource costs by limiting requests, preventing you from unnecessarily scaling up your services to meet unexpected demand. Rate limiting, or throttling, is common practice when providing APIs. Oftentimes, API publishers offer varying levels of access to their APIs. For instance, you may choose to offer a free tier with very restrictive rate limits, and various paid tiers offering higher request rates. This is where API Management’s products come into play. Define products for your varying service levels, and apply rate limiting policies to each product, accordingly.
Create a product to scope rate limits to a group of APIs
The following steps show how to create a free trial, adding APIs that developers can use on a rate-limited free trial basis:
Navigate to your API Management service on the portal.
Select Publisher Portal on the top of the Overview blade.
Create a new product named Free Trial.
Set the description to Subscribers Will Be Able To Run 10 Calls/Minute Up To A Maximum Of 200 Calls/Week.
Set the visibility to Developers.
Add your APIs to the product and publish it.
Go to Policies and set the policy scope to the free trial product.
Click + Add Policy.
Position the cursor within the inbound element.
Scroll through the list of policy statements and select Limit Call Rate Per Subscription. Modify the XML to set calls to 10 and renewal-period to 60. You can delete the API and operation elements because they are not needed in this scenario.
Position your cursor immediately below the rate-limit element you added. Select Set Usage Quota Per Subscription in the list of policy statements. Modify the XML to set calls to 200 and renewal-period to 604800. You can delete the API and operation elements because they are not needed in this scenario.
Save your changes. In the end, your inbound policy should look as follows (Figure 4-81):

Advanced rate limiting
In its simplest implementation, you can control the rate of requests or the total requests/data transferred. These constraints do not help when individual end-users of your API consume exponentially more of the quota than other users. If you want to avoid having high-usage consumers limit access to occasional users, by using up the pool of available resources, consider using the new rate-limit-by-key and quota-by-key policies. These are more flexible rate limit ing policies that allow you to define expressions to track traffic usage by user-level information, such as IP address and user identity.
Here is an example of rate and quota limiting by IP address:
<rate-limit-by-key calls="10"
renewal-period="60"
counter-key="@(context.Request.IpAddress)" />
<quota-by-key calls="1000000"
bandwidth="10000"
renewal-period="2629800"
counter-key="@(context.Request.IpAddress)" />
Add caching to improve performance
Caching is a great way to limit your resource consumption, like bandwidth, as well as reduce latency for infrequently changing data. API Management allows you to configure response caching on operations.
Follow these steps to add response caching for your API (Figure 4-82), and review caching policies:
Navigate to your API Management service on the portal.
Select Publisher portal on the top of the overview blade.
Select APIs on the left-hand menu.
Select the ECHO API, which is automatically added to new API Management services.
Select the Operations tab, and then select GET Retrieve Resource (Cached) from the list.
Select the Caching tab (Figure 4-83) to view the caching settings. To enable caching on an operation, select the Enable check box. You can modify the keyed operation responses by setting values in the Vary By Query String Parameters and Vary By Headers fields. In this case, cache keys are being computed on two different headers: Accept and Accept-Charset. Duration sets the cache duration in seconds. Here it is set to 3600 seconds.
Select Policies from the left-hand menu of the publisher portal.
Select Echo API from the API select list, and then Retrieve Resource (Cached) from the Operation select list.
Here you see that the caching policies in the policy editor reflect the values in the Caching tab of the operation. Any changes here are reflected on the Caching tab, and vice-versa.


Monitor APIs
API Management provides a few methods by which you can monitor resource usage, service health, activities, and analytics. If you want real-time monitoring, as well as richer debugging, you can enable diagnostics on your logic app and send events to OMS with Log Analytics, or to other services, such as Azure Storage, and Event Hubs. Select Diagnostics Logs from the left-hand menu of your API Management service, and then select Turn On Diagnostics to archive your gateway logs and metrics to a storage account, stream to an event hub, or send to Log Analytics on OMS.
Activity logs provide insight into the operations that were performed on your API Management services, so you can determine the “what, who, and when” for any write operations taken on your API Management services. Select Activity Log from the left-hand menu to filter and view these logs. From here, you can select Export to archive these logs in a storage account or send them to an event hub. You can also select Log Analytics to send the logs to OMS.
![]() Select Metrics under Monitoring in the left-hand menu of your API Management service to view the state and health of your APIs in near real-time. These metrics are emitted every minute. You can monitor gateway requests, determine which of those were successful or failed, and also view unauthorized gateway requests. It displays an interactive chart based on the selected metrics.
Select Metrics under Monitoring in the left-hand menu of your API Management service to view the state and health of your APIs in near real-time. These metrics are emitted every minute. You can monitor gateway requests, determine which of those were successful or failed, and also view unauthorized gateway requests. It displays an interactive chart based on the selected metrics.
![]() Select Alert rules under Monitoring to create alerts based on metrics (such as any time failed gateway requests occur over a one-hour period), activity logs (with categories such as security, service health, autoscale, etc.), and near real time metrics, based on the data captured by your API Management service’s metrics, in time periods spanning from one minute to 24 hours. Alerts can be emailed to one or more recipients, route alerts to a webhook, or run a logic app.
Select Alert rules under Monitoring to create alerts based on metrics (such as any time failed gateway requests occur over a one-hour period), activity logs (with categories such as security, service health, autoscale, etc.), and near real time metrics, based on the data captured by your API Management service’s metrics, in time periods spanning from one minute to 24 hours. Alerts can be emailed to one or more recipients, route alerts to a webhook, or run a logic app.
Open the publisher portal to view Analytics. This shows an overview of usage by developers, top products, top subscriptions, top APIs, and top operations. Each of these categories show the number of successful calls versus blocked or failed calls, as well as bandwidth used and average response time, when applicable. The usage tab shows number of calls and bandwidth by region, highlighting countries on a map, corresponding with the origin of the requests. You can select any continent or country to drill down further into the selected region. The health tab shows statistics about status codes, caching, API response time, and Service response time. Finally, the activity tab shows more detailed information about requests by developers, on products, by subscriptions, for APIs, and on which operations.
Customize the developer portal
The API Management developer portal is built on top of a content management system (CMS), which gives you flexibility on ways you can customize its layout, content, and styles. Because this is the portal through which developers discover, subscribe to, and learn more about your APIs, you may wish to alter the look and feel to more closely match your company’s website, or craft the experience for your end users in general.
There are three different methods by which you can customize the developer portal.
Edit static page content and layout elements
The layout of every page of the developer portal is based on small page elements called widgets (Figure 4-84).
The content area on the page is specific to an individual page’s contents. Any Contents widget can be edited to modify that page’s content. The page layout elements are comprised of the remaining widgets. Any edits made to these layout widgets are applied to all pages within the portal.
To edit the contents of a layout widget, perform the following steps:
Navigate to your API Management service on the portal.
Select Publisher portal on the top of the overview blade.
Select Widgets on the left-hand menu, underneath the DEVELOPER PORTAL section.
Select the widget you wish to edit, such as Banner.
The Edit Widget form allows you to select the zone for the widget, layer, position, title, name (used for CSS), and its HTML.
Make changes as desired, and then click Save. You immediately see your changes on the developer portal.
To edit the contents of a page, perform the following steps:
Navigate to your API Management service on the portal.
Select Publisher portal on the top of the overview blade.
Select Content on the left-hand menu, underneath the DEVELOPER PORTAL section.
Select the page you wish to edit, such as Welcome.
The Edit Page form allows you change the page title, select whether you wish to display the title on the front-end, and its HTML.
Make changes as desired, and then click Save. When you are satisfied with your changes, click Publish Now to make those changes visible to everyone. You immediately see your changes on the developer portal.
Using these tools, you can add new layout widgets, as well as new pages. Use the Navigation area to create custom menu links or rearrange their order.
Customize the styling
Change the colors, fonts, spacing, and other styles by altering the style rules in the developer portal. For instance, change the colors and fonts to match your company’s website. To change these style rules, you need to be logged in to the developer portal as an administrator. This requires opening the developer portal from the publisher portal.
Navigate to your API Management service on the portal.
Select Publisher portal on the top of the overview blade.
Select Developer portal from the top-right of the page.
On the developer portal, hover your mouse over the customization icon to display the customization toolbar (Figure 4-85), and then select Styles from the toolbar.
In the list of editable styles that appear, you can either look through the list and change style values as you see fit, or click the Select An Element On The Page button, and then select any element on the page to view only its styles.
When you are finished making edits, click the Publish button at the bottom of the customization toolbar. This will show a preview of your changes. When satisfied, click the Publish Customizations button to make your changes publicly available.

Customize using templates
Use templates to customize the system-generated developer pages, such as API docs, user authentication, products, etc. Template markup uses the DotLiquid syntax, based on Ruby’s Liquid markup, to alter the appearance and behavior of the corresponding page. Dynamic content in the template is controlled through tokenized strings. When you select a template to edit, there are three panes that are displayed. The top pane is a preview of the corresponding page. On the bottom left is the template editing pane where you edit the markup, and on the bottom right is the template data pane. This pane serves as a guide to the data model for the entities available in the selected template. You can reference the template data when adding tokenized strings to the template beside it.
To edit templates, follow these steps:
Navigate to your API Management service on the portal.
Select Publisher portal on the top of the overview blade.
Select Developer portal from the top-right of the page.
On the developer portal, hover your mouse over the customization icon to display the customization toolbar, and then select Templates from the toolbar.
Select the template you wish to edit from the list.
Alter the template markup, using the bottom-left template editing pane. Here you can use a mix of HTML and tokenized strings. Reference the template data to the right to view tokenized strings you can add to the template, and the values they will display if you reference them. All changes will update the preview pane on top in real time.
When finished editing, click the save icon in the template editing pane.
Saved templates can be published either individually, or all together. To publish an individual template, click Publish in the template editor.
Click Yes to confirm and make your changes to the template live on the developer portal.
Skill 4.6: Implement Azure Functions and WebJobs
Azure Functions is a serverless compute service that enables you to run code on-demand without having to explicitly provision or manage infrastructure. Use Azure Functions to run a script or piece of code in response to a variety of events from sources such as:
![]() HTTP requests
HTTP requests
![]() Timers
Timers
![]() Webhooks
Webhooks
![]() Azure Cosmos DB
Azure Cosmos DB
![]() Blob
Blob
![]() Queues
Queues
![]() Event Hub
Event Hub
When it comes to implementing background processing tasks, the main options in Azure are Azure Functions and WebJobs. It is important to mention, however, that Functions are actually built on top of WebJobs. The choice to use one or the other really depends on the problem you are trying to solve. For example, if you already have an app service running a website or a web API and you require a background process to run in the same context, a WebJob makes the most sense. Here are two examples that may drive you to using a WebJob:
![]() The Service Plan You want to share compute resources between the website or API and the WebJob.
The Service Plan You want to share compute resources between the website or API and the WebJob.
![]() Shared libraries The WebJob should share libraries that run the website or API.
Shared libraries The WebJob should share libraries that run the website or API.
Otherwise, for situations where you want to externalize a process so that it runs and scales independently from your web application or API environment, or you are implementing an event handler in response to some external event (i.e., a Webhook); Azure Functions are the more modern serverless technology to choose.
This skill covers how to:
![]() Create Azure Functions
Create Azure Functions
![]() Implement a webhook function
Implement a webhook function
![]() Create an event processing function
Create an event processing function
![]() Implement an Azure-connected function
Implement an Azure-connected function
![]() Integrate a Function with storage
Integrate a Function with storage
![]() Debug a Function
Debug a Function
![]() Design and implement a custom binding
Design and implement a custom binding
![]() Implement and configure proxies
Implement and configure proxies
![]() Integrate with App Service Plan
Integrate with App Service Plan
Create Azure Functions
The Azure portal gives you a quick and easy way to create a functions app, add functions based on a template and test the function.
To create a function app in the portal follow these steps (Figure 4-86):
Navigate to the portal accessed via https://portal.azure.com.
Select New on the command bar.
Select Compute, and then Function App.
Click Create and supply the app name, subscription, resource group, hosting plan, location, and storage plan (if you select Consumption plan).
After a few minutes, the Functions App is created (Figure 4-87).


Implement a Webhook function
Visual Studio provides a complete development and debugging environment for Azure Functions with the addition of Azure Functions Extension. To create a Webhook function using Visual Studio 2017, follow these steps:
Ensure you have the Functions App Visual Studio Extension installed first (Figure 4-88).
In the New Project dialog, expand Visual C# > Cloud node, select Azure Functions, type a Name for your project, and click OK (Figure 4-89).
This creates a new Functions App in your subscription. You may have to log in to the Azure portal to complete the process.
From Visual Studio, go to Solution Explorer, right-click the project node, and select Add > New Item. Select Azure Function, and click Add.
From the New Azure Function dialog, select Generic WebHook, type the function name, and click OK (Figure 4-90).
This generates an initial implementation for your function. The FunctionName attribute sets the name of your function. The HttpTrigger(WebHookType = “genericJson”) attribute indicates the message that triggers the function.
using Microsoft.Azure.WebJobs;
using Microsoft.Azure.WebJobs.Host;
using Newtonsoft.Json;
using System.Net;
using System.Net.Http;
using System.Threading.Tasks;
namespace SolVsFunctionapp
{
public static class GenericWebhookFunction
{
[FunctionName("GenericWebhookFunction")]
public static async Task<object> Run([HttpTrigger(WebHookType =
"genericJson")]HttpRequestMessage req, TraceWriter log)
{
log.Info($"Webhook was triggered!");
string jsonContent = await req.Content.ReadAsStringAsync();
dynamic data = JsonConvert.DeserializeObject(jsonContent);
if (data.first == null || data.last == null)
{
return req.CreateResponse(HttpStatusCode.BadRequest, new
{
error = "Please pass first/last properties in the input
object"
});
}
return req.CreateResponse(HttpStatusCode.OK, new
{
greeting = $"Hello {data.first} {data.last}!"
});
}
}
}You ran run the function from Visual Studio directly using Azure Functions Tools. Press F5 to run. If prompted, accept the download and install Azure Functions Core tools.
You can copy the URL of your function from the Azure Function runtime output (Figure 4-91).
You can now post a JSON payload to the function using any tool that an issue HTTP requests to test the function.


Create an event processing function
To create an event processing function, please complete these steps:
Navigate to the portal accessed via https://portal.azure.com.
Go to your Function App, such as the one created in the previous section, and click the + sign to create a new function (Figure 4-92).
Select Timer and CSharp, and select Create This Function (Figure 4-93).
This creates a skeleton function that runs based on a timer. You can edit the function.json file to adjust settings for the function (Figure 4-94).
You can view the output of the function and any logs emitted as it executes.


Implement an Azure-connected function
To create an Azure-connected function using Azure Queues, follow these steps:
Navigate to the portal accessed via https://portal.azure.com.
Go to your Function App, such as the one used in the previous section, and click the + sign to create a new function.
Select QueueTrigger - C#, provide a name for the function, provide the name of the queue and the storage account that it belongs to. Click Create to create the function (Figure 4-95).
A skeleton implementation for the function is created. This is triggered for each message written to the specified queue (Figure 4-96).
To complete the integration, create the storage account and queue that you specified when creating the function. From the function app definition, select the Integrate tab, and select the storage queue under Triggers. Expand the Documentation link and enter the storage account name and key. The function will use these credentials to connect to the storage account (Figure 4-97).

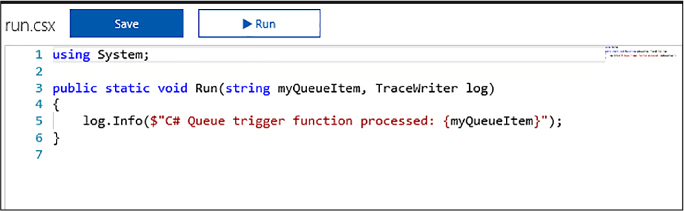

To test the function, add a message to the queue. After a few seconds the function log in the portal shows output from processing the message (Figure 4-98).

Integrate a function with storage
To create a function integrated with Azure Storage Blobs, follow these steps:
Navigate to the portal accessed via https://portal.azure.com.
Go to your Function App, such as the one used in the previous section, and click the + sign to create a new function.
Select BlobTrigger - C#, provide a name for the function, provide the path to the blob container item and the storage account that it belongs to. Click Create to create the function (Figure 4-99).
A skeleton implementation for the function is created. This is triggered for each blob written to the specified storage container (Figure 4-100).
To complete the integration, create the storage account and blob container that you specified when creating the function. From the function app definition, select the Integrate tab, and select Azure Blob Storage under Triggers. Expand the Documentation link, and enter the storage account name and key. The function uses these credentials to connect to the storage account (Figure 4-101).
To test the function, add a file to the blob container. After a few seconds the function log in the portal shows output from processing the message, as illustrated in the previous section for Azure storage queues.


Design and implement a custom binding
Function triggers indicate how a function is invoked. There are a number of predefined triggers, some already discussed in previous sections, including:
![]() HTTP triggers
HTTP triggers
![]() Event triggers
Event triggers
![]() Queues and topic triggers
Queues and topic triggers
![]() Storage triggers
Storage triggers
Every function must have one trigger. The trigger is usually associated with a data payload that is supplied to the function. Bindings are a declarative way to map data to and from function code. Using the Integrate tab (as shown in previous sections to connect a Queue to a function, for example) you can provide connection settings for such a data binding activity.
Exam Tip
You can also create custom input and output bindings to assist with reducing code bloat in your functions by encapsulating reusable, declarative work into the binding. For details on how to implement custom bindings see https://github.com/Azure/azure-webjobs-sdk/wiki/Creating-custom-input-and-output-bindings.
Debug a Function
You can use VS Code or Visual Studio 2017 to debug an Azure Function. For more information on working with local Functions projects and local debugging, see: https://docs.microsoft.com/en-us/azure/azure-functions/functions-run-local.
Implement and configure proxies
If you have a solution with many functions you’ll find it can become work to manage given the different URLs, naming, and versioning potentially related to each function. An API Proxy acts as a single point of entry to functions from the outside world. Instead of calling the individual function URLs, you provide a proxy as a facade to your different function URLs.
To create a simple API Proxy, follow these steps (Figure 4-102):
Consider an existing function that includes the function code (API key) and any query string parameters in the URL such as the following example:
https://sol-newfunctionapp.azurewebsites.net/api/
AirplanesApi?code=N8eJPFEkD1MkOeQngOqRsaLVxeHRQ4QcxacFRdLtMDBdak3eeN/
kNQ==&id=0099991API proxies require two important pieces of information:
The Route Template Provides a template of how the proxies are triggered, for example a REST-compliant API path that removes the need for the function code and query string parameters:
/api/airplanes/86327
The Backend URL The function URL to match to.
Update the Backend URL too so that it uses the variables provided in the route template.
https://sol-newfunctionapp.azurewebsites.net/api/{rest}Api?code=q/vTyTaw4wTzyFuY16wuMOnUPEhJLzRFqKRDXaChGz3/HzS0myMaNw==&id={id}.
When you request the URL, the variables in the route template (i.e., {rest} and {id}) are replaced with whatever is passed in the request. For example, this URL:
https://sol-newfunctionapp.azurewebsites.net/api/airplanes/3434
Routes to this URL:
https://sol-newfunctionapp.azurewebsites.net/api/airplanesApi?code=q/
vTyTaw4wTzyFuY16wuMOnUPEhJLzRFqKRDXaChGz3/HzS0myMaNw==&id=3434

Exam Tip
API proxies have the ability to modify the requests and responses on the fly.
![]() Consumption Plan Where your function is allocated dynamically to the amount of compute power required to execute under the current load.
Consumption Plan Where your function is allocated dynamically to the amount of compute power required to execute under the current load.
![]() App Service Plan Where your function is assigned a specific app service hosting plan and is limited to the resources available to that hosting plan.
App Service Plan Where your function is assigned a specific app service hosting plan and is limited to the resources available to that hosting plan.
For more information about the difference between Consumption and App Service Plans see: https://docs.microsoft.com/en-us/azure/azure-functions/functions-scale. For more information about setting up an App Service Plan see: https://docs.microsoft.com/en-us/azure/app-service/azure-web-sites-web-hosting-plans-in-depth-overview.
Skill 4.7: Design and Implement Azure Service Fabric apps
Azure Service Fabric is a platform that makes it easy to package, deploy, and manage distributed solutions at scale. It provides an easy programming model for building microservices solutions with a simple, familiar, and easy to understand development experience that supports stateless and stateful services, and actor patterns. In addition, to providing a packaging and deployment solution for these native components, Service Fabric also supports the deployment of guest executables and containers as part of the same managed and distributed system.
The following list summarizes these native and executable components:
![]() Stateless Services Stateless Fabric-aware services that run without managed state.
Stateless Services Stateless Fabric-aware services that run without managed state.
![]() Stateful Services Stateful Fabric-aware services that run with managed state where the state is close to the compute.
Stateful Services Stateful Fabric-aware services that run with managed state where the state is close to the compute.
![]() Actors A higher level programming model built on top of stateful services.
Actors A higher level programming model built on top of stateful services.
![]() Guest Executable Can be any application or service that may be cognizant or not cognizant of Service Fabric.
Guest Executable Can be any application or service that may be cognizant or not cognizant of Service Fabric.
![]() Containers Both Linux and Windows containers are supported by Service Fabric and may be cognizant or not cognizant of Service Fabric.
Containers Both Linux and Windows containers are supported by Service Fabric and may be cognizant or not cognizant of Service Fabric.
This skill provides an overview of the Service Fabric programming experience.
This skill covers how to:
![]() Create a Service Fabric application
Create a Service Fabric application
![]() Add a web front end to a Service Fabric application
Add a web front end to a Service Fabric application
![]() Build an Actors-based service
Build an Actors-based service
![]() Monitor and diagnose services
Monitor and diagnose services
![]() Deploy an application to a container
Deploy an application to a container
![]() Migrate apps from cloud services
Migrate apps from cloud services
![]() Scale a Service Fabric app
Scale a Service Fabric app
![]() Create, secure, upgrade, and scale Service Fabric Cluster in Azure
Create, secure, upgrade, and scale Service Fabric Cluster in Azure
Create a Service Fabric application
A Service Fabric application can consist of one or more services. The application defines the deployment package for the services, and each service can have its own configuration, code, and data. A Service Fabric cluster can host multiple applications, and each has its own independent deployment and upgrade lifecycle.
In this skill you create a new Service Fabric application that has a stateful service. This service is reachable via RPC and is called by a web front end created in the next section. The service is called Lead Generator and returns the current count for the number of leads that have been generated and persisted with the service. Figure 4-103 illustrates the service endpoint.
To create a new Service Fabric application, follow these steps:
Launch Visual Studio, and then select File > New > Project.
In the New Project dialog, select Service Fabric Application within the Cloud category. Provide a name and location for your new project, nd then click OK. In this example the name is LeadGenerator (Figure 4-104).
Select Stateful Service from the list of service templates and provide a name, LeadGenerator.Simulator as shown here.
From Solution Explorer, expand the new LeadGenerator.Simulator node and expand the PackageRoot folder where you’ll find ServiceManifest.xml. This file describes the service deployment package and related information. It includes a section that describes the service type that is initialized when the Service Fabric runtime starts the service:
<ServiceTypes>
<StatefulServiceType ServiceTypeName="SimulatorType" HasPersistedState="true" />
</ServiceTypes>A service type is created for the project; in this case the type is defined in the Simulator.cs file. This service type is registered when the program starts, in Program.cs, so that the Service Fabric runtime knows which type to initialize when it creates an instance of the service.
private static void Main()
{
try
{
ServiceRuntime.RegisterServiceAsync("SimulatorType",
context => new Simulator(context)).GetAwaiter().GetResult();
ServiceEventSource.Current.ServiceTypeRegistered(Process.
GetCurrentProcess().Id,
typeof(Simulator).Name);
Thread.Sleep(Timeout.Infinite);
}
catch (Exception e)
{
ServiceEventSource.Current.ServiceHostInitializationFailed(e.ToString());
throw;
}
}The template produces a default implementation for the service type, with a RunAsync method that increments a counter every second. This counter value is persisted with the service in a dictionary using the StateManager, available through the service base type StatefulService. This counter is used to represent the number of leads generated for the purpose of this example.
protected override async Task RunAsync(CancellationToken cancellationToken)
{
var myDictionary = await this.StateManager.GetOrAddAsync<IReliableDictionary<s
tring, long>>("myDictionary");
while (true)
{
cancellationToken.ThrowIfCancellationRequested();
using (var tx = this.StateManager.CreateTransaction())
{
var result = await myDictionary.TryGetValueAsync(tx, "Counter");
ServiceEventSource.Current.ServiceMessage(this.Context, "Current
Counter Value: {0}",
result.HasValue ? result.Value.ToString() : "Value does not
exist.");
await myDictionary.AddOrUpdateAsync(tx, "Counter", 0, (key, value)
=> ++value);
await tx.CommitAsync();
}
await Task.Delay(TimeSpan.FromSeconds(1), cancellationToken);
}
}This service will run, and increment the counter as it runs persisting the value, but by default this service does not expose any methods for a client to call it. Before you can create an RPC listener you add the required nuget package, Microsoft.ServiceFabric.Services.Remoting.
Create a new service interface using the IService marker interface from the Microsoft.ServiceFabric.Services.Remoting namespace, that indicates this service can be called remotely:
using Microsoft.ServiceFabric.Services.Remoting;
using System.Threading.Tasks;
public interface ISimulatorService : IService
{
Task<long> GetLeads();
}Implement this interface on the Simulator service type, and include an implementation of the GetLeads method to return the value of the counter:
public async Task<long> GetLeads()
{
var myDictionary = await StateManager.GetOrAddAsync<IReliableDictionary<stri
ng, long>>("myDictionary");
using (var tx = StateManager.CreateTransaction())
{
var result = await myDictionary.TryGetValueAsync(tx, "Counter");
await tx.CommitAsync();
return result.HasValue ? result.Value : 0;
}
}To expose this method to clients, add an RPC listener to the service. Modify the CreateServiceReplicaListeners() method in the Simulator service type implementation, to add a call to CreateServiceReplicaListeners() as shown here:
protected override IEnumerable<ServiceReplicaListener>
CreateServiceReplicaListeners() {
yield return new ServiceReplicaListener(this.
CreateServiceRemotingListener);
}


Add a web front end to a Service Fabric application
The previous section reviewed creating a simple stateful service that returns the value of a counter over RPC. To illustrate calling this service from a client application, this section reviews how to create a web front end and call a stateful service endpoint, as illustrated in Figure 4-106.

Follow these steps to add a web app to an existing Service Fabric application:
From the Solution Explorer in Visual Studio, expand the Service Fabric application node. Right-click the Services node, and select New Service Fabric Service (Figure 4-107).
From the New Service Fabric Service dialog, select Stateless ASP.NET Core for the service template. Supply the service name LeadGenerator.WebApp, and click OK (Figure 4-108).

FIGURE 4-108 The New Service Fabric Service dialog where you can choose the Stateless ASP.NET Core template
From the New ASP.NET Core Web Application dialog select Web Application (Model-View-Controller) template. Click OK.
From Solution Explorer, expand the new LeadGenerator.WebApp node, and expand the PackageRoot folder where you’ll find ServiceManifest.xml. Alongside the service type definition there is a section that describes the HTTP endpoint where the web app will listen for requests:
<Endpoints>"
<Endpoint Protocol="http" Name="ServiceEndpoint" Type="Input" Port="8168" />
</Endpoints>The new WebApp type is defined in WebApp.cs, which inherits StatelessService. For the service to listen for HTTP requests, the CreateServiceInstanceListeners() method sets up the WebListener as shown in this listing for the type:
internal sealed class WebApp : StatelessService
{
public WebApp(StatelessServiceContext context) : base(context)
{ }
protected override IEnumerable<ServiceInstanceListener>
CreateServiceInstanceListeners()
{
return new ServiceInstanceListener[]
{
new ServiceInstanceListener(serviceContext =>
new WebListenerCommunicationListener(serviceContext,
"ServiceEndpoint", (url, listener) =>
{
ServiceEventSource.Current.ServiceMessage(serviceContext,
$"Starting WebListener on {url}");
return new WebHostBuilder().UseWebListener()
.ConfigureServices(services =>
services
.AddSingleton<StatelessServiceContext>(serviceCon
text))
.UseContentRoot(Directory.GetCurrentDirectory())
.UseStartup<Startup>()
.UseApplicationInsights()
.UseServiceFabricIntegration(listener,
ServiceFabricIntegrationOptions.None)
.UseUrls(url)
.Build();
}))
};
}
}

Next you call the stateful service that returns the leads counter value, from the stateless web application just created.
Make a copy of the service interface defined for the service type, in this case ISimulatorService:
public interface ISimulatorService : IService
{
Task<long> GetLeads();
}Modify the ConfigureServices instruction in WebApp.cs to inject an instance of the FabricClient type (change shown in bold):
return new WebHostBuilder().UseWebListener()
.ConfigureServices(services => {
services
.AddSingleton<StatelessServiceContext>(serviceContext)
.AddSingleton(new FabricClient());
})Now that FabricClient is available for dependency injection, modify the HomeController to use it:
private FabricClient _fabricClient;
public HomeController(FabricClient client) { _fabricClient = client; }Modify the Index method in the HomeController to use the FabricClient instance to call the Simulator service:
public async Task<IActionResult> Index()
{
ViewData["Message"] = "Your home page.";
var model = new Dictionary<Guid, long>();
var serviceUrl = new Uri("fabric:/LeadGenerator/Simulator");
foreach (var partition in await
_fabricClient.QueryManager.GetPartitionListAsync(serviceUrl))
{
var partitionKey = new ServicePartitionKey
(((Int64RangePartitionInformation)partition.PartitionInformation).LowKey);
var proxy = ServiceProxy.Create<ISimulatorService>(serviceUrl,
partitionKey);
var leads = await proxy.GetLeads();
model.Add(partition.PartitionInformation.Id, leads);
}
return View(model);
}Update Index.cshtml to display the counter for each partition:
@model IDictionary<Guid, long>
<h2>@ViewData["Title"].</h2>
<h3>@ViewData["Message"]</h3>
<table class="table-bordered">
<tr>
<td><strong>PARTITION ID</strong></td>
<td><strong># LEADS</strong></td>
</tr>
@foreach (var partition in Model)
{
<tr>
<td>@partition.Key.ToString()</td>
<td>@partition.Value</td>
</tr>
}
</table>To run the web app and stateful service, you can publish it to the local Service Fabric cluster. Right-click the Service Fabric application node from the Solution Explorer and select Publish. From the Publish Service Fabric Application dialog, select a target profile matching one of the local cluster options, and click Publish (Figure 4-109).
Once the application is deployed, you can access the web app at http://localhost:8162 (or, whatever the indicated port is in the service manifest for the web app. The home page triggers a call to the stateful service, which will increment as the counter is updated while it runs.

Build an Actors-based service
The actor model is a superset of the Service Fabric stateful model. Actors are simple POCO objects that have many features that make them isolated, independent unit of compute and state with single-thread execution.
To create a new Service Fabric application based on the Actor service template, follow these steps:
Launch Visual Studio, then select File > New > Project.
In the New Project dialog, select Service Fabric Application within the Cloud category. Provide a name and location for your new project, and then click OK.
Select Actor Service from the list of service templates and provide a name, such as SimpleActor.
This generates a default implementation of the Actor Service.
Monitor and diagnose services
All applications benefit from monitoring and diagnostics to assist with troubleshooting issues, evaluating performance or resource consumption, and gathering useful information about the application at runtime. For more information about Service Fabric specific approaches to this, see https://docs.microsoft.com/en-us/azure/service-fabric/service-fabric-diagnostics-overview.
Deploy an application to a container
Service Fabric can run processes and containers side by side, and containers can be Linux or Windows based containers. If you have an existing container image and wish to deploy this to an existing Service Fabric cluster, you can follow these steps to create a new Service Fabric application and set it up to deploy and run the container in your cluster:
Launch Visual Studio, nd then select File > New > Project.
In the New Project dialog, select Service Fabric Application within the Cloud category. Provide a name and location for your new project, and then click OK.
From the New Service Fabric Service dialog, choose Container for the list of templates and supply a container image and name for the guest executable to be created (Figure 4-110).
From Solution Explorer, open the ServiceManifest.xml file and modify the <Resources> section to provide a UriScheme, Port and Protocol setting for the service endpoint.
<Resources>
<Endpoints>
<Endpoint Name="IISGuestTypeEndpoint" UriScheme="http" Port="80"
Protocol="http"/>
</Endpoints>
</Resources>From Solution Explorer, open the ApplicationManifest.xml file. Create a policy for container to host <PortBinding> policy by adding this <Policies> section to the <ServiceManifestImports> section. Indicate the container port for your container. In this example the container port is 80.
<ServiceManifestImport>
<ServiceManifestRef ServiceManifestName="IISGuestPkg"
ServiceManifestVersion="1.0.0" />
<ConfigOverrides />
<Policies>
<ContainerHostPolicies CodePackageRef="Code">
<PortBinding ContainerPort="80" EndpointRef="IISGuestTypeEndpoint"/>
</ContainerHostPolicies>
</Policies>
</ServiceManifestImport>Now that you have the application configured, you can publish and run the service.

Exam Tip
Currently, you cannot run containers in the local Service Fabric cluster because it requires Windows Server 2016 with container support.
Migrate apps from cloud services
You can migrate your existing cloud services, both web and worker roles, to Service Fabric applications following instructions in the following reference at https://docs.microsoft.com/en-us/azure/service-fabric/service-fabric-cloud-services-migration-worker-role-stateless-service.
Scale a Service Fabric app
In order to scale a Service Fabric app, the following terms are important to understand: Instances, Partitions, and Replicas.
By default, the Service Fabric tooling produces three publish profiles that you can use to deploy your application:
![]() Local.1Node.xml To deploy against the local 1-node cluster.
Local.1Node.xml To deploy against the local 1-node cluster.
![]() Local.5Node.xml To deploy against the local 5-node cluster.
Local.5Node.xml To deploy against the local 5-node cluster.
![]() Cloud.xml To deploy against a Cloud cluster.
Cloud.xml To deploy against a Cloud cluster.
These publish profiles indicate the settings for the number of instances and partitions for each service. Consider this example of the parameters to a Local.5Node.xml:
<Parameters>
<Parameter Name="WebApp_InstanceCount" Value="3" />
<Parameter Name="Simulator_PartitionCount" Value="3" />
<Parameter Name="Simulator_MinReplicaSetSize" Value="3" />
<Parameter Name="Simulator_TargetReplicaSetSize" Value="3" />
</Parameters>
![]() WebApp_InstanceCount Specifies the number of instances the WebApp service must have within the cluster.
WebApp_InstanceCount Specifies the number of instances the WebApp service must have within the cluster.
![]() Simulator_PartitionCount Specifies the number of partitions (for the stateful service) the Simulator service must have within the cluster.
Simulator_PartitionCount Specifies the number of partitions (for the stateful service) the Simulator service must have within the cluster.
![]() Simulator_MinReplicaSetSize Specifies the minimum number of replicas required for each partition that the WebApp service should have within the cluster.
Simulator_MinReplicaSetSize Specifies the minimum number of replicas required for each partition that the WebApp service should have within the cluster.
![]() Simulator_TargetReplicaSetSize Specifies the number of target replicas required for each partition that the WebApp service should have within the cluster.
Simulator_TargetReplicaSetSize Specifies the number of target replicas required for each partition that the WebApp service should have within the cluster.
Consider the following diagram illustrating the instances and partitions associated with the stateless Web App and stateful simulator service, as shown in the Local.5Node.xml configuration (Figure 4-111).

![]() The Web App instance count is set to 3. As the diagram illustrates, when published to a Service Fabric cluster in Azure requests would be load balanced across those three instances.
The Web App instance count is set to 3. As the diagram illustrates, when published to a Service Fabric cluster in Azure requests would be load balanced across those three instances.
![]() The Simulator service is assigned three partitions, each of which have replicas to ensure durability of each instance’s state.
The Simulator service is assigned three partitions, each of which have replicas to ensure durability of each instance’s state.
Exam Tip
Sometimes the terms instances and replicas are used interchangeably, however, instances are for stateless services whereas replicas are for stateful services.
Create, secure, upgrade, and scale Service Fabric Cluster in Azure
To publish your Service Fabric application to the Azure in production, you’ll create a cluster, learn how to secure it, learn how to upgrade applications with zero downtime, and configure the application to scale following some of the practices already discussed. The following references will start you off with these topics:
![]() For an introduction to creating a Service Fabric Cluster see:
For an introduction to creating a Service Fabric Cluster see:
![]() https://docs.microsoft.com/en-us/azure/service-fabric/service-fabric-get-started-azure-cluster
https://docs.microsoft.com/en-us/azure/service-fabric/service-fabric-get-started-azure-cluster
![]() https://docs.microsoft.com/en-us/azure/service-fabric/service-fabric-deploy-anywhere
https://docs.microsoft.com/en-us/azure/service-fabric/service-fabric-deploy-anywhere
![]() For details on securing Azure Service Fabric Clusters in production, see this reference:
For details on securing Azure Service Fabric Clusters in production, see this reference:
![]() https://docs.microsoft.com/en-us/azure/service-fabric/service-fabric-cluster-security
https://docs.microsoft.com/en-us/azure/service-fabric/service-fabric-cluster-security
![]() For details on upgrading clusters, see this reference:
For details on upgrading clusters, see this reference:
![]() https://docs.microsoft.com/en-us/azure/service-fabric/service-fabric-cluster-upgrade
https://docs.microsoft.com/en-us/azure/service-fabric/service-fabric-cluster-upgrade
![]() You can scale clusters manually or programmatically as described in these references:
You can scale clusters manually or programmatically as described in these references:
![]() https://docs.microsoft.com/en-us/azure/service-fabric/service-fabric-cluster-scale-up-down
https://docs.microsoft.com/en-us/azure/service-fabric/service-fabric-cluster-scale-up-down
![]() https://docs.microsoft.com/en-us/azure/service-fabric/service-fabric-cluster-programmatic-scaling
https://docs.microsoft.com/en-us/azure/service-fabric/service-fabric-cluster-programmatic-scaling
Skill 4.8: Design and implement third-party Platform as a Service (PaaS)
Azure supports many third-party PaaS offerings and services through the Azure Marketplace. These can be deployed through the Azure portal, using ARM, or using other CLI tools. This skill helps you navigate those offerings.
This skill covers how to:
![]() Implement Cloud Foundry
Implement Cloud Foundry
![]() Implement OpenShift
Implement OpenShift
![]() Provision applications by using Azure Quickstart Templates
Provision applications by using Azure Quickstart Templates
![]() Build applications that leverage Azure Marketplace solutions and services
Build applications that leverage Azure Marketplace solutions and services
Implement Cloud Foundry
Cloud Foundry is an open-source PaaS for building, deploying, and operating 12-factor applications developed in various languages and frameworks. It is a mature container-based application platform allowing you to easily deploy and manage production-grade applications on a platform that supports continuous delivery and horizontal scale, and supports hybrid and multi-cloud scenarios.
There are two forms of Cloud Foundry available to run on Azure:
![]() Open-source Cloud Foundry (OSS CF) An entirely open-source version of Cloud Foundry managed by the Cloud Foundry Foundation.
Open-source Cloud Foundry (OSS CF) An entirely open-source version of Cloud Foundry managed by the Cloud Foundry Foundation.
![]() Pivotal Cloud Foundry (PCF) An enterprise distribution of Cloud Foundry from Pivotal Software Inc., which adds on a set of proprietary management tools and enterprise support.
Pivotal Cloud Foundry (PCF) An enterprise distribution of Cloud Foundry from Pivotal Software Inc., which adds on a set of proprietary management tools and enterprise support.
To deploy a basic Pivotal Cloud Foundry on Azure from the Azure Marketplace, follow these steps:
Navigate to the portal accessed via https://portal.azure.com.
Select Marketplace from the Azure Dashboard.
Search for “Pivotal Cloud Foundry,” and select Pivotal Cloud Foundry On Azure.
From within the Pivotal Cloud Foundry On Azure blade, click Create (Figure 4-112).
On the Basics blade, provide a storage account name prefix, paste your SSH public key, upload the azure-credentials.json Service Principal file, enter the Pivotal Network API token, choose a resource group, and location for the cluster. Click OK.
On the Summary blade, wait for the validation to pas,s and click OK.
On the Buy blade, click Purchase.

To deploy the open-sourced version of Cloud Foundry on Azure, you deploy BOSH and then Cloud Foundry. The steps can be performed manually, or via Azure Resource Manager (ARM) templates. Detailed instructions can be found at https://github.com/cloudfoundry-incubator/bosh-azure-cpi-release/tree/master/docs.
Implement OpenShift
The OpenShift Container Platform is a PaaS offering from Red Hat built on Kubernetes. It brings together Docker and Kubernetes, and provides an API to manage these services. OpenShift simplifies the process of deploying, scaling, and operating multi-tenant applications onto containers.
There are two forms of OpenShift that you can deploy to Azure:
![]() The open-source OpenShift Origin
The open-source OpenShift Origin
![]() The enterprise-grade Red Hat OpenShift Container Platform
The enterprise-grade Red Hat OpenShift Container Platform
Both are built on the same open source technologies, with the Red Hat OpenShift Container Platform offering enterprise-grade security, compliance, and container management.
Prerequisites for installing both forms of OpenShift include:
Generate an SSH key pair (Public / Private), ensuring that you do not include a passphrase with the private key.
Create a Key Vault to store the SSH Private Key.
Create an Azure Active Directory Service Principal.
Install and configure the OpenShift CLI to manage the cluster.
Some specific prerequisites for deploying Red Hat OpenShift Container Platform include:
OpenShift Container Platform subscription eligible for use in Azure. You need to specify the Pool ID that contains your entitlements for OpenShift.
Red Hat Customer Portal login credentials. You may use either an Organization ID and Activation Key, or a Username and Password. It is more secure to use the Organization ID and Activation Key.
You can deploy both from the Azure Marketplace templates, or using ARM templates.
To deploy Red Hat OpenShift Container Platform on Azure from the Azure Marketplace, perform the following steps (Figure 4-113):
Navigate to the portal accessed via https://portal.azure.com.
Select Marketplace from the Azure Dashboard.
Search for “OpenShift,” and select Red Hat OpenShift Container Platform (BYOL).
From within the Red Hat OpenShift Container Platform (BYOL) blade, click Create.
On the Basics blade, provide the VM Admin user name, paste the SSH public key, choose a resource group and location for the platform. Click OK.
On the Infrastructure Settings blade, provide an OCP cluster name prefix, select a cluster size, provide the resource group name for your Key Vault, as well as the Key Vault name and its secret name you specified in the prerequisites. Click OK (Figure 4-114).
On the OpenShift Container Platform Settings blade, provide an OpenShift Admin user password, enter your Red Hat subscription manager credentials, specify whether you want to configure an Azure Cloud Provider, and select your default router subdomain. Click OK (Figure 4-115).
On the Summary blade, wait for the validation to pass, and click OK.
On the Buy blade, click Purchase.


Provision applications by using Azure Quickstart Templates
Azure Quickstart Templates are community-contributed Azure Resource Manager (ARM) templates that help you quickly provision applications and solutions with minimal effort. You can search available Quickstart Templates in the gallery located at https://azure.microsoft.com/resources/templates.
Resources that are deployed as part of a Quickstart template can be thought of as related and interdependent parts of a single entity. ARM templates allow you to deploy, update, or delete all of the resources within the solution in a single, coordinated operation. You use a template for deployment and that template can work for different environments such as testing, staging, and production, while ensuring your resources are deployed in a consistent state.
Depending on the Quickstart Template you select, you will provide a set of parameters that get passed into the deployment command.
You can deploy a Quickstart Template using one of these methods (based on the example at https://azure.microsoft.com/resources/templates/101-hdinsight-hbase-replication-geo):
Using PowerShell, use the New-AzureRmResourceGroupDeployment cmdlet. You are prompted to supply values for the parameters. For example:
New-AzureRmResourceGroupDeployment -Name <deployment-name> -ResourceGroupName
<resource-group-name> -TemplateUri https://raw.githubusercontent.com/azure/azure-
quickstart-templates/master/101-hdinsight-hbase-replication-geo/azuredeploy.jsonUsing the Azure Command-Line Interface (CLI), use the group deployment create command. You are prompted to supply values for the parameters. For example:
azure config mode arm
azure group deployment create <my-resource-group> <my-deployment-name> --template-
uri https://raw.githubusercontent.com/azure/azure-quickstart-templates/master/101-
hdinsight-hbase-replication-geo/azuredeploy.jsonClick the Deploy to Azure button, if provided. This opens a form for the Quickstart template in Azure, allowing you to enter the parameter values from within the portal (Figure 4-116).

FIGURE 4-116 An Azure Quickstart Template form in the Azure Portal after clicking a Deploy to Azure button
Build applications that leverage Azure Marketplace solutions and services
The Azure Marketplace is an online applications and services marketplace that enables start-ups and independent software vendors (ISVs) to offer their solutions to Azure customers around the world. The marketplace makes it easier for consumers to search, purchase, and deploy a wide range of applications and services in just a few clicks. Some such applications and services include virtual machine images and extensions, APIs, applications, Machine Learning services, and data services.
You can subscribe to and deploy a product from the Azure Marketplace by visiting https://azuremarketplace.microsoft.com/ or by clicking the Marketplace tile on the Azure Portal dashboard.
Pricing varies based on product types. ISV software charges and Azure infrastructure costs are charged separately through your Azure subscription. Pricing models include:
![]() BYOL Model Bring-your-own-license. You obtain outside of the Azure Marketplace the right to access or use the offering and are not charged Azure Marketplace fees for use of the offering in the Azure Marketplace.
BYOL Model Bring-your-own-license. You obtain outside of the Azure Marketplace the right to access or use the offering and are not charged Azure Marketplace fees for use of the offering in the Azure Marketplace.
![]() Free Free SKU. Customers are not charged Azure Marketplace fees for use of the offering.
Free Free SKU. Customers are not charged Azure Marketplace fees for use of the offering.
![]() Free Software Trial (Try it now) Full-featured version of the offer that is promotionally free for a limited period of time. You are not charged Azure Marketplace fees for use of the offering through a trial period. Upon expiration of the trial period, customers are automatically be charged based on standard rates for use of the offering.
Free Software Trial (Try it now) Full-featured version of the offer that is promotionally free for a limited period of time. You are not charged Azure Marketplace fees for use of the offering through a trial period. Upon expiration of the trial period, customers are automatically be charged based on standard rates for use of the offering.
![]() Usage-Based You are charged or billed based on the extent of your use of the offering. For Virtual Machines Images, you are charged an hourly Azure Marketplace fee. For Data Services, Developer services, and APIs, you are charged per unit of measurement as defined by the offering.
Usage-Based You are charged or billed based on the extent of your use of the offering. For Virtual Machines Images, you are charged an hourly Azure Marketplace fee. For Data Services, Developer services, and APIs, you are charged per unit of measurement as defined by the offering.
![]() Monthly Fee You are charged or billed a fixed monthly fee for a subscription to the offering (from date of subscription start for that particular plan). The monthly fee is not prorated for mid-month cancellations or unused services.
Monthly Fee You are charged or billed a fixed monthly fee for a subscription to the offering (from date of subscription start for that particular plan). The monthly fee is not prorated for mid-month cancellations or unused services.
You can find the offer-specific pricing details on the solution details page.
Skill 4.9: Design and implement DevOps
DevOps is a combination of Development (Dev) and information technology Operations (Ops). It describes a set of practices emphasizing the collaboration between both teams, while automating software delivery and infrastructure changes with the ultimate goal of reliability and repeatability of these processes. Automation and repeatability allows for increased deployment frequency, as the manual burden of tending to all of the steps involved in deploying to one or more target environments has been removed. Some organizations use DevOps practices to deploy hundreds of times a day, which would otherwise be nearly impossible. DevOps improves reliability by ensuring each step of the software delivery or infrastructure change process is monitored, and any automated tests successfully pass.
This skill covers how to:
![]() Instrument an application with telemetry
Instrument an application with telemetry
![]() Discover application performance issues by using Application Insights
Discover application performance issues by using Application Insights
![]() Deploy Visual Studio Team Services with Continuous integration (CI) and Continuous development (CD)
Deploy Visual Studio Team Services with Continuous integration (CI) and Continuous development (CD)
![]() Deploy CI/CD with third-party platform tools (Jenkins, GitHub, Chef, Puppet, TeamCity)
Deploy CI/CD with third-party platform tools (Jenkins, GitHub, Chef, Puppet, TeamCity)
Instrument an application with telemetry
Application Insights is an extensible analytics service for application developers on multiple platforms that helps you understand the performance and usage of your live applications. With it, you can monitor your web application, collect custom telemetry, automatically detect performance anomalies, and use its powerful analytics tools to help you diagnose issues and understand what users actually do with your app. It works with web applications hosted on Azure, on-premises, or in another cloud provider. You can use it from web applications developed on multiple platforms, like .NET, Node.js, and J2EE. To get started, you just need to provision an Application Insights resource in Azure, and then install a small instrumentation package in your application. The things you can instrument are not limited just to the web application, but also any background components, and JavaScript within its web pages. You can also pull telemetry from host environments, such as performance counters, Docker logs, or Azure diagnostics.
Here is a comprehensive list of telemetry that can be collected by Application Insights.
From server web apps:
![]() HTTP requests
HTTP requests
![]() Dependencies such as calls to SQL Databases; HTTP calls to external services; Azure Cosmos DB, table, blob storage, and queue
Dependencies such as calls to SQL Databases; HTTP calls to external services; Azure Cosmos DB, table, blob storage, and queue
![]() Exceptions and stack traces
Exceptions and stack traces
![]() Performance Counters, if you use Status Monitor, Azure monitoring, or the Application Insights collected writer
Performance Counters, if you use Status Monitor, Azure monitoring, or the Application Insights collected writer
![]() Custom events and metrics that you code
Custom events and metrics that you code
![]() Trace logs if you configure the appropriate collector
Trace logs if you configure the appropriate collector
From client web pages:
![]() Page view counts
Page view counts
![]() AJAX calls requests made from a running script
AJAX calls requests made from a running script
![]() Page view load data
Page view load data
![]() User and session counts
User and session counts
![]() Authenticated user IDs
Authenticated user IDs
From other sources, if you configure them:
![]() Azure diagnostics
Azure diagnostics
![]() Docker containers
Docker containers
![]() Import tables to Analytics
Import tables to Analytics
![]() OMS (Log Analytics)
OMS (Log Analytics)
![]() Logstash
Logstash
The standard telemetry modules that run “out of the box” when using the Application Insights SDK send load, performance and usage metrics, exception reports, client information such as IP address, and calls to external services. If you install the SDK in development, this allows you to send your own telemetry, in addition to the standard modules. This custom telemetry can include any data you wish to send.
Discover application performance issues by using Application Insights
System performance depends on several factors. Each factor is typically measured through key performance indicators (KPIs), such as the number of database transactions per second or the volume of network requests your application can handle within a specified time frame. You can gather your application’s KPIs through specific performance measures, or a combination of metrics.
Application Insights can help you quickly identify any application failures. It also tells you about any performance issues and exceptions. With the right configuration and tooling, Application Insights can also help you find and diagnose the root causes of slowdowns and failures.
When you open any Application Insights resource you see basic performance data on the overview blade. Clicking on any of the charts allows you to drill down into the related data to see more detail and related requests, as well as viewing different time ranges.
Application Insights offers a full-screen, interactive performance investigator through the Performance blade. The dashboard arranges a set of performance-related metrics that you can use to quickly explore possible performance bottlenecks, and adds additional insights, such as common properties of selected requests. The common properties are the users’ location, performance bucket (in milliseconds), and cloud role of the resource. This information can help you find common variables that affect groups of users, such as response times being lengthier for users coming from certain countries or regions (Figure 4-117).
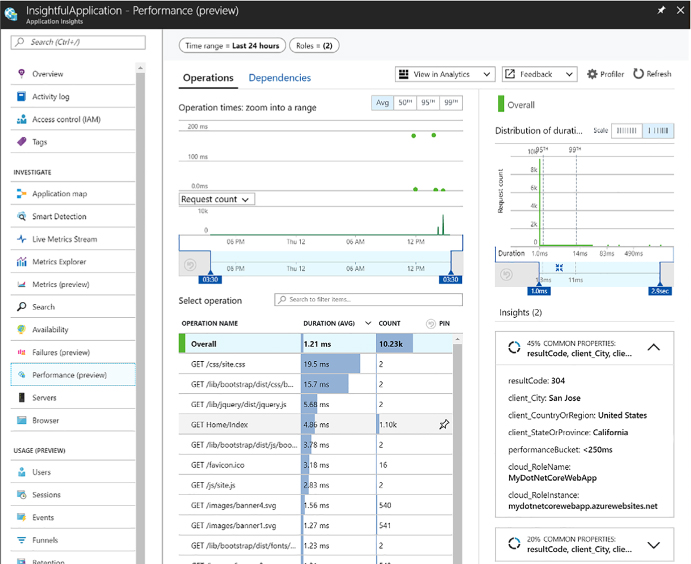
If your web application is built on ASP.NET or ASP.NET Core, you can turn on Application Insight’s profiling tool to view detailed profiles of live requests. In addition to displaying ‘hot paths’ that are using the most response times, the Profiler shows which lines in the application code slowed down performance. You can view the profile request details to see trace information, showing the call stack through your application. This level of detail allows you to quickly pinpoint issues and address them faster than digging through logs alone. There is little overhead running the profiler because it executes for two minutes per hour, but should provide a satisfactory sample set of data.
To enable the Profiler, follow these steps:
From the Application Insights resource in Azure, select Performance from the left-hand menu.
Select Profiler Rules from the top of the Performance blade.
Select Add Linked Apps from the top of the Configure Application Insights Profiler blade.
Select the application you wish to link to see all its available slots. Click Add to link them to the current Application Insights resource.
After linking your desired apps, select Enable Profiler from the top of the Configure Application Insights Profiler blade. Note, linked applications require Basic or above service plans to enable the profiler (Figure 4-118).

Deploy Visual Studio Team Services with continuous integration (CI) and continuous development (CD)
Visual Studio Team Services (VSTS) is a collection of hosted DevOps services for application developers, including Build and Release services, which help you manage continuous integration and delivery of your applications.
Continuous Integration (CI) is a practice by which the development team members integrate their work frequently, usually daily. An automated build verifies each integration, typically along with tests to detect integration errors quickly, when it’s easier and less costly to fix. Output, or artifacts, generated by the CI systems are fed to the release pipelines to streamline and enable frequent deployments. The Build service in VSTS helps you set up and manage CI for your applications.
Continuous Delivery (CD) is a process where the full software delivery lifecycle is automated, including tests, and deployed to one or more test and production environments. Azure App Services supports deployment slots, into which you can deploy development, staging, and production builds from the CD process. Automated release pipelines consume the artifacts that the CI systems produce, and deploys them as new versions and fixes to existing systems. Monitoring and alerting systems run continually to drive visibility into the entire CD process. The Release service in VSTS helps you set up and manage CD for your applications.
Because a key component of the Build system is integrating code changes and automating builds, you must host your source code in a version control system. VSTS provides two different version control systems:
![]() Git
Git
![]() Team Foundation Version Control
Team Foundation Version Control
You can also host your source code in GitHub, Subversion, Bitbucket, or any other Git repository. The Build service can integrate with any one of these options.
VSTS build services provide preconfigured tasks to build many application types, such as .NET, Java, Node, Android, XCode, and C++. You can also run command line, PowerShell, or Shell scripts in your automation to support almost any type of application.
Azure App Services was mentioned earlier as a deployment target for the VSTS Release service. VSTS Release services can deploy to virtual machines, containers, on-premises and cloud platforms, or PaaS services. You can also publish your mobile applications to a store.
The following steps show one way to configure the CI/CD pipeline from the Azure portal (Figure 4-119):
Navigate to the portal accessed via https://portal.azure.com.
Select New on the command bar.
Select Web + Mobile, and then Web App.
Provide a unique name for your web app, and then click Create (Figure 4-120).
After the new web app is provisioned open it in Azure portal, and then select Continuous Delivery from the left-hand menu. Click Configure on the Continuous Delivery blade (Figure 4-121).
Select Choose repository, and then select VSTS for the code repository. Select the VSTS account, project, repository, and source code branch from which you wish to deploy. Click OK (Figure 4-122).
Select Configure Continuous Delivery, and then your web application framework. In our example, we selected ASP.NET Core. Click OK. Skip the other two steps for now, and then click OK to complete the configuration (Figure 4-123).
At this point, Azure Continuous Delivery configures and executes a build and deployment in VSTS. After the build completes, the deployment is automatically initiated. When you commit a change to the source code repository, the automated deployment appears in the Continuous Delivery application logs on your web app, as shown in Figure 4-124.


Deploy CI/CD with third-party platform tools (Jenkins, GitHub, Chef, Puppet, TeamCity)
Azure allows you to continuously integrate and deploy with any of the leading DevOps tools, targeting any Azure service. Whether you are following your organization’s established CI/CD procedures, or just getting started with DevOps, use the tools best-suited for your team.
If you are using VSTS to host your source code or as your CI service, you can use various build services, like Jenkins, through service hooks. In this way, you can use Jenkins for your continuous integration builds, or use both VSTS and Jenkins as for building parts of your solution. Refer to this tutorial for more information: https://docs.microsoft.com/vsts/service-hooks/services/jenkins.
In addition, Table 4-5 lists some popular DevOps tools that work with Azure.
TABLE 4-5 References for using third-party DevOps tools with Azure
Out of the box, Azure App Services integrates with source code repositories such as GitHub to enable a continuous deployment workflow. This is the simplest way to integrate a CD process without the need for installing and configuring additional tools and services. Follow these simple steps to enable continuous deployment from a GitHub repository:
Publish your application source code to GithHub.
Open your app’s Menu blade in the Azure portal, and then select Deployment Options under Deployment in the left-hand menu.
In the Deployment option blade, select Choose Source, and then select GitHub from the list of sources.
Select Authorization, and then click the Authorize button to enter your GitHub credentials. When authorized, click OK.
In the Deployment Option blade, select your project and branch from which you wish to deploy your app, and click OK.
App Service creates an association with the selected repository, pulls in the files from the specified branch, and maintains a clone of your repository for your App Service app. Now, when you push a change to your repository, your app is automatically updated with the latest changes. More information about this process can be found at: https://docs.microsoft.com/azure/app-service/app-service-continuous-deployment.
Thought experiment
In this thought experiment, apply what you’ve learned about implementing App Services, Azure Functions, Azure Service Fabric, third-party PaaS, and DevOps to evaluate and determine a recommended set of features to use in a particular solution implementation.
You can find answers to this thought experiment in the next section. The following paragraphs describe the solution and the questions to answer.
You are designing a solution that issues certificates of insurance for end users. You are expecting insurance companies who you partner with to provide this service to their clients, your end user, through your solution. The following describes core components in the solution, and other requirements:
![]() Insurance companies can sign up with your service so that they can call your Policy Sync APIs and send insurance policy data using the X12 EDI standard. Their license with your API determines how much policy data they can upload to your service. This policy data is what supports certificate issuance to the end user owning the policy.
Insurance companies can sign up with your service so that they can call your Policy Sync APIs and send insurance policy data using the X12 EDI standard. Their license with your API determines how much policy data they can upload to your service. This policy data is what supports certificate issuance to the end user owning the policy.
![]() Insurance companies can manage access to those policies through a Policy Management web application that allows them to create users who can later login and request certificates of insurance for their policy data.
Insurance companies can manage access to those policies through a Policy Management web application that allows them to create users who can later login and request certificates of insurance for their policy data.
![]() End users will, once invited by the insurance company, be able to login to the Certificate Issuance web application to request certificates of insurance on demand for their policies.
End users will, once invited by the insurance company, be able to login to the Certificate Issuance web application to request certificates of insurance on demand for their policies.
![]() When a certificate is requested, a workflow should be kicked off to generate a PDF from the policy data, save the PDF to a secure location from where it can be securely shared, and email a secure link to the PDF to a specified email address.
When a certificate is requested, a workflow should be kicked off to generate a PDF from the policy data, save the PDF to a secure location from where it can be securely shared, and email a secure link to the PDF to a specified email address.
![]() While this is a new service, it is possible that many 100,000s of requests can be processed by a single insurance company per week so there is potential for large scale growth and the design must be ready to grow with demand.
While this is a new service, it is possible that many 100,000s of requests can be processed by a single insurance company per week so there is potential for large scale growth and the design must be ready to grow with demand.
![]() You are expecting to use a third-party Java-based executable component for PDF generation, alongside the other work, which will be based on ASP.NET Core.
You are expecting to use a third-party Java-based executable component for PDF generation, alongside the other work, which will be based on ASP.NET Core.
![]() As a startup, you are looking for a solution that allows you to contain costs now, but grow into an architecture that can scale with your business growth.
As a startup, you are looking for a solution that allows you to contain costs now, but grow into an architecture that can scale with your business growth.
Consider how you would answer the following questions for this solution:
How would you evaluate the core platform tools and hosting environment that you will use for the web apps and APIs? Consider these aspects:
Cost containment early on with potential for growth.
Manageability with a small team.
Support for polyglot development and third-party application components.
How will you control the onboarding process to use your Policy Sync APIs and subsequent throttling of their use by license?
How will you handle the inbound EDI requests and store those for the partner?
How will you prepare to scale the requests for certificates of insurance based on the potential growth?
Consider the following:
 deploying the application to Web Apps on an App Service Plan that can scale as needed. Consider if the main components of the application can be deployed as containers—in particular verifying that the Java component can be containerized. If so, standardizing around container deployments to Web Apps will keep things consistent and enable a future deployment to a container orchestration platform. If not, traditional Web App deployments for the ASP.NET Core applications will still reduce management overhead. The Java application may require a VM if it cannot be deployed to a Linux-based Web App due to underlying requirements. Consider moving to a container orchestration platform, or Service Fabric cluster as the application needs to scale. Keep in mind the Service Fabric can support deployment of both ASP.NET Core applications alongside guest executables such as the Java application.
Consider using API Management for onboarding partners, setting up licensing, throttling access to the EDI process through licensing, and providing statistics on usage.
Consider using Logic App to handle X12 EDI transforms from API Management initiated calls. The Logic App can convert this payload to the target data format required for the application.
Look to scale out the requests for certificates of insurance by writing requests to a queue that triggers a Logic App to handle calls to generate PDFs and send emails through a workflow. Make sure the Java component is deployed to a tier that can scale independently given the potential for scale.
Chapter summary
![]() Azure App Services provide a simple PaaS solution for deploying, managing, and scaling web applications, APIs, API Apps, Logic Apps, and Mobile Apps.
Azure App Services provide a simple PaaS solution for deploying, managing, and scaling web applications, APIs, API Apps, Logic Apps, and Mobile Apps.
![]() API Apps and API Management both provide ways to publish APIs for partner integration. API Management provides richer features for partner management, licensing, throttling, security, and related management tools.
API Apps and API Management both provide ways to publish APIs for partner integration. API Management provides richer features for partner management, licensing, throttling, security, and related management tools.
![]() Logic Apps provide an easy way to create workflows, modern integrations, and even legacy integration with EDI formats.
Logic Apps provide an easy way to create workflows, modern integrations, and even legacy integration with EDI formats.
![]() Azure Functions provide an easy way to trigger workloads that can scale based on consumption or a hosting plan. There are many integration points for triggering functions including queues, HTTP requests, and data triggers.
Azure Functions provide an easy way to trigger workloads that can scale based on consumption or a hosting plan. There are many integration points for triggering functions including queues, HTTP requests, and data triggers.
![]() Azure Service Fabric is a modern orchestration platform that can support native services that leverage unique features such as stateful services and actor patterns, in addition to guest and container processes.
Azure Service Fabric is a modern orchestration platform that can support native services that leverage unique features such as stateful services and actor patterns, in addition to guest and container processes.
![]() Azure supports several third-party PaaS platforms for containers and microservices including Cloud Foundry and OpenShift.
Azure supports several third-party PaaS platforms for containers and microservices including Cloud Foundry and OpenShift.
![]() You have many choices for DevOps and CI/CD workflows in Azure including Application Insights for diagnostics, monitoring and alerts; and VSTS, Jenkins, Chef, Puppet and more for CI/CD integration.
You have many choices for DevOps and CI/CD workflows in Azure including Application Insights for diagnostics, monitoring and alerts; and VSTS, Jenkins, Chef, Puppet and more for CI/CD integration.