
Chapter 8. Ganglia and sFlow
Ganglia’s gmond agent already has built-in metrics and can be extended using plug-in modules—why do I need to know about sFlow? The short answer is that sFlow agents are available for platforms such as Windows servers and hypervisors that aren’t currently supported by gmond. A longer answer requires a basic understanding of how sFlow integrates with Ganglia to extend coverage and improve efficiency.
There are strong parallels between Ganglia’s approach to monitoring large numbers of servers and the sFlow standard used to monitor the switches connecting them. The scalability challenge of monitoring the network links mirrors the challenge of monitoring servers because each server has at least one link to the network. However, the constraints are different, leading to divergence in the functional split between generating and consuming metrics.
Network switches perform most of their functionality in hardware and have limited processing and memory resources. While computational resources are scarce, switches are richly connected to the network and excel at sending packets. With sFlow, raw metrics from the switches are sent over the network to a central server, exploiting the relatively abundant network resources to shift processing and state from the switches to software running on the server. Removing state from the switches minimizes the memory footprint and eliminates the need to dynamically allocate memory—both useful properties when embedding the agent in switch firmware.
Unlike server metrics, switch metrics are largely implemented in hardware. For example, byte and packet counts for each switch port are implemented as hardware counters. Standards are critical: traffic passes through many devices often from different vendors and they need to agree on how to quantify the traffic. A core part of sFlow is the specification of standard sets of metrics, allowing each switch vendor to embed the measurements in hardware and produce interoperable results.
Ganglia’s binary protocol uses XDR to efficiently encode metrics and send them as UDP packets. However, each packet contains only a single metric and additional packets are needed to transmit metadata describing the metrics. For example, a host sending the 30 basic metrics every 15 seconds will generate an average of 2 packets per second and a cluster of 1,000 servers will generate 2,000 packets per second of measurement traffic. In contrast, the sFlow protocol encodes standard blocks of metrics as XDR structures, allowing a host to send all 30 metrics in a single packet and requiring only 67 packets per second to monitor the entire thousand node cluster.
Another difference between the Ganglia and sFlow binary protocols is that the default Ganglia configuration multicasts the packets, meaning that every link in the 1,000-node cluster carries 2,000 packets per second and every host needs to process 2,000 packets per second. In contrast, sFlow is a unicast protocol, allowing the network to isolate measurement traffic to individual links. Most links will carry only one sFlow packet every 15 seconds and only the link connecting to the sFlow analyzer will carry the full 67 packets per second. The increased efficiency of the sFlow protocol allows 30,000 servers to be monitored with the same network overhead as gmond requires to monitor 1,000 servers.
Note
Ganglia gmond agents can also be deployed in a unicast configuration. For large clusters, switching to unicast improves scalability by reducing the amount of memory, CPU, and network resources consumed on each host in the cluster.
For most applications, the difference in scalability isn’t significant, but the improved efficiency of using sFlow as the measurement transport helps Ganglia monitor the extremely large numbers of physical and virtual servers found in cloud data centers.
Standardizing the metrics helps reduce operational complexity by eliminating configuration options that would be needed for a more flexible solution. Again, this is very important in multivendor networking environments where each configuration option needs to be added to custom device firmware. Generally, sFlow agents export all the metrics they are capable of generating and leave it up to the analyzer to decide which metrics to keep or discard. This approach may seem wasteful, but often the measurements are sent to multiple applications, each of which is interested in different metrics. Maintaining complex, per-application state in the agents consumes significant resources and becomes a challenging configuration task as matching application and agent configuration settings need to be maintained. Shifting the task of measurement selection to the collector frees up agent resources and reduces configuration complexity.
Security of network devices is also of paramount concern and sFlow agents are intrinsically secure against remote intrusion attacks because they send but never receive or process packets.
At this point, you may be wondering how sFlow agents relate to server monitoring, as most of the discussion has been about the challenges of embedding monitoring in network switches. Although it is easy to deploy Ganglia agents and script custom metrics on a cluster of Linux servers, monitoring a large pool of virtual servers is a different matter. In many ways, hypervisors have more in common with switches than they do with a general-purpose server. The hypervisor acts as a virtual switch, connecting virtual machines to each other and to the physical network. Just like the management processor on a switch, the hypervisor is a tightly controlled, highly secure environment with limited CPU and memory resources. The sFlow agent is designed for embedded environments and is a natural fit for hypervisors.
Instrumenting applications poses similar challenges. For example,
mod_sflow embeds sFlow instrumentation in the Apache web
server. The mod_sflow agent has a minimal footprint and a
negligible impact on the performance of the web server. The alternative of
tailing the web server log files in order to derive metrics has a much
greater overhead that can become prohibitive for high traffic servers.
Similar to the network, there is a value in defining standard metrics in the
application space. For example, the Apache, NGINX, and Tomcat sFlow agents
generate the same set of HTTP metrics, allowing web servers to be monitored
interchangeably using a variety of performance analysis tools.
Metrics charts are an extremely useful way of summarizing large amounts of information, making them a staple of operations dashboards. For example, each data point in a chart trending HTTP activity may summarize information from hundreds of thousands of HTTP requests. However, metrics can only take you so far; how do you follow up if you see an unusual spike in HTTP requests? With sFlow monitoring, metrics are only one part of the measurement stream; an sFlow agent also exports records describing randomly sampled transactions, providing detailed visibility into transaction attributes, data volumes, response times, and status codes (for more information on sFlow’s random sampling mechanism, see Packet Sampling Basics). The examples in Web load and Optimizing memcached efficiency illustrate how analysis of sFlow’s sampled transactions provides additional detail that complements Ganglia’s trend charts.
The remainder of this chapter describes in detail the architecture of a Ganglia and sFlow deployment, standard sFlow metrics, configuration, troubleshooting, and integration with the broader set of sFlow analysis tools. If you would like to see how Ganglia and sFlow monitoring works in practice before diving into the details, see Tagged, Inc..
Architecture
In a classic Ganglia deployment, gmond agents are installed on each host in a cluster; see gmond: Big Bang in a Few Bytes. Each gmond agent performs three tasks:
Monitoring the performance of its host and sharing the metrics with other hosts in the cluster by sending multicast messages
Listening for updates from other hosts in the cluster in order to monitor cluster state
Responding to requests from gmetad for XML snapshots of the cluster state
In an sFlow deployment, sFlow agents replace gmond agents on all the hosts within the cluster; see Figure 8-1. The sFlow agents in each cluster send metrics as unicast messages to a single gmond instance that tracks cluster state and responds to requests from gmetad. As you will see in Configuring gmond to Receive sFlow, deploying gmond as an sFlow collector requires minimal configuration and eliminates dependencies because functionality associated with generating and transmitting metrics is disabled.

The sFlow agents export standard groups of metrics; see the section Standard sFlow Metrics. However, supplementing sFlow’s standard metrics with additional custom metrics can be accomplished using gmetric; see Custom Metrics Using gmetric.
A single gmond instance monitoring each cluster does represent a single point of failure. If this is a concern, there are a number of strategies for making the deployment fault tolerant. A second gmond instance can be added to each cluster and the sFlow agents can be configured to send metrics to both the primary and secondary gmond instances. Alternatively, a virtual IP address can be assigned to gmond and used as the destination for sFlow messages and gmetad requests. The virtual IP address can be handed to a secondary system in the event that the primary system fails. Running gmond instances on virtual machines makes it easy to quickly bring up replacements in the event of a failure.
An entire cluster should be homogeneously monitored using sFlow agents or gmond agents—mixing sFlow and gmond agents within a single cluster is not recommended. However, you can adopt different measurement technologies within a grid, selecting the best strategy for monitoring each cluster. Using sFlow as the agent technology works best for commodity web, memcache, virtual server, and Java clusters where sFlow’s standard metrics provide good coverage. For specialized environments, gmond’s extensibility and extensive library of modules are likely to be a better option.
Standard sFlow Metrics
Current approaches to server performance monitoring are highly fragmented. Each operating system, server vendor, and application developer creates specific agents and software for performance monitoring, none of which interoperate. Standardizing the metrics simplifies monitoring by decoupling agents from performance monitoring applications, allowing measurements to be made once and shared among different monitoring applications.
Server Metrics
The standard set of sFlow server metrics are a superset of Ganglia’s base metrics; see Base Metrics. Base Ganglia metrics are indicated by an asterisk next to the metric name, as seen in Table 8-1.
| Metric Name | Description | Type |
machine_type* | Machine Type | system |
os_name* | Operating System | system |
os_release* | Operating System Release | system |
uuid | System UUID | System |
heartbeat* | Heartbeat | System |
load_one* | One-minute Load Average | load |
load_five* | Five-minute Load Average | load |
load_fifteen* | Fifteen-minute Load Average | load |
proc_run* | Total Running Processes | process |
proc_total* | Total Processes | process |
cpu_num* | CPU Count | cpu |
cpu_speed* | CPU Speed | cpu |
boottime* | Last Boot Time | cpu |
cpu_user* | CPU User | cpu |
cpu_nice* | CPU Nice | cpu |
cpu_system* | CPU System | cpu |
cpu_ide* | CPU Idle | cpu |
cpu_wio* | CPU I/O Wait | cpu |
cpu_intr* | CPU Interrupts | cpu |
cpu_sintr* | CPU Soft Interrupts | cpu |
interrupts | Interrupts | cpu |
contexts | Context Switches | cpu |
mem_total* | Memory Total | memory |
mem_free* | Free Memory | memory |
mem_shared* | Shared Memory | memory |
mem_buffers* | Memory Buffers | memory |
mem_cached* | Cached Memory | memory |
swap_total* | Swap Space Total | memory |
swap_free* | Free Swap Space | memory |
page_in | Pages In | memory |
page_out | Pages Out | memory |
swap_in | Swap Pages In | memory |
swap_out | Swap Pages Out | memory |
disk_total* | Total Disk Space | disk |
disk_free* | Free Disk Space | disk |
part_max_used* | Maximum Disk Space Used | disk |
reads | Reads | disk |
bytes_read | Bytes Read | disk |
read_time | Read Time | disk |
writes | Writes | disk |
bytes_written | Bytes Written | disk |
write_time | Write Time | disk |
bytes_in* | Bytes Received | network |
pkts_in* | Packets Received | network |
errs_in | Input Errors | network |
drops_in | Input Drops | network |
bytes_out* | Bytes Sent | network |
pkts_out* | Packets Sent | network |
errs_out | Output Errors | network |
drops_out | Output Drops | network |
Note
The overlap between Ganglia and sFlow server metrics is no coincidence. One of the major contributions of the Ganglia project was identifying a common set of metrics that summarize server performance and are portable across operating systems; the Ganglia base metrics were used as a starting point for defining the standard sFlow server metrics.
Hypervisor Metrics
The standard set of sFlow hypervisor and virtual machine metrics (Table 8-2) are based on metrics defined by the open source libvirt project. The libvirt project has created a common set of tools for managing virtualization resources on different virtualization platforms, currently including: Xen, QEMU, KVM, LXC, OpenVZ, User Mode Linux, VirtualBox, and VMware ESX and GSX. The sFlow metrics provide consistency between different virtualization platforms and between sFlow- and libvirt-based performance monitoring systems.
| Metric Name | Description | Type |
vnode_mem_total | Hypervisor Memory Total | hypervisor |
vnode_mem_free | Hypervisor Free Memory | hypervisor |
vnode_cpu_speed | Hypervisor CPU Speed | hypervisor |
vnode_cpu_num | Hypervisor CPU Count | hypervisor |
vnode_domains | Hypervisor Domain Count | hypervisor |
<VM name>.vcpu_state | <VM name>: VM CPU State | vm cpu |
<VM name>.vcpu_util | <VM name>: VM CPU Utilization | vm cpu |
<VM name>.vcpu_num | <VM name>: VM CPU Count | vm cpu |
<VM name>.vmem_total | <VM name>: VM Memory Total | vm memory |
<VM name>.vmem_util | <VM name>: VM Memory Utilization | vm memory |
<VM name>.vdisk_capacity | <VM name>: VDisk Capacity | vm disk |
<VM name>.vdisk_total | <VM name>: VDisk Space | vm disk |
<VM name>.vdisk_free | <VM name>: Free VDisk Space | vm disk |
<VM name>.vdisk_reads | <VM name>: VM Reads | vm disk |
<VM
name>.vdisk_bytes_read | <VM name>: VM Bytes Read | vm disk |
<VM name>.vdisk_writes | <VM name>: VM Writes | vm disk |
<VM
name>.vdisk_bytes_written | <VM name>: VM Bytes Written | vm disk |
<VM name>.vdisk_errs | <VM name>: VM Disk Errors | vm disk |
<VM name>.vbytes_in | <VM name>: VM Bytes Received | vm network |
<VM name>.vpkts_in | <VM name>: VM Packets Received | vm network |
<VM name>.verrs_in | <VM name>: VM Input Errors | vm network |
<VM name>.vdrops_in | <VM name>: VM Input Drops | vm network |
<VM name>.vbytes_out | <VM name>: VM Bytes Sent | vm network |
<VM name>.vpkts_out | <VM name>: VM Packets Sent | vm network |
<VM name>.verrs_out | <VM name>: VM Output Errors | vm network |
<VM name>.vdrops_out | <VM name>: VM Output Drops | vm network |
Note
Per virtual machine statistics are distinguished in Ganglia by prefixing the statistic by the virtual machine name.
Java Virtual Machine Metrics
The sFlow Java Virtual Machine (JVM) metrics (Table 8-3) are based on the metrics exposed through the Java Management Extensions (JMX) interface, ensuring consistency with existing JMX-based monitoring systems.
| Metric Name | Description | Type |
jvm_release | JVM Release | jvm |
jvm_vcpu_util | JVM CPU Utilization | jvm |
jvm_vmem_total | JVM Memory Total | jvm |
jvm_vmem_util | JVM Memory Utilization | jvm |
jvm_hmem_initial | JVM Heap Initial | jvm |
jvm_hmem_used | JVM Heap Used | jvm |
jvm_hmem_committed | JVM Heap Committed | jvm |
jvm_hmem_max | JVM Heap Max | jvm |
jvm_nhmem_initial | JVM Non-Heap Initial | jvm |
jvm_nhmem_used | JVM Non-Heap Used | jvm |
jvm_nhmem_committed | JVM Non-Heap Committed | jvm |
jvm_nhmem_max | JVM Non-Heap Max | jvm |
jvm_gc_count | JVM GC Count | jvm |
jvm_gc_ms | JVM GC mS | jvm |
jvm_cls_loaded | JVM Classes Loaded | jvm |
jvm_cls_total | JVM Classes Total | jvm |
jvm_cls_unloaded | JVM Classes Unloaded | jvm |
jvm_comp_ms | JVM Compilation ms | jvm |
jvm_thread_live | JVM Threads Live | jvm |
jvm_thread_daemon | JVM Threads Daemon | jvm |
jvm_thread_started | JVM Threads Started | jvm |
jvm_fds_open | JVM FDs Open | jvm |
jvm_fds_max | JVM FDs Max | jvm |
Note
By default, Ganglia assumes that there is a single JVM instance
per host. If hosts contain more than one JVM instance, setting
multiple_jvm_instances=yes in the gmond
configuration file causes gmond to prefix each metric and description
with a distinct virtual machine name; for example, the
jvm_hmem_initial metric becomes
<name>.jvm_hmem_initial with description
<name>: JVM Heap Initial. See Configuring gmond to Receive sFlow.
HTTP Metrics
The sFlow HTTP metrics (Table 8-4) report on web server traffic by HTTP method and status class.
| Metric Name | Description | Type |
http_meth_option | HTTP Method OPTION | httpd |
http_meth_get | HTTP Method GET | httpd |
http_meth_head | HTTP Method HEAD | httpd |
http_meth_post | HTTP Method POST | httpd |
http_meth_put | HTTP Method PUT | httpd |
http_meth_delete | HTTP Method DELETE | httpd |
http_meth_trace | HTTP Method TRACE | httpd |
http_meth_connect | HTTP Method CONNECT | httpd |
http_meth_other | HTTP Method other | httpd |
http_status_1xx | HTTP Status 1XX | httpd |
http_status_2xx | HTTP Status 2XX | httpd |
http_status_3xx | HTTP Status 3XX | httpd |
http_status_4xx | HTTP Status 4XX | httpd |
http_status_5xx | HTTP Status 5XX | httpd |
http_status_other | HTTP Status other | httpd |
Note
By default, Ganglia assumes that there is a single HTTP sFlow
instance per host. If hosts contain more than one HTTP instance,
setting multiple_http_instances=yes in the gmond
configuration file causes gmond to prefix each metric and description
with the TCP port number that the instance uses to receive HTTP
requests; for example, the http_meth_option metric
becomes <port>.http_meth_option with
description <port>: HTTP Method OPTION. See Configuring gmond to Receive sFlow.
In addition, an HTTP sFlow agent exports HTTP operation records for randomly sampled HTTP requests. See Table 8-5.
| Attribute Name | Description |
http_method | HTTP method (i.e., GET, HEAD, POST, etc.) |
http_version | HTTP protocol version (i.e., 1, 1.1, etc.) |
http_uri | URI exactly as it came from the client |
http_host | Host value from request header |
http_referer | Referer value from request header |
http_useragent | User-Agent value from request header |
http_xff | X-Forwarded-For value from request header |
http_authuser | RFC 1413 identity of user |
http_mimetype | Mime-Type of the response |
http_req_bytes | Content-Length of request |
http_resp_bytes | Content-Length of response |
http_uS | Duration of the operation (in microseconds) |
http_status | HTTP status code |
socket_protocol | IP protocol type (e.g., TCP, UDP, etc.) |
socket_local_ip | IP address of memcache server |
socket_remote_ip | IP address of memcache client |
socket_local_port | Server TCP/UDP port number |
socket_remote_port | Client TCP/UDP port number |
Note
The HTTP operation records contain a superset of the attributes in the widely supported Combined Logfile Format (CLF) commonly used in web server logging. The section Using Ganglia with Other sFlow Tools describes how sFlow can be converted into CLF for use with logfile analyzers.
memcache Metrics
The sFlow memcache statistics are consistent with the statistics
reported by the memcache
STATS command, ensuring consistency with existing
memcache monitoring tools. The sFlow memcache metrics (Table 8-6) are a superset of those
reported by the gmond module; see also Table A-4. Metrics that are present in the
gmond module are indicated with an asterisk next to the metric
name.
Note
By default, Ganglia assumes that there is a single memcache
sFlow instance per host. If hosts contain more than one memcache
instance, setting multiple_memcache_instances=yes
in the gmond configuration file causes gmond to prefix each metric and
description with the TCP port number that the instance uses to receive
memcache requests; for example, the mc_curr_conns
metric becomes <port>.mc_curr_conns with
description <port>: memcache Current Connections. See Configuring gmond to Receive sFlow.
| Metric Name | Description | Type |
mc_curr_conns* | memcache Current Connections | memcache |
mc_total_conns | memcache Total Connections | memcache |
mc_conn_structs | memcache Connection Structs | memcache |
mc_cmd_get* | memcache Command GET | memcache |
mc_cmd_set* | memcache Command SET | memcache |
mc_cmd_flush | memcache Command FLUSH | memcache |
mc_get_hits* | memcache GET Hits | memcache |
mc_get_misses* | memcache GET Misses | memcache |
mc_delete_misses* | memcache DELETE Misses | memcache |
mc_delete_hits* | memcache DELETE Hits | memcache |
mc_incr_misses | memcache INCR Misses | memcache |
mc_incr_hits | memcache INCR Hits | memcache |
mc_decr_misses | memcache DECR Misses | memcache |
mc_decr_hits | memcache DECR Hits | memcache |
mc_cas_misses | memcache CAS Misses | memcache |
mc_cas_hits | memcache CAS Hits | memcache |
mc_cas_badval | memcache CAS Badval | memcache |
mc_auth_cmds | memcache AUTH Cmds | memcache |
mc_auth_errors | memcache AUTH Errors | memcache |
mc_bytes_read* | memcache Bytes Read | memcache |
mc_bytes_written* | memcache Bytes Written | memcache |
mc_limit_maxbytes* | memcache Limit MaxBytes | memcache |
mc_accepting_conns | memcache Accepting Connections | memcache |
mc_listen_disabled_num | memcache Listen Disabled | memcache |
mc_threads | memcache Threads | memcache |
mc_conn_yields | memcache Connection Yields | memcache |
mc_bytes* | memcache Bytes | memcache |
mc_curr_items* | memcache Current Items | memcache |
mc_total_items | memcache Total Items | memcache |
mc_evictions* | memcache Evictions | memcache |
mc_cmd_touch | memcache Command TOUCH | memcache |
mc_rejected_conns | memcache Rejected Connections | memcache |
mc_reclaimed | memcache Reclaimed | memcache |
In addition to the memcache metrics, a memcache sFlow agent also exports memcache operation records for randomly sampled operations. See Table 8-7.
| Attribute Name | Description |
mc_protocol | memcache protocol (i.e., ASCII, BINARY, etc.) |
mc_cmd | memcache command (i.e., SET, GET, INCR, etc.) |
mc_key | Key used to store/retrieve data |
mc_nkeys | Number of keys in request |
mc_value_bytes | Size of the object referred to by key (in bytes) |
mc_uS | Duration of the operation (in microseconds) |
mc_status | Status of command (i.e., OK, ERROR, STORED, NOT_STORED, etc.) |
socket_protocol | IP protocol type (e.g., TCP, UDP, etc.) |
socket_local_ip | IP address of memcache server |
socket_remote_ip | IP address of memcache client |
socket_local_port | Server TCP/UDP port number |
socket_remote_port | Client TCP/UDP port number |
Configuring gmond to Receive sFlow
The bulk of a typical gmond configuration file, gmond.conf, is devoted to the metrics that gmond exports for the local host. When gmond is configured as a pure sFlow collector, most configuration settings can be eliminated, resulting in a simple configuration file:
/* Configuration settings for a pure sFlow receiver */
/* Delete all udp_send_channel, modules, collection_group and include sections */

globals {
  daemonize = yes
  setuid = yes
  user = nobody
  debug_level = 0
  max_udp_msg_len = 1472
  mute = yes       /* don't send metrics */
  deaf = no        /* listen for metrics */
  allow_extra_data = yes
  host_dmax = 0
  host_tmax = 20
  cleanup_threshold = 300
  gexec = no
  send_metadata_interval = 0
}

cluster {
  name = "unspecified"
  owner = "unspecified"
  latlong = "unspecified"
  url = "unspecified"
}

host {
  location = "unspecified"
}

/* channel to receive gmetric messages */
/* eliminate mcast_join - sFlow is a unicast protocol */
udp_recv_channel {
  port = 8649
}

/* channel to service requests for XML data from gmetad */
tcp_accept_channel {
  port = 8649
}

/* channel to receive sFlow */
/* 6343 is the default sFlow port, an explicit sFlow    */
/* configuration section is needed to override default  */
udp_recv_channel {
  port = 6343
}

/* Optional sFlow settings */
#sflow {
# udp_port = 6343
# accept_vm_metrics = yes
# accept_jvm_metrics = yes
# multiple_jvm_instances = no
# accept_http_metrics = yes
# multiple_http_instances = no
# accept_memcache_metrics = yes
# multiple_memcache_instances = no
#}

/* end of configuration file */
/* Delete all modules, collection_group and include sections */
Note
The deaf and mute global settings instruct gmond to listen for metrics but not send them. All the settings related to local generation of metrics have been removed. For consistency, an sFlow agent should be installed on the host running gmond if local metrics are required.
In the Ganglia architecture, each cluster is monitored by a separate gmond process. If more than one cluster is to be monitored, then it is possible to run multiple gmond processes on a single server, each with its own configuration file. For example, if sFlow agents on the first cluster are sending to port 6343, then sFlow agents on the second cluster should be configured to send to a different port, say 6344. The following settings, in a separate configuration file, configure the second gmond instance to listen on the nonstandard port:
...

/* channel to receive gmetric messages */
udp_recv_channel {
  port = 8650
}

/* channel to service requests for XML data from gmetad */
tcp_accept_channel {
  port = 8650
}

/* channel to receive sFlow */
udp_recv_channel {
  port = 6344
}

/* Change sFlow channel to non-standard port 6344 */
sflow {
  udp_port = 6344
}
Note
The nonstandard port setting is only required if both gmond processes are running on a single server. If each cluster is monitored by a separate server, then the sFlow agents on each cluster need to be configured to send metrics to the collector for their cluster.
Another alternative is to assign multiple IP addresses to a single server, one per cluster that is to be monitored. In this case, multiple gmond instances are created, each associated with a distinct IP address, and the sFlow agents in each cluster are configured to send metrics to the associated IP address. For example, the following settings configures the gmond instance to listen for sFlow on a specific IP address:
/* channel to receive sFlow */
udp_recv_channel {
  port = 6343
  bind = <IP address>
}
For more information on configuring Ganglia clusters, see Chapter 2.
Host sFlow Agent
The Host sFlow agent is an open source implementation of the sFlow standard for server monitoring. The Host sFlow agent provides “scalable, multi-vendor, multi-OS performance monitoring with minimal impact on the systems being monitored.
The following example shows how to install and configure the Host sFlow daemon (hsflowd) on a Linux server in order to illustrate how to send sFlow metrics to Ganglia gmond. The Host sFlow website should be consulted for detailed instructions on installing and configuring Host sFlow on other platforms.
First, install the hsflowd software:
rpm -Uvh hsflowd_XXX.rpm
Alternatively, hsflowd can be installed from sources:
tar -xzf hsflowd-X.XX.tar.gz
cd hsflowd-X.XX
make
make install
make schedule
Next, edit the hsflowd configuration file, /etc/hsflowd.conf:
sflow{
  DNSSD = off
  polling = 20
  sampling = 512
  sampling.http = 100
  sampling.memcache = 400
  collector{
   ip = <gmond IP address>
   udpport = <gmond udp_rcv_channel port>
  }
}
Note
By default, hsflowd is configured to use DNS Service Discovery
(DNS-SD) to automatically retrieve settings (i.e., DNSSD =
on). Manual configuration (i.e., DNSSD =
off) is recommended when using hsflowd to send metrics to
gmond because it allows each host to be configured to send sFlow to the
gmond instance responsible for its cluster. If only one cluster is being
monitored, consider using DNS-SD.
Finally, start the hsflowd daemon:
service hsflowd start
Within a few minutes, metrics for the server should start appearing in Ganglia. If metrics fail to appear, follow the directions in Troubleshooting.
Host sFlow Subagents
The Host sFlow website maintains a list of related projects implementing subagents that extend sFlow monitoring to HTTP, memcache, and Java applications running on the server. These subagents require minimal additional configuration because they share configuration settings with hsflowd (Figure 8-2).
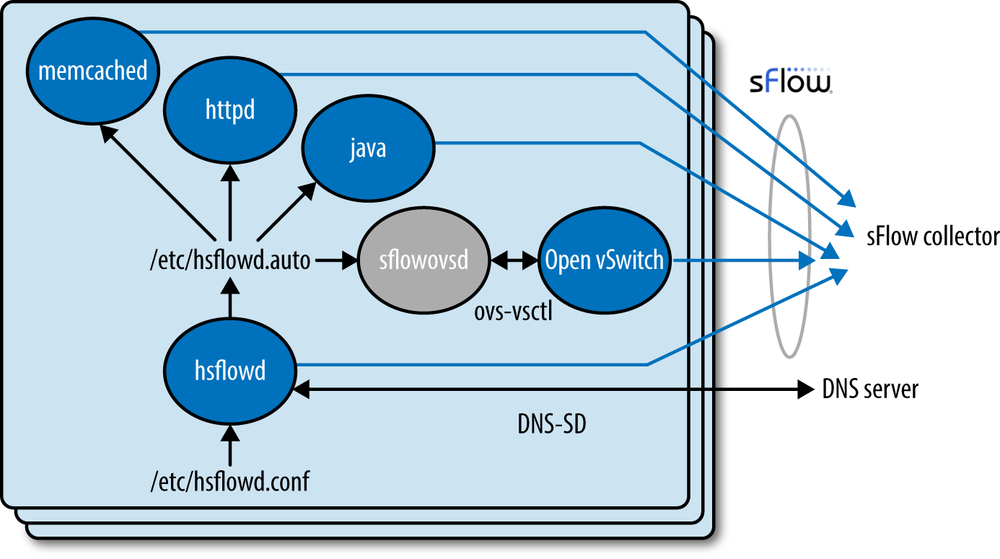
The hsflowd daemon writes configuration information that it receives via DNS-SD or through its configuration file to the /etc/hsflowd.auto file. Other sFlow subagents running on the host automatically detect changes to the /etc/hsflowd.auto file and apply the configuration settings.
The sFlow protocol allows each subagent to operate autonomously and send an independent stream of metrics to the sFlow collector. Distributing monitoring among the agents eliminates dependencies and synchronization challenges that would increase the complexity of the agents.
Note
Extending the functionality of Host sFlow using subagents differs from gmond’s use of modules (see the section Extending gmond with Modules), but is very similar in approach to adding custom metrics using gmetric (see the section Extending gmond with gmetric). In fact, gmetric can easily be used to add custom metrics to the standard metrics exported using sFlow (see Custom Metrics Using gmetric).
Each of the sFlow subagents is responsible for exporting a different set of metrics. At the time of writing, the following subagents are available:
- hsflowd
The Host sFlow daemon exports standard host metrics (see Server Metrics), and can also export per-virtual-machine statistics (see Hypervisor Metrics) when run on a Hyper-V, Xen, XenServer, or KVM hypervisor. In addition, network traffic monitoring using iptables/ULOG is supported on Linux platforms.
- Open vSwitch
The Open vSwitch is the default switch in XenServer 6.0, the Xen Cloud Platform, and also supports Xen, KVM, Proxmox VE, and VirtualBox. It has also been integrated into many virtual management systems including OpenStack, openQRM, and OpenNebula. Enabling the built-in sFlow monitoring on the virtual switch offers the same visibility as sFlow on physical switches, providing a unified, end-to-end view of network performance across the physical and virtual infrastructure. The sflowovsd daemon ships with Host sFlow and automatically configures sFlow monitoring on the Open vSwitch using the
ovs-vsctlcommand. Similar integrated sFlow support is available for the Microsoft extensible virtual switch that is part of the upcoming Windows Server 2012 version of Hyper-V.- jmx-sflow-agent
The Java sFlow agent is invoked on the Java command line, easily adding monitoring to existing Java applications and exporting standard metrics (see Java Virtual Machine Metrics).
- tomcat-sflow-valve
This is a Tomcat Valve that can be loaded in an Apache Tomcat web server to export Java metrics (see Java Virtual Machine Metrics) and HTTP metrics (see HTTP Metrics).
- mod-sflow
This is a module for the Apache web server that exports HTTP metrics (see HTTP Metrics).
- nginx-sflow-module
This is a module for the NGINX web server that exports HTTP metrics (see HTTP Metrics).
- sflow/memcached
This project tracks the latest memcache release and includes an embedded sFlow subagent that exports memcache metrics (see memcache Metrics).
Custom Metrics Using gmetric
One of the strengths of Ganglia is the ability to easily add new metrics. Although the Host sFlow agent doesn’t support the addition of custom metrics, the Ganglia gmetric command-line tool provides a simple way to add custom metrics (see Extending gmond with gmetric).
For example, the following command exports the number of users currently logged into a system:
gmetric -S 10.0.0.1:server1 -n Current_Users -v `who |wc -l` -t int32 -u current_users
Using the -S or --spoof
option ensures that the receiving gmond instance correctly associates
metrics sent using gmetric with metrics sent by hsflowd. The spoof
argument is a colon-separated string containing an IP address and a
hostname. The Host sFlow daemon writes information about its
configuration and sFlow settings into the /etc/hsflowd.auto file, including the IP
address and hostname used when it sends sFlow data; the gmetric spoof
string must match these values.
The gmetric command-line tool is distributed with gmond and picks up settings from the gmond.conf file. Because there are no gmond instances running on the hosts in an sFlow deployment, eliminating the dependency on gmond.conf, gmond, and gmetric is worthwhile. The gmetric.py utility is a simple Python script that can be used a replacement for gmetric.
The following bash script demonstrates how configuration settings can be extracted from the hsflowd.auto file and used as arguments for the gmetric.py command:
#!/bin/bash
# Read configuration settings from hsflowd.auto
while IFS="=" read name value
do
  case "$name" in
    agentIP)
       SPOOF_IP=$value
       ;;
    hostname)
       SPOOF_HOSTNAME=$value
       ;;
    collector)
       set $value
       HOST=$1
       PORT=$(($2-6343+8649))
       ;;
    *)
       ;;
  esac
done < /etc/hsflowd.auto

# Export one or more custom metrics using gmetric.py
/usr/local/bin/gmetric.py
 --host $HOST
 --port $PORT
 --spoof $SPOOF_IP:$SPOOF_HOSTNAME
 --name Current_Users
 --value `/usr/bin/who |/usr/bin/wc -l`
 --type int32
 --units current_users
Note
This script assumes that gmetric.py has been installed as an executable in /usr/local/bin. The calculation for the gmetric port is based on the numbering convention used in Configuring gmond to Receive sFlow, where the standard sFlow and gmetric ports are shifted by the same constant when creating multiple gmond instances.
Additional custom metrics can be added to the end of the script; ganglia/gmetric is a library of user-contributed gmetric scripts maintained by the Ganglia project on github. Scheduling the script to run every minute using cron allows Ganglia to automatically track the custom metrics.
Troubleshooting
Most problems with sFlow deployments occur because the sFlow datagrams are dropped somewhere between the sFlow agent and gmond. The following steps will help identify where measurements are being dropped.
Are the Measurements Arriving at gmond?
Use a packet capture tool, such as tcpdump, to
verify that the sFlow packets are arriving at the server running gmond.
The following command uses tcpdump to check for
packets arriving on UDP port 6343:
tcpdump -p udp port 6343
Note
Check every udp_recv_channel specified in
gmond.conf files in order to
verify that metrics are arriving (see Configuring gmond to Receive sFlow).
If the missing metrics are associated with a single host, use
tcpdump to filter on the specific host. The following
command verifies that sFlow data is arriving from host
10.0.0.237:
tcpdump -p src host 10.0.0.237 and udp port 6343
Warning
Packet capture using tcpdump occurs before server firewall rules
are applied. Don’t assume that the fact that packets are being
displayed by tcpdump means that the packets are being received by
gmond—packets can still be dropped by the firewall. Make sure that
incoming sFlow packets are permitted by the local firewall iptables on
a Linux system. Typically, UDP port 6343, the default sFlow port, is
required—but you will need to ensure that every
udp_recv_channel and
tcp_accept_channel configured in the gmond.conf file is allowed as an incoming
connection in the firewall rules.
Note
A quick way to check whether the firewall is the problem is to temporarily disable the firewall and see if metrics start to appear in Ganglia. However, this procedure should be performed only if the server is in a secure environment where the security risk of turning off the firewall is acceptable.
Next, use telnet to connect to the gmond
tcp_accept_channel and verify that the metrics appear
in the XML document. The following command assumes that the default
tcp_accept_channel setting, 8649, is being
used:
telnet localhost 8649
If metrics are missing from the XML output, the next step is to
verify that the metrics are arriving in the sFlow datagrams. The
sflowtool command is similar to
tcpdump, decoding and printing the contents of
network packets. However, whereas tcpdump is a
general purpose packet analyzer, sflowtool is
specifically concerned with sFlow data, performing a full decode of all
the sFlow metrics and attributes.
Warning
If you are monitoring Windows hosts and the charts aren’t
appearing in the Ganglia user interface but the data appears to be
correct in the XML output, make sure that
case_sensitive_hostnames is set to
0 in gmetad.conf.
The following command demonstrates how
sflowtool is used in combination with
tcpdump in order to print out the contents of the
sFlow datagrams and verify that specific metrics are being
received:
tcpdump -p -s 0 -w - udp port 6343 | sflowtool
Note
You can use sflowtool on its own to receive
and decode sFlow. However, when gmond is running, it will have opened
the port to listen for sFlow, blocking sflowtool
from being able to open the port. Using tcpdump
allows the packets to be captured from the open port and fed to
sflowtool. The alternative is to stop gmond before
running this test.
If you are receiving sFlow data, then sflowtool
will print out the detailed contents, and you should see output similar
to the following:
startDatagram =================================
datagramSourceIP 10.1.4.2
datagramSize 432
unixSecondsUTC 1339651142
datagramVersion 5
agentSubId 100000
agent 10.1.4.2
packetSequenceNo 464
sysUpTime 9244000
samplesInPacket 1
startSample ----------------------
sampleType_tag 0:2
sampleType COUNTERSSAMPLE
sampleSequenceNo 464
sourceId 2:1
counterBlock_tag 0:2001
adaptor_0_ifIndex 1
adaptor_0_MACs 1
adaptor_0_MAC_0 000000000000
adaptor_1_ifIndex 2
adaptor_1_MACs 1
adaptor_1_MAC_0 eedb257595e5
counterBlock_tag 0:2005
disk_total 64427231232
disk_free 51740361728
disk_partition_max_used 35.43
disk_reads 20349
disk_bytes_read 403682304
disk_read_time 181676
disk_writes 16994
disk_bytes_written 144289792
disk_write_time 1130328
counterBlock_tag 0:2004
mem_total 1073741824
mem_free 723337216
mem_shared 0
mem_buffers 17854464
mem_cached 192057344
swap_total 2181029888
swap_free 2181029888
page_in 201324
page_out 70454
swap_in 0
swap_out 0
counterBlock_tag 0:2003
cpu_load_one 0.000
cpu_load_five 0.000
cpu_load_fifteen 0.000
cpu_proc_run 1
cpu_proc_total 96
cpu_num 1
cpu_speed 3200
cpu_uptime 9298
cpu_user 5590
cpu_nice 5570
cpu_system 16120
cpu_idle 9204610
cpu_wio 66020
cpuintr 0
cpu_sintr 0
cpuinterrupts 231288
cpu_contexts 370635
counterBlock_tag 0:2006
nio_bytes_in 2514529
nio_pkts_in 7316
nio_errs_in 0
nio_drops_in 0
nio_bytes_out 1799289
nio_pkts_out 8199
nio_errs_out 0
nio_drops_out 0
counterBlock_tag 0:2000
hostname virtual-vm
UUID 7c270fa3830347a9b6aef60bac8cd16f
machine_type 3
os_name 2
os_release 2.6.18-308.1.1.el5xen
endSample   ----------------------
endDatagram   =================================
Note
The output of sflowtool consists of simple
key/value pairs that are easily processed using scripting languages
such as Perl. An example is given in Using Ganglia with Other sFlow Tools.
At this point, if the sFlow is being received and metrics are missing, it is likely that the sFlow agent has been incorrectly configured and the metrics aren’t being sent.
Are the Measurements Being Sent?
If possible, use sflowtool and tcpdump on the sending machine to verify that measurements are being transmitted. Again, it is possible that local firewall rules on the sending machine are preventing transmission of the sFlow datagrams. See Are the Measurements Arriving at gmond?.
Make sure to verify that the destination IP and port correspond to the gmond.conf file settings at the receiving end.
Check the configuration of the sFlow agent. Verify that the sFlow agent’s counter polling interval is configured and set to a reasonable value—a polling interval of 30 seconds is typical for sFlow deployments.
Warning
There are two types of sFlow data: periodic counters and randomly sampled packets/transactions. Ganglia gmond is able to process only counter data, so it is possible that sFlow sample records are being transmitted to gmond, but without counter records, Ganglia will not show any data.
If the measurements are being sent but not received, work with your network administrator to identify any firewall or ACL setting in intermediate switches, routers, or firewall that may be dropping the sFlow datagrams.
Using Ganglia with Other sFlow Tools
Ganglia is reporting an increase in HTTP traffic to your web servers—how do you know whether you are the target of a denial of service attack, or a marketing promotion has just gone viral? You are seeing an increase in cache misses to your memcached cluster—how can you fix the problem? If you are using sFlow agents to generate the metrics, you have the data to answer these types of question at your fingertips.
The metrics that Ganglia displays are only part of the information
contained in an sFlow stream. For example, the
mod_sflow agent running in Apache servers also randomly
samples HTTP operations, sending records that include attributes such as
URL, user-agent, response time, client socket, and bytes transferred; see
Table 8-5. Accessing the
sampled HTTP operations allows you to dig deeper into a trend and identify
the source of the increased traffic.
The following sflowtool output shows the HTTP counters and operation
samples reported by mod_sflow:
startDatagram =================================
datagramSourceIP 10.0.0.150
datagramSize 132
unixSecondsUTC 1339652714
datagramVersion 5
agentSubId 0
agent 10.0.0.150
packetSequenceNo 30526
sysUpTime 3981481944
samplesInPacket 1
startSample ----------------------
sampleType_tag 0:2
sampleType COUNTERSSAMPLE
sampleSequenceNo 19510
sourceId 3:80
counterBlock_tag 0:2002
parent_dsClass 2
parent_dsIndex 1
counterBlock_tag 0:2201
http_method_option_count 0
http_method_get_count 55755
http_method_head_count 4
http_method_post_count 1359
http_method_put_count 0
http_method_delete_count 0
http_method_trace_count 0
http_methd_connect_count 7
http_method_other_count 0
http_status_1XX_count 0
http_status_2XX_count 54577
http_status_3XX_count 2211
http_status_4XX_count 314
http_status_5XX_count 23
http_status_other_count 0
endSample   ----------------------
endDatagram   =================================
startDatagram =================================
datagramSourceIP 10.0.0.150
datagramSize 264
unixSecondsUTC 1339652714
datagramVersion 5
agentSubId 0
agent 10.0.0.150
packetSequenceNo 30527
sysUpTime 3981483944
samplesInPacket 1
startSample ----------------------
sampleType_tag 0:1
sampleType FLOWSAMPLE
sampleSequenceNo 28550
sourceId 3:80
meanSkipCount 2
samplePool 57126
dropEvents 2
inputPort 0
outputPort 1073741823
flowBlock_tag 0:2100
extendedType socket4
socket4_ip_protocol 6
socket4_local_ip 10.0.0.150
socket4_remote_ip 10.0.0.70
socket4_local_port 80
socket4_remote_port 63729
flowBlock_tag 0:2206
flowSampleType http
http_method 2
http_protocol 1001
http_uri /index.php
http_host 10.0.0.150
http_useragent curl/7.21.4
http_request_bytes 0
http_bytes 0
http_duration_uS 1329
http_status 403
endSample   ----------------------
endDatagram   =================================
The following example demonstrates how the sflowtool output can be used to generate additional metrics. The Perl script uses sflowtool to decode the HTTP request data and calculates average response time over a minute, printing out the results:
#!/usr/bin/perl -w
use strict;
use POSIX;

my $total_time = 0;
my $total_requests = 0;
my $now = time();
my $start = $now - ($now % 60);

open(PS, "/usr/local/bin/sflowtool|") || die "Failed: $!
";
while( <PS> ) {

  my ($attr,$value) = split;

  # process attribute
  if('startDatagram' eq $attr) {
    $now = time();
    if($now - $start >= 60) {
      if($total_requests > 0) {
        printf "%d %d
", $start, int($total_time/$total_requests);
      }
      $total_time = 0;
      $total_requests = 0;
      $start = $now - ($now % 60);
    }
  }
  if('http_duration_uS' eq $attr) {
    $total_time += $value;
    $total_requests++;
  }
}
The output of the script follows. The first column is the time (in seconds since the epoch) and the second column is the average HTTP response time (in microseconds):
[pp@pcentos ~]$ ./http_response_time.pl
1339653360 2912326
1339653420 3002692
1339653480 1358454
1339653540 3983638
This example demonstrated how sampled transactions can be used to generate new metrics. The metrics can be fed back to Ganglia using gmetric; see Custom Metrics Using gmetric.
Note
This is just one simple example. There are many metrics that can be calculated based on the detailed information in transaction samples. Using sflowtool to pretty-print sFlow records is a good way to see the information that is available and experiment with calculating different metrics.
You don’t have to write your own analysis scripts. The sFlow data can be converted into different forms for compatibility with existing tools. For example, the following command uses sflowtool to convert the binary sFlow HTTP operation data into ASCII CLF so that the operations can be visually inspected or exported to a web log analyzer such as Webalizer:
sflowtool -H | rotatelogs log/http_log
You can also use protocol reporting tools such as Wireshark with sFlow, using sflowtool to convert sFlow into the standard PCAP format:
wireshark -k -i <(sflowtool -t)
In addition, there are a broad range of native sFlow analysis options that provide complementary functionality to Ganglia’s. The sFlow.org website contains a list of open source and commercial sFlow analysis tools—including Ganglia, of course!
When using multiple sFlow analysis tools, each tool needs to receive copies of the sFlow packets. There are two main approaches to replicating sFlow:
- Source replication
Configure each sFlow agent to send sFlow packets to multiple destinations. Because sFlow is a unicast protocol, this involves resending packets to each of the destinations and this increases measurement traffic on the network. The additional traffic is generally not an issue, as each sFlow agent generates a small number of packets.
- Destination replication
Some sFlow analyzers have built-in replication and packet forwarding capabilities, and there are commercial and open source UDP replication tools available, including
sflowtool.
Finally, the case study Tagged, Inc. demonstrates how Ganglia and sFlow are used in a large deployment, illustrating the techniques described in this chapter and providing examples that demonstrate the importance of performance monitoring to the operations and developer teams.