CHAPTER 6
Managing Project Schedule
In this chapter, you will
•Plan schedule management
•Define the project activities
•Sequence the project activities
•Estimate activity duration
•Develop the project schedule
•Control the project schedule
Time has a funny way of sneaking up on you—and then easing on by. As a project manager, you’ve got stakeholders, project team members, and management all worried about your project deliverables, how the project is moving forward, and when, oh when, the project will be done. You’ve also got vacations, sick days, demands from other project managers, and delays from vendors to deal with.
Management frets over how much a project will cost. Project customers fret over the deliverables the project will create. Everyone, as it turns out, frets over how long the project will take. Of course I’m talking about the Triple Constraints of Project Management: cost, scope, and schedule. If any one of these constraints is out of balance with the other two, the project is unlikely to succeed. The schedule, as it happens, is often the toughest of the three constraints to manage, because interruptions come from all sides of the project.
Your Project Management Institute (PMI) exam and this chapter will cover schedule management for predictive and agile projects. The processes within project schedule management, like much of project management, are interdependent on one another and on other processes in the project management life cycle. In a predictive project, you’ll likely be using the critical path approach to project schedule management. In an agile project, you’ll use time-boxed iterations or sprints to manage the project schedule and the project execution.
Adaptive environments use a product backlog, unlike a predictive environment. Recall that the product backlog is a list of prioritized requirements, or user stories. The project team assigns story points to the user stories as a way to estimate the amount of effort required to create these requirements, and there are only so many story points available per time-boxed iteration. In other words, the team defines how much they can feasibly get done in an iteration based on the complexity of the user stories. This agile approach helps ensure realistic expectations of what can be completed in an iteration and assures the product owner that the most important requirements are built first. This is my favorite idea of agile projects: eat your dessert first.
Let’s get into project schedule management right now!
Planning Schedule Management
The project management planning processes are iterative, as you know, and will happen over and over throughout the project. You and the project team—and even some key stakeholders—will work together to define the project’s schedule management plan. This will happen early in the project’s planning processes, but you’ll probably need to return to schedule management planning to adjust, replan, or focus on the schedule you’ve created for the project.
Planning schedule management is not the creation of the actual project schedule. That’d be too easy. Instead, the schedule management plan defines how the project’s policies and procedures for managing the project schedule will take place. You’ll define the procedures for completing schedule management.
Of course, agile projects don’t include the overhead of detailed project schedule planning. You’ll instead work with a fixed schedule and then create as many requirements as time allows and the team’s velocity permits. With a fixed schedule, or deadline, you’ll start with the most important requirements first so there’s less risk of running out of time and not creating value—something we always fear in predictive environments.
 EXAM TIP For your exam, you’ll need to know both the predictive and agile approaches to project scheduling management, even if you don’t use both approaches on your projects. Just remember that agile projects have a fixed schedule, while predictive projects predict duration.
To do this planning, you’ll gather your project team, key stakeholders, and subject matter experts such as people from management and consultants to help you plan what it is you’re about to schedule. You’ll need the project management plan, the project charter, enterprise environmental factors, and organizational process assets.
Creating the Schedule Management Plan
The actual process of creating the schedule management plan involves you, the project team, and other experts meeting to discuss and agree upon the policies and procedures the schedule management processes should have. You’ll rely on organizational process assets for much of the discussion: historical information, past project information, and existing organizational processes.
This event of creating the schedule management plan may also include the identification and approval of the tools and techniques to be used for scheduling and controlling the project work. For example, an organization may not allow an employee to work more than a certain number of hours on the project. Or the organization could prevent certain activities from being done in tandem because of the associated risks. Every organization and its approach will be different, so you’ll need to know if your company has any restrictions, scheduling rules, or policies on overtime, labor utilization, or coordination of resources. These will all affect the actual schedule of the project and should be documented in the project’s schedule management plan.
During the creation of the plan, you’ll also identify any software you’ll utilize for scheduling the project work, tracking project performance, completing tasks, managing workflow, and reporting. This is the project management information system that will assist you in your project management duties.
Examining the Schedule Management Plan
The schedule management plan could be adapted from a previous project, or, if you need to, you could design the plan from scratch. For your PMP examination, you should be familiar with the information documented in the plan:
•Project schedule model development This approved scheduling methodology and project management information system will help you develop the project schedule.
•Project schedule model maintenance You’ll use this component of the plan when you update the project progress.
•Release and iteration length If you’re working in an adaptive environment, you’ll define how long the time-boxed iterations will last (for example, two or four weeks per iteration).
•Level of accuracy You’ll need to establish confidence in the provided project duration estimates (such as +/–48 hours, or 10 percent), any rounding of hours (for example, you could say the smallest task assignment is one workday), and how confident you are in your ability meet the project’s deadline, if one exists.
•Units of measure Your schedule management plan can define the schedule in hours, days, weeks, or even percentage of employee schedule.
•Organizational procedure links The schedule management plan is part of the overall project management plan and is a project deliverable that will become part of historical information. The work breakdown structure (WBS) is linked to the schedule management plan as the duration estimates are linked to the activities and the WBS work packages.
•Control thresholds Depending on the confidence in the activity duration estimates, a level of tolerance for the project schedule should be identified, such as +/−10 percent. This is considered the threshold or tolerance for error. Any value outside the 10 percent will be a cause for a corrective action in the project.
•Rules of performance measurement The schedule management plan should define how the project will be measured for performance. The most common approach is a suite of formulas called earned value management. (I’ll discuss these in detail in Chapter 7.)
•Reporting formats Based on project performance, the project manager will need to report the schedule status to management, key stakeholders, and project customers.
Utilizing an On-Demand Scheduling Approach
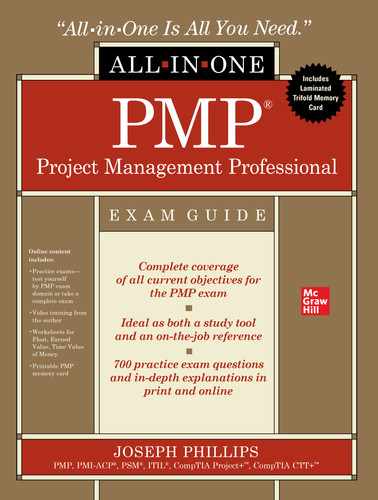
On-demand scheduling also uses a backlog of requirements, but as resources become available in the project, the next requirement is launched. This pull-based approach to scheduling stems from lean manufacturing and is used with a Kanban system, which you learned about in Chapter 2. You’ll remember that the Kanban board is used to show what’s being worked on (the work-in-progress, or WIP), which requirements are completed, and which requirements still need to be worked on until each process reaches the “done” stage. You pull the requirements from left to right as the project moves through the stages of production, as shown in the example in Figure 6-1. Agile approaches use shorter increments of project work versus longer phases that you may enjoy in a predictive environment.
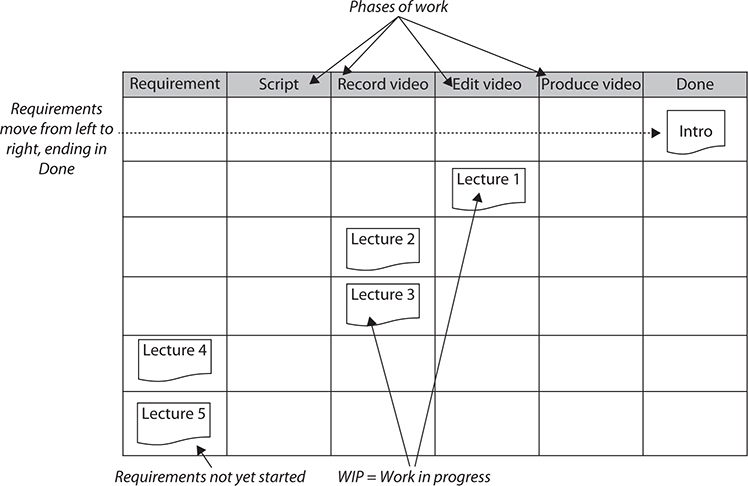
Figure 6-1 A Kanban board shows work in progress and completed phases of work.
Defining the Project Activities
When a project is first initiated, project managers often focus immediately on the labor and activities that will be required to complete the project work. But that focus ignores the scope. In Chapter 5, I discussed the project scope and the WBS as prerequisites to defining the project activities. For your PMI examination, know the following sequence of events for predictive projects that the project manager should have in place before getting to the work the project team will complete:
1.Project scope statement
2.Work breakdown structure
3.WBS dictionary
4.Work packages
5.Schedule activities
The work package, the smallest item in the WBS, is broken down into schedule activities, which include the labor to create the things defined in the WBS. The WBS, of course, reflects the project scope statement. The preceding list is the logical sequence of how the project management team will work together to create the activity list, but there are just three inputs to activity definition:
•Project management plan (specifically the schedule management plan and the scope baseline)
•Organizational process assets
•Enterprise environmental factors
These inputs and the order of precedence mentioned earlier will help the project team define the activities to create the components of the project scope. We’re still in the planning process group, so this process is iterative. Any changes to the project scope will likely cause the project manager to revisit these processes throughout the project.
Making the Activity List
You and your project team are armed with the inputs I’ve listed previously and are ready to start defining the activities you’ll need to create the project schedule in a predictive project. For agile projects, the activity list is built from the selected user stories from the product backlog in each sprint planning meeting. This iterative activity maps out the work the development team will tackle in the next sprint. The selected user stories become the sprint backlog, and then task definition occurs. The development team is self-organizing, so the team will decide who does what in the iteration.
Predictive projects have a bit more front-loaded overhead when it comes to scheduling. The activity list definition process and its complexity will be in proportion to the size of the project scope. In other words, larger projects require more detail and more planning time, while smaller projects, such as changing all the keyboards in your company, won’t be all that complicated or too time-consuming to plan.
![]() EXAM COACH My advice to you—the Project Management Professional (PMP) candidate—for your exam is to think of the largest project you can imagine, such as creating a skyscraper, and then you’ll understand why you need to use all or most of these project processes.
EXAM COACH My advice to you—the Project Management Professional (PMP) candidate—for your exam is to think of the largest project you can imagine, such as creating a skyscraper, and then you’ll understand why you need to use all or most of these project processes.
Let’s look at the methods used to define the project activities, which the following sections explain in detail.
Decomposing the Work Packages
Yep, more decomposition. You know that the project scope is decomposed into deliverables, and then those deliverables are decomposed into work packages, the smallest item in the WBS. Now that you and your project team are focused on defining the project activities, you’ll be breaking down the work packages into the labor needed to create each work package.
Some project managers follow a sequential pattern for this process. First, they decompose the project scope into first-tier deliverables, then they decompose those project deliverables into second-tier deliverables, and so on, until they’ve created the work packages. Armed with the work packages, they’ll decompose those into the schedule activities we’re discussing here. Other project managers will decompose the project scope, then the work packages, and then create the schedule activities in one swoop.
Either approach, in fact, is just fine—even with our pals at the PMI. Complete decomposition of the project scope down to the schedule activities is needed—how you get there doesn’t matter. What matters is that all the work packages are decomposed and that the project management team follows the internal policies and procedures (if they exist) to create the schedule activities.
Relying on Templates
Who wants to start a project from scratch when you’ve got an older, similar project just waiting to be manipulated? That older, similar project is a template. Sometimes in the project management world, we think of a template as an empty shell with prepopulated fields and deliverables—and that’s fine. A template can also be an older, similar project that can be used and updated for the current project.
A project manager can use a standard activity list if the project work is similar to past projects. There’s no real advantage to starting from scratch. Templates can include not only the activity list, but also the resource skills, estimated hours of effort, risks, deliverables, and any relevant project work information.
EXAM TIP If an organization is completing the same type of project work over and over they don’t have to start from scratch. Even agile projects can begin the project with a predefined list of requirements and defined activities. For the exam, remember that templates are past project files that can be manipulated and used for the current project.
Using Rolling Wave Planning
Have you ever done “the wave” at a football game? You can see the wave moving toward you from across the stadium, then you’re in it, and then it surges past. The rolling wave in project management planning includes the iterations of planning and then doing the project work. Progressive elaboration, which you use to create the WBS and the WBS dictionary, is an example of rolling wave planning.
Rolling wave planning considers the big picture of what the project scope will create but focuses on the short-term activities to move the project along. Figure 6-2 shows how a project to create a piece of software considers all the project requirements for the deliverable, but focuses on the immediate activities necessary to complete a portion of the deliverable. Once that work is done, the project management team convenes and plans how to create the next portion of the project. The team plans, does the work, and then reconvenes for more planning.

Figure 6-2 Rolling wave planning details the imminent work and keeps future work at the high level.
EXAM TIP Remember that rolling wave planning focuses on the immediate while considering the big picture of the project. (Which is easier to plan and accomplish: what you must do this week, or what you must do during a week a year from now?)
Using Expert Judgment
Let’s face facts. As a project manager, you aren’t always the person who knows the most about the work that the project centers on. Using expert judgment is about working smart, not hard. The project manager relies on the project team, subject matter experts, and consultants to help determine the work that needs to be completed to create the project scope. You’ll see expert judgment throughout this book and the PMBOK Guide. It’s simply about leveraging other people’s brainpower so that the project manager can make the best decisions regarding the project.
Creating Planning Components
A third element of the scope baseline is the WBS, which uses a component that has hooks into project time performance: a control account. A control account is a marker within the WBS that tracks the performance of the work packages associated with the control account. For example, a home construction project could create a control account for the basement, first floor, and second floor. The work packages associated with each floor of the house are tracked by the corresponding control account. Now you can see an overall performance of the project, or you can see how each control account is performing.
Of course, there’s no predetermined rule about how you use control accounts, except that a work package can be associated with only one control account at a time. In the home construction project, you could create control accounts for framing, electrical, plumbing, even landscaping, and track the performance by these categories. The performance information you’ll most likely use is earned value management (EVM)—something we’ll get into in detail in Chapter 7. For now, know that control accounts enable you to track performance for separate chunks of the WBS by using EVM to track performance in time and cost.
Sometimes enough information just isn’t available in the WBS to determine what activities are needed in the activity list. Let’s go back to the new home construction project. Your customers in this instance knows the dimensions of the kitchen, but they don’t know what type of appliances, cabinets, or even tile they want to put into their deluxe kitchen. This isn’t a problem at the beginning of the project because your construction team can get to work building the home, but eventually the homeowners must decide on the materials and components they’ll want in their fancy-schmancy kitchen.
The kitchen may have a budget, but how the budget will be consumed isn’t yet known, because the homeowners haven’t decided where in the kitchen they’ll spend their monies. The effort to create the deliverables in the kitchen may also fluctuate based on the types of materials and deliverables the homeowners elect to include in their kitchen.
What you can use in these instances is a planning package, a signal that decisions need to be made by a given date or instance. In our home construction project example, a control account could capture the kitchen, while a planning package could represent the decision for the cabinets. Another planning package could capture the appliances, and a third could capture the decision for the kitchen flooring. We know these three things are needed in the kitchen (cabinets, appliances, and flooring), but we don’t know exactly what schedule activities are needed, because not enough information is yet known.
A good example of a hybrid project, where you’re using predictive and Agile project management approaches, is the WBS and planning packages. You don’t really have to know everything up front in a project to get to work. So those planning packages and control account plans can be treated as Agile. You have a predetermined deadline and a budget for the kitchen. Create a product backlog for the elements in the kitchen, prioritize them, and work accordingly. The catch can be, of course, that some decisions are going to be difficult to undo, because, for example, the cabinet selection will affect where the appliances can go, but you can still prioritize and work accordingly.
Examining the Activity List
The primary output of decomposing the work is the activity list, a collection of all the work elements required to complete the project. The activity list is actually an extension of the WBS and will serve as a fundamental tool in creating the project schedule. The activity list is needed to ensure that all the deliverables of the WBS are accounted for and that the necessary work is mapped to each work package.
The activity list also ensures that no extra work is included in the project. Extra work costs time and money—and defeats the project scope. The WBS comprises all the components the project will create, while the activity list is made up of all the work required to create the components within the WBS. In addition, the work on the activity list includes attributes of each identified activity. This ensures three things:
•That the team members agree on what each activity accomplishes
•That the work supports and creates the WBS deliverables
•That the work is within the project scope
Documenting the Activity Attributes
Every activity in the activity list has attributes that must be documented. The documentation of each activity’s characteristics will help with additional planning, risk identification, resource needs, and more. Of course, the activities and depth of the attributes will vary by project discipline. For your PMI exam, here are some attributes you should consider:
•Activity identifier
•Activity codes
•Activity description
•Predecessor and successor activities
•Logical relationships
•Leads and lags
•Resource requirements
•Imposed dates
•Constraints and assumptions
•Responsibility of the project team member(s) completing the work
•Location of the work
•Type and amount of effort needed to complete the work
These activity attributes are especially useful for generating reports. With this information, you could quickly filter the activities to identify the work where a particular vendor is involved. Or you could filter the events based on location, risk, and project team member. You could use the activity attributes in nearly endless ways to help you communicate information to management, to stakeholders, and to your project team.
EXAM TIP You should know that level of effort (LOE) and apportioned effort (AE) can be part of the activity description. LOE activities are the project maintenance–type activities that have to be done over and over: budgeting, reporting, communicating. These activities almost always go to the project manager. AE activities can’t be easily broken down into individual, traceable events. For example, quality assurance is part of every project activity, but it isn’t just one activity in the project.
Building the Milestone List
Milestones are significant markers of progress in a project. If you’re building a house, you could say the first milestone is the design of the house. The next milestone will be securing the permits from your city government. Then it’s building the foundation. And you’ll continue to identify the milestones that represent the big successes within the project. Milestones are often, but not always, created at the end of a phase in the project life cycle. The milestone list identifies all the milestones you’ve identified in the project, when you’re expected to reach each milestone, and can, as things progress, show any variances between the planned date of the milestone and the actual realization of the milestone. To be clear, milestones are just markers—no duration is assigned to the milestone; duration is assigned to activities, not milestones.
Creating the Product Roadmap
In adaptive projects you’ll work with a product roadmap in lieu of a milestone list. A product roadmap is a tool to show the major product deliverables, when they’ll be available based on project conditions, and how the product can grow. A product roadmap also helps you, or the product owner, to secure project funding, because it’ll show the business value the adaptive project will create. Product roadmaps aren’t easy to create because adaptive projects change frequently; you don’t want the product roadmap to be so tight that it doesn’t allow changes, but you also don’t want it to be so loose that there’s little value in the document.
Product roadmaps don’t get married to specific project deliverables, but rather embrace goals, visions, and business value. Product roadmaps identify the pain points of an organization, the business value of why the project is being undertaken, and loosely tie the forecasted deliverables to the overall goals and solutions of the project. This enables the project requirements to shift as expected in an agile project without conflicting with big promises in the product roadmap.
The product roadmap aims to describe what the project will accomplish more than what the project will create. It can be used to describe when releases from the project will happen, such as, “when this business value is realized, a release will go live in the organization.” It’s tricky business, but it needs to be created to communicate what the project will accomplish and to ensure stakeholders that the project will create value in ratio to the cost and time needed for the project to exist.
Updating the Work Breakdown Structure
When creating the activity list, the project team and the project manager may discover discrepancies or inadequacies in the existing WBS. Updates to the WBS enable the project manager to ensure that all the needed project deliverables are included in the WBS and then to map the discovered deliverables to the identified work in the activity list. When you add items to the WBS, remember that you’ll need to provide a change request. The change request must flow through integrated change control.
In addition, the elements within the WBS may not be defined fully or correctly. During the decomposition of the work, elements of the WBS may need to be updated to reflect the proper description of the elements. The descriptions should be complete and full and leave no room for ambiguity or misinterpretation. Finally, updates to the WBS may also include cost estimates to the discovered deliverables.
 NOTE Updates to the WBS are called refinements. As the project moves toward completion, refinements ensure that all the deliverables are accounted for within the WBS. They may also call for, indirectly, updates to the activity list.
Sequencing the Project Activities
Now that the activity list has been created, the activities must be arranged in a logical sequence. This process calls on the project manager and the project team to identify the logical relationships between activities, as well as the preferred relationship between those activities. This can be accomplished in a few different ways:
•Computer-driven Many different scheduling and project management software packages are available. These programs can help the project manager and the project team determine which actions need to happen in what order and with what level of discretion.
•Manual process In smaller projects, and on larger projects in the early phases, manual sequencing may be preferred. An advantage of manual sequencing is that it’s easier to move around dependencies and activities than it is in some programs.
•Blended approach A combination of manual and computer-driven scheduling methods is fine. It’s important to determine the correctness of the activity sequence, however. Sometimes a blended approach can be more complex than relying on just one or the other.
Considering the Inputs to Activity Sequencing
There are many approaches to completing activity sequencing. Perhaps the best approach, however, is activity sequencing that involves the entire project team, rather than being a solo activity. The project manager must rely on the project team and these inputs to activity sequencing:
•Project management plan The schedule management plan is needed because it will direct how the activity sequence is to occur. The scope baseline is also needed because the project scope statement, WBS, and WBS dictionary will help identify the activities you’re about to sequence.
•Project documents From the project documents, you’ll need the activity list, the list of actions needed to complete the project deliverables. You’ll need the activity attributes, because each scheduled activity has attributes that need to be documented. For example, the successor and predecessor of each activity, the lead and lag information, and the person responsible for completing the activity should all be documented. This information is important when it comes to schedule development and project control. You’ll also reference the assumptions log for identified assumptions about the project activities, and you’ll also need the milestone list you’ve created.
•Organizational process assets If you’ve done this type of work in the past, you can rely on historical information to help you sequence the current work.
•Enterprise environmental factors Any rules or regulations that you must follow in your project’s activity sequencing must be documented and upheld.
Creating Network Diagrams
Network diagrams help you visualize the project work. A network diagram shows the relationships between the work activities and how they will progress from start to completion. These diagrams can be extremely complex or easy to create and configure. Most network diagrams in today’s project management environment use an approach called “activity-on-node” to illustrate the activities and the relationships among those activities.
EXAM TIP Older network diagramming methods used “activity-on-arrows” to represent the activities and their relationships. In the exam, don’t be tempted to choose activity-on-arrows, because this diagramming method is long gone from the PMBOK.
Using the Precedence Diagramming Method
The precedence diagramming method (PDM) is the most common method of arranging the project work visually. The PDM puts the activities in boxes or circles, called nodes, and connects the boxes with lines. The lines represent the relationships and dependencies of the work packages. The following illustration shows a simple network diagram using PDM:

NOTE PDM is the most common approach to network diagramming because it’s used by most project management information systems. It can also be done manually, however.
Relationships between activities in a PDM constitute one of four different types (as shown in Figure 6-3):
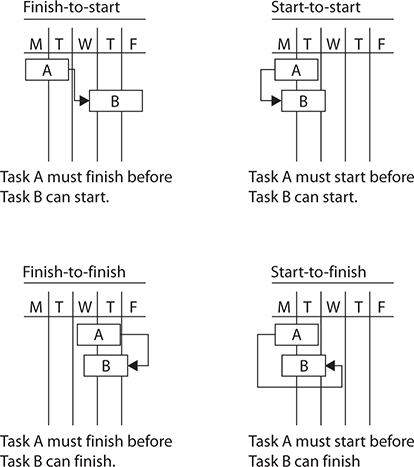
Figure 6-3 Task relationships can vary, but finish-to-start is the most common.
•Finish-to-start (FS) This relationship means that Task A must be completed before Task B can begin. This is the most common relationship. For example, in a construction project, the foundation must be set before the framing can begin.
•Start-to-start (SS) This relationship means that Task A must start before Task B can start. This relationship enables both activities to happen in tandem. For example, a crew of painters is painting a house. Task A is to scrape the flecking paint off the house, and Task B is to prime the house. The workers scraping the house must start before the other workers can begin priming the house. All the scraping doesn’t have to be completed before the priming can start, just some of it.
•Finish-to-finish (FF) This relationship means that Task A must be completed before Task B is completed. Ideally, the two tasks should finish at exactly the same time, but this is not always the case. For example, two teams of electricians may be working together to install new telephone cables throughout a building by Monday morning. Team A is pulling the cable to each office. Team B, meanwhile, is connecting the cables to wall jacks and connecting the telephones. Team A must pull the cable to the office so that Team B can complete their activity. The activities need to be completed at nearly the same time, by Monday morning, so that the new phones are functional.
•Start-to-finish (SF) This relationship is unusual and is rarely used. It requires that Task A start so that Task B may finish. Such relationships may be encountered in construction and manufacturing. It is also known as just-in-time (JIT) scheduling. An example is a construction of a shoe store. The end of the construction is soon, but an exact date is not known. The owner of the shoe store doesn’t want to order the shoe inventory until the construction is nearly complete. The start of the construction tasks dictates when the inventory of the shoes is ordered.
NOTE I like to use the just-in-time scheduling as a practical way to describe a start-to-finish relationship. In my example, it’s really some soft logic by the scheduler, as lead time for the ordering of the shoes could account for the construction of the project. Having said that, I still like to use something physical that most people can visualize and relate to. Now I’ll get geeky—well, geekier. A true example of a start-to-finish relationship involves chemical reactions, where a chemical reaction cannot finish before another reaction starts. In this chemical environment, it is hard logic—the reaction must happen in a particular order to get the desired effect.
Utilizing Network Templates
As with WBS templates, a project manager can rely on network templates that may be available to streamline the planning process or to conform to a predetermined standard. Network templates can represent an entire project, if appropriate, although portions of a network template, such as the required project management activities, are common.
The portions of a network template are also known as subnets or fragnets. Subnets are often associated with repetitive actions within a network diagram. For example, each floor in a high-rise apartment building may undergo the same or similar actions during construction. Rather than complete the network diagram for each floor, a subnet can be implemented.
Determining the Activity Dependencies
The progression of the project is built on the sequence of activities. In other words, predecessor activities must be complete before successor activities can begin. The following are the dependencies you should know for your PMP exam:
•Mandatory dependencies These dependencies are the natural order of activities. For example, you can’t begin building your house until your foundation is in place. These relationships are called hard logic.
•Discretionary dependencies These dependencies are the preferred order of activities. Project managers should use these relationships at their discretion and document the logic behind the decision. Discretionary dependencies enable activities to happen in a preferred order because of best practices or conditions unique to the project work, or because of external events. For example, a painting project typically allows the primer and the paint to be applied within hours of each other. Because of expected high humidity during the project, however, all of the building will be completely primed before the paint can be applied. These relationships are also known as soft logic, preferred logic, or preferential logic.
•External dependencies As the name implies, these are dependencies outside of the project’s control. Examples include the delivery of equipment from a vendor, the deliverable of another project, or the decision of a committee, a lawsuit, or an expected new law.
•Internal dependencies Some relationships are internal to the project or the organization. For example, the project team must create the software as part of the project’s deliverable before the software can be tested for quality control.
![]() EXAM COACH You have dependencies for passing your PMI exam. It’s mandatory that you apply for the exam. You’ve an external dependency with the PMI approving your application—it’s somewhat out of your hands. You also have some discretionary dependencies, such as when you study, your mental attitude, and the order of the chapters you study. Take charge and keep pressing yourself toward passing the exam. You can do this!
EXAM COACH You have dependencies for passing your PMI exam. It’s mandatory that you apply for the exam. You’ve an external dependency with the PMI approving your application—it’s somewhat out of your hands. You also have some discretionary dependencies, such as when you study, your mental attitude, and the order of the chapters you study. Take charge and keep pressing yourself toward passing the exam. You can do this!
Considering Leads and Lags
Leads and lags are values added to activities to alter the relationship slightly between two or more activities. For example, a finish-to-start relationship may exist between applying primer and applying the paint to a warehouse. The project manager in this scenario has decided to add one day of lead time to the activity of painting the warehouse. Now the painting can begin one day before the priming is scheduled to end. Lead time is considered a negative value, because time is subtracted from the downstream activity to bring it closer to the start of the project.
Lag time is waiting time. Imagine a project to install wood floors in an office building. Currently, there is a finish-to-start relationship between staining the floors and adding a layer of shellac to seal them. The project manager has elected, because of the humidity in the building, to add two days of lag time to the downstream activity of sealing the floors. Now the shellac cannot be applied immediately after the stain, but must wait two additional days. Lag time is considered a positive value, since time is added to the project schedule.
This illustration shows the difference between lead and lag times. Leads and lags must be considered in the project schedule, since an abundance of lag time can increase the project’s duration. An abundance of lead time, while decreasing duration, may increase risks.

EXAM TIP Remember that lead time is always “accelerated time” and is negative time, because the work is moving closer to the project start date. Lag time is always waiting time and is considered positive time, because the project manager is adding time to the project schedule.
Estimating Activity Durations
How many times have you heard management ask, “Now, how long will all of this take?” Countless times, right? And maybe right after that, “How much will all of this cost?” We’ll talk about cost estimates in Chapter 7. For now, let’s talk about time.
The answer to the question “How long will it take?” depends on the accuracy of the estimates, the consistency of the work, the project management life cycle approach, and other variables within the project. The best a project manager can do is to create honest estimates based on the information provided. Until the schedule is finalized, no one will know the duration of the project.
First, you identify the activities, then sequence the activities, then define the resources, and then estimate durations. These processes are needed to complete the project schedule and the project duration estimate. These four processes are iterated as more information becomes available. If the proposed schedule is acceptable, the project can move forward. If the proposed schedule is too long, the scheduler can use a few strategies to compress the project. We’ll discuss the art of scheduling in the next section.
Activity duration estimates, like the activity list and the WBS, don’t come from the project manager—they come from the people completing the work. The estimates may also undergo progressive elaboration. In this section, we’ll examine the approach to completing activity duration estimates, the basis of these estimates, and how to allow for activity list updates.
Considering the Activity Duration Estimate Inputs
The importance of accurate estimates is paramount. The activity duration estimates will be used to create the project schedule and to predict when the project should end. Inaccurate estimates could cost the performing organization thousands of dollars in fines, missed opportunities, lost customers, or worse. To create accurate estimates, the project manager and the project team will rely on several inputs:
•Project management plan You’ll need the schedule management plan and the scope baseline.
•Activity lists You know this, right? Activity lists are the work elements necessary to create the deliverables.
•Activity attributes Effort is the amount of labor applied to a task. Duration, on the other hand, is how long the task is expected to take with the given amount of labor. For example, a task to unload a freight truck may take eight hours with two people assigned to the task. If the effort is increased by adding more labor to the task (in this instance, more people), then the duration of the task is decreased. Some activities, however, have a fixed duration and are not affected by the amount of labor assigned to the task. For example, installing a piece of software on a computer will take the same amount of time if one computer administrator is completing the work or if two computer administrators are doing it.
•Assumptions log You’ll need the assumptions log to reference any assumptions about the project work that may need to be challenged or studied at this portion of the project.
•Lessons learned register Activity duration information from past projects and past activities within a project may have lessons learned that you can reference for better planning in the current project.
•Milestone list The milestone list can help you identify and estimate activity durations for activities needed to reach the project milestones.
•Project team assignments The project team members who have been assigned to the project team are assigned roles to complete the project work.
•Resource breakdown structure This diagram shows a hierarchy of the resources, both physical resources and human resources, that are utilized on the project.
•Resource requirements Activity resource requirements define the resources (human or physical) needed to complete a particular activity. For example, a project to build a home will require lots of different resources: plumbers, electricians, architects, framers, and landscapers. The project manager would not, however, assign all the different resources to every task, but only to the tasks that the resource was qualified to complete. Remember that resources also include equipment and materials, so those are identified as part of the resource requirements as well.
•Resource calendars The project manager will need to know when resources are, or are not, available for utilization on the project.
•Risk register The risk register can help the project manager and the project team identify key activities and their associated risks. This information may influence the constraints and task relationships in the project. Should risks come true, there may also be consideration of the timing of risk responses. (I’ll talk more about risk management in Chapter 11.)
•Organizational process assets Okay, the big one here is historical information. Historical information is always an excellent source of data on activity duration estimates. It can come from several sources, such as the following:
•Historical information can come from project files on other projects within the organization.
•Commercial duration-estimating databases can offer information on how long industry-specific activities should take. These databases should take into consideration the materials and the experience of the resources, and they should define the assumptions the predicted work duration is based upon.
•Project team members may recollect information regarding the expected duration of activities. Though these inputs are valuable, they are generally less valuable than documented sources, such as other project files or the commercial databases.
•Enterprise environmental factors Your organization may require the project manager to use duration-estimating databases, productivity metrics based on your industry, or other commercially available information.
You’ll need to consider the resource capabilities of your project team. Consider a task in an architectural firm. Reason says that a senior architect assigned to the task will complete it faster than a junior architect will. Material resources can also influence activity time. Consider predrilled cabinets versus cabinets that require the carpenter to drill into each cabinet as it’s installed. The predrilled cabinets enable the job to be completed faster.
The project manager should also reference the project management plan. Specifically, the project manager and the project team must evaluate the risk register. Risks, good or bad, can influence the estimated duration of activities. The risks of each activity should be identified, analyzed, and then predicted as to their probability and impact. If risk mitigation tasks are added to the schedule, the mitigation activities will need their duration estimated and then sequenced into the schedule in the proper order. We’ll discuss risk in detail in Chapter 11.
Using Analogous Estimating
Analogous estimating relies on historical information to predict current activity durations. Analogous estimating, also known as top-down estimating, is a form of expert judgment. To use analogous estimating, activities from the historical project that are similar in nature are used to predict similar activities in the current project.
A project manager must consider whether the work has been done before and, if so, what help the historical information provides. The project manager must consider the resources, project team members, and equipment that completed the activities in the previous project compared with the resources available for the current project. Ideally, the activities should be more than similar; they should be identical. And the resources that completed the work in the past should be the same resources used in completing the current work. When the only source of activity duration estimates is the project team members, instead of expert judgment and historical information, your estimates will be uncertain and inherently risky.
EXAM TIP Remember that analogous estimating uses historical information and is more reliable than predictions from the project team members.
Applying Parametric Estimates
Quantitatively based durations use mathematical formulas to predict how long an activity will take based on the “quantities” of work to be completed. For example, a commercial printer needs to print 100,000 brochures. The workers include two press operators and two bindery experts to fold and package the brochures. The duration is how long the activity will take to complete, while the effort is the total number of hours (labor) invested because of the resources involved. The decomposed work, with quantitative factors, is shown in Table 6-1.

Table 6-1 Decomposed Work with Quantitative Factors
EXAM TIP Duration is how long an activity takes, while effort is the billable time for the labor to complete the activity. You’ll likely see questions dealing with these two terms on the exam, especially with regard to project costs. Consider, for example, an activity that is scheduled to last 40 hours. The project manager must consider the cost of the time of the person assigned to complete the project work. For example, a senior engineer may be able to complete the activity in 40 consecutive work hours, but the cost of this employee’s time may be more than the value of the activity. A part-time employee may be able to complete the task in two segments of 20 hours, at a substantially lower rate.
Creating a Three-Point Estimate
How confident can a project manager be when it comes to estimating? If the project work has been done before in past projects, then the level of confidence in the duration estimate is probably high. But if the work has never been done before, there are lots of unknowns—and with them comes risk. To mitigate the risk, the project manager can use a three-point estimate. A three-point estimate requires that each activity have three estimates: optimistic, most likely, and pessimistic estimates. This is also known as simple averaging. Based on these three estimates, an average can be created to predict how long the activity should take (see Figure 6-4).
Figure 6-4 Three-point estimates use the formula (optimistic + most likely + pessimistic)/3 to estimate an activity’s duration.
If you think this sounds familiar to the program evaluation and review technique (PERT), you’re correct. The formula for PERT is similar to the three-point estimate. PERT is (Optimistic + (4 × Most Likely) + Pessimistic)/6. The denominator is 6 in PERT because you’re using six factors. This is also known as weighted averaging. Triangular distribution is the average of the three factors. Beta distribution, which is PERT, uses a weight averaged for the most-likely time.
Estimating from the Bottom Up
If you were to start at a zero duration for your project and then began adding up the duration of each of the work packages, you’d be creating a bottom-up estimate. A bottom-up estimate is the most reliable type of duration estimate, because you are aggregating the predicted duration of each work package in the WBS. The challenge with a bottom-up estimate, however, is that you first need to create a WBS and the activity list in order to produce the estimate. That’s right—before you can create a bottom-up estimate you must first have the WBS.
This creates challenges for project managers and stakeholders alike. The stakeholders, such as management, want you to tell them how long the project will take to complete—and they want that prediction right now. Project managers want to provide an accurate estimate, but to do so, they must first create the project scope statement, decompose that into the WBS, then break down the work packages into the activity list, and then begin adding up the duration—that’s no quick and easy process.
The challenge is that, when there isn’t much information, such as early in the planning stage, it’s nearly impossible to provide an accurate duration estimate. Later in the planning stage, however, when the WBS is created, the project manager can provide a much more detailed duration estimate because there’s more information available. In addition to this, you truly don’t know how long (or really how much) a project will take (cost) until you’ve completed the project work—there’s uncertainty in the endeavor. But, as you know, no stakeholder is going to take “I’ll tell you how long the project takes to complete when I’m done” as an answer.
Factoring in Reserve Time
Parkinson’s Law states that “Work expands so as to fill the time available for its completion.” This little nugget of wisdom is oh-so-true. Consider a project team member who knows an activity should last 24 hours. The team member decides, in his own wisdom, to say that the activity will last 32 hours. These extra 8 hours, he figures, will allow plenty of time for the work to be completed should any unforeseen incidents pop up. The trouble is, however, that the task will magically expand to require the complete 32 hours. Why does this happen? Consider the following:
•Hidden time Hidden time, the time factored in by the project team member, is secret. No one, especially the project manager, knows why the extra time has been factored into the activity. The team member can then “enjoy” the extra time to complete the task at his leisure.
•Procrastination Most people put off starting a task until the last possible minute. The trouble with bloated, hidden time is that people may wait through the additional time they’ve secretly factored into the activity. Unfortunately, if something does go awry in completing the activity, the work result comes later than predicted.
•Demands Project team members may be assigned to multiple projects with multiple demands. The requirement to move from project to project can shift focus, result in a loss of concentration, and require additional ramp-up time as workers shift from activity to activity. The demand for multitasking enables project team members to take advantage of hidden time.
•On schedule Activities are typically completed on schedule or later, but rarely early. Workers who have bloated the activity duration estimates may finish their task ahead of when they promised, but they tend to hold onto those results until the activity’s due date. This is because workers aren’t usually rewarded for completing work early. In addition, workers don’t want to reveal the inaccuracies in their time estimates. Workers may believe future estimates may be based on actual work durations rather than estimates, so they’ll “sandbag” the results to protect themselves—and finish “on schedule.”
So, what’s a project manager to do? First off, the project manager should strive to incorporate historical information and expert judgment on which to predicate accurate estimates. Second, the project manager should stress a genuine need for accurate duration estimates. Finally, the project manager can incorporate a reserve time.
A reserve time is a percentage of the project duration or a preset number of work periods, and it is usually added to the end of the project schedule or just before project milestones. Reserve time may also be added to individual activity durations based on risk or uncertainty in the activity duration. When activities are completed late, the additional time for the activity is subtracted from the reserve time. As the project moves forward, the reserve time can be reduced or eliminated as the project manager sees fit. Reserve time decisions should be documented.
Evaluating the Estimates
Estimating activities provides three outputs:
•Activity duration estimates Activity duration estimates reflect how long each activity will take to complete. Duration estimates should include an acknowledgment of the range of variance. For example, an activity whose duration is expected to be one week may have a range of variance of one week plus or minus three days. This means that the work can take up to eight days or as few as two days, assuming a five-day workweek.
•Basis of estimates Any supporting detail and approach you utilized during the creation of the duration estimates should be documented. This includes not just the basis of your estimates, but any constraints or assumptions used, range of possible variations attached to your estimates, and your confidence level for the final duration estimate.
•Project documents updates Activity attributes are updated with the duration estimates. The assumption log is updated to reflect any assumptions about the activities that may have been used to predict durations, such as resource availability. You might also need to update the lessons learned register with any effective methods you and your team have developed to improve duration predictions.
Predicting Duration in Agile Projects
Recall that agile projects use a fixed schedule and fixed budget. This means, for time, you’ve a deadline that’s already been determined, likely by the business analyst, the product owner, or the customer. A deadline is just fine in adaptive projects—it’s expected. Instead of all the upfront overhead of planning and analysis we see in predictive projects, the adaptive team gets to work creating value much quicker. The deadline simply means the team will create as much as it can from the most important items to the least important items in the project.
Well, customers may demand that all of the requirements need to be created by a given date, and that’s not always realistic. Agile projects utilize user story sizing using the story points that rate the story size from extra small to extra large or by relative sizing using the Fibonacci sequence. The development team can take on only so much work in a sprint—the selected amount of story points they can feasibly accomplish. The amount of story points a team actually accomplishes is the velocity, and the higher the velocity, the quicker the team can finish the product backlog.
So if the product backlog has 645 user story points total and the team’s velocity is 30 points per iteration, you can quickly calculate that it’ll take 22 sprints to complete everything in the product backlog. If each sprint is four weeks, which is the typical case, you’re looking at 88 weeks, not counting holidays and fluctuations in velocity. If the deadline is less than 88 weeks, either the lower prioritized items get lopped off from the product backlog, the deadline gets moved to a more realistic date, or the lower level items get shifted into a follow-up project.
 VIDEO For a more detailed explanation, watch the Agile Duration video now.
Developing the Project Schedule
The project manager, the project team, and possibly even the key stakeholders will examine the inputs previously described and apply the techniques discussed in this section to create a feasible schedule for the project. The point of the project schedule is to complete the project scope in the shortest possible time without incurring exceptional costs or risks or a loss of quality.
Creating the project schedule is part of the planning process group. It is calendar-based and relies on both the project network diagram and the accuracy of time estimates. When the project manager creates the project schedule, she’ll also reference the risk register. The identified risks and their associated responses can affect the sequence of the project work and when the project work can take place. In addition, if a risk comes to fruition, the risk event may affect the scheduling of the resources and the project completion date.
Applying Mathematical Analysis
Mathematical analysis is the process of factoring theoretical early and late start dates and theoretical early and late finish dates for each activity within the project network diagram (PND). The early and late dates are not the expected schedule, but rather a potential schedule based on the project constraints, the likelihood of success, the availability of resources, and other constraints.
The most common approach to calculating when a project may finish is by using the critical path method. It uses a “forward” and “backward” pass to reveal which activities are considered critical. Activities on the critical path may not be delayed; otherwise, the project end date will be delayed. The critical path is the path with the longest duration to completion. Activities not on the critical path have some float (also called slack) that allows some amount of delay without delaying the project end date.
EXAM TIP For the exam, remember that the critical path is used to determine which activities have no float. You can also use the critical path to determine the earliest date for when the project may be completed. There can be more than one critical path in a project, as two paths can have the same duration, and it’s possible for the critical path to change. You should also understand the concepts of forward and backward passes and be able to find the critical path and float in a simple network diagram.
Calculating Float in a PND
Float, or slack, is the amount of time an activity can be delayed without postponing the project’s completion. Technically, there are three different types of float:
•Free float This is the total time a single activity can be delayed without affecting the early start of any successor activities.
•Total float This is the total time an activity can be delayed without affecting project completion.
•Project float This is the total time the project can be delayed without passing the customer-expected completion date.
•Negative total float A constraint on an activity, such as the activity must start on a specific date, or a deadline for the project completion, can cause negative float. This means the activities on the critical path don’t have enough time to meet the defined finish date for the project or the constrained activity.
NOTE There are a couple of different approaches to calculating float. I’m sharing the approach that I learned and that I think is the best approach. You may have learned a different method that you prefer. You won’t hurt my feelings if you use your method to get the same result I get from my method.
Most project management software will automatically calculate float. On the PMP exam, however, candidates will be expected to calculate float manually. Don’t worry—it’s not too tough. The following describes the process.
You’ll examine the PND and find the critical path. The critical path is typically the path with the longest duration and will always have zero float. The critical path is technically found once you complete the forward and backward passes. You start with the forward pass. After the backward pass, you can identify the critical and near-critical paths, as well as the float.
VIDEO For a more detailed explanation, watch the Finding Float video now.
1.The early start (ES) and early finish (EF) dates are calculated by first completing the forward pass. The ES of the first task is 1. The EF for the first task is its ES, plus the task duration, minus 1. Don’t let the “minus 1 value” throw you. If Task A is scheduled to last three days, it would take only three days to complete the work, right? The ES is 1, the duration is 3, and the EF is 3, because the activity would finish within three days, not four days. The following illustration shows the start of the forward pass:
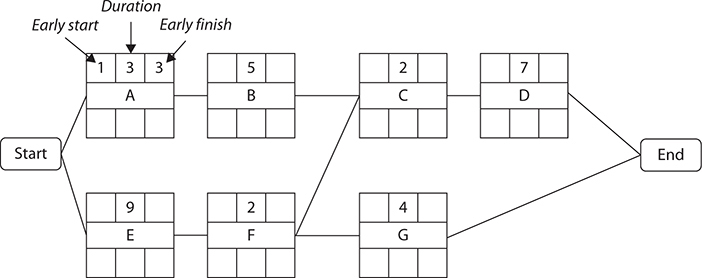
2.The ES of the next task(s) will be the EF for the previous activity, plus 1. In other words, if Task A finishes on day 3, Task B and Task C can begin on day 4.
3.The EF for the next task(s) equals its ES plus the task duration, minus 1. Sound familiar?
4.Now each task moves forward with the forward pass. Use caution when there are multiple predecessor activities; the EF with the largest value is carried forward. The following illustration shows the completed forward pass:

5.After the forward pass is completed, the backward pass starts at the end of the PND. The backward pass is concerned with the late finish (LF) and the late start (LS) of each activity. The LF for the last activity in the PND equals its EF value. The LS is calculated by subtracting the duration of the activity from its LF and then adding 1. The 1 is added to accommodate the full day’s work; it’s just the opposite of subtracting the one day in the forward pass. Here’s a tip: The last activity is on the critical path, so its LF will equal its EF.
6.The next predecessor activity’s LF equals the LS of the successor activity, minus 1. In other words, if Task D has an LS of 14, Task C will have an LF of 13. The following illustration shows the process of the backward pass:

7.The LS is again calculated by subtracting the task’s duration from the task’s LF and then adding 1. The following shows the completed backward pass:

8.To officially calculate float, the ES is subtracted from the LS, or the EF is subtracted from the LF. Recall the total float is the amount of time a task can be delayed without affecting the project completion date. The next illustration shows the completed PND with the float exposed.
 DIGITAL CONTENT I bet you’re wishing you could try this one out for yourself, right? The Adobe PDF document titled “Chapter Six Float Exercise” includes a project network diagram that you can print and use to test your float-ability. You can also just create your own diagrams and practice finding float.
Encountering Scheduling on the PMP Exam
Out here in the real world, where you and I work every day, we likely aren’t calculating float manually. On your PMI exam, however, you’ll need to be able to calculate float. Why? You’re proving that you understand the theory and application of managing project time. On your regular gig, you’ll use your project management software to do this magic for you. You’ll encounter float, scheduling, and critical path activities on the exam. You should count these questions as “gimmies” if you remember a few important rules:
•Always draw out the network diagram presented on your scratch paper. It may be used in several questions.
•Know how to calculate float. (The complete process was shown earlier in the “Calculating Float in a PND” section.)
•You may encounter questions that ask on what day of the week a project will end if no weekends or holidays are worked. No problem. Add up the critical path, divide by 5 (Monday through Friday), and then figure out on which day of the week the activity will end.
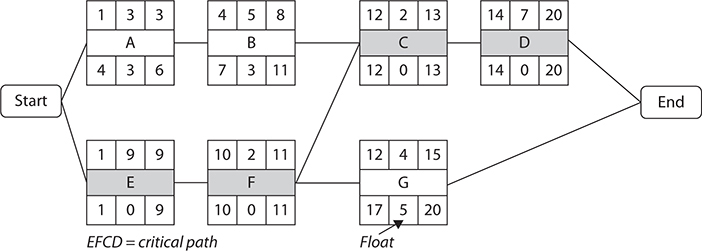
•You may see something like Figure 6-5 when it comes to scheduling. When three numbers are presented, think three-point estimate. Optimistic is the smallest number and pessimistic is the largest, so most likely, it’s somewhere between the two. When a number is positioned directly over the tasks, it is the task duration. When a number is positioned to the upper-right of a task, this represents the EF date.
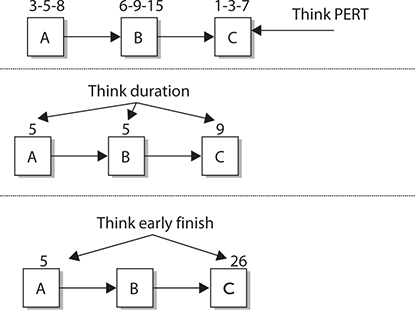
Figure 6-5 Scheduling follows many rules to arrive at a project completion date.
Applying Schedule Compression
Schedule compression is also a mathematical approach to scheduling. The trick with schedule compression, as its name implies, is calculating ways the project can get done sooner than expected. Consider a construction project slated to last eight months. Because of the expected cold and nasty weather typical of month seven, the project manager needs to rearrange activities, where possible, to end the project as soon as possible.
In some instances, the relationship between activities cannot be changed because of hard logic or external dependencies. The relationships are fixed and must remain as scheduled. Now consider the same construction company that is promised a bonus if they can complete the work by the end of month seven. Now there’s incentive to complete the work, but there’s also the fixed relationship between activities.
To apply duration compression, the performing organization can rely on two different methods. These methods can be used independently or together and are applied to activities or to the entire project based on need, risk, and cost:
•Crashing This approach adds more resources to activities on the critical path to complete the project earlier. In the crashing process, costs grow as resources are added. Crashing doesn’t always work. Consider activities that have a fixed duration and won’t finish faster with additional resources. The project manager must also consider the expenses in relation to the gains of completing on time. For example, a construction company may have been promised a bonus to complete the work by a preset date, but the cost incurred to hit the targeted date may be more than the bonus.
•Fast tracking This method changes the relationship of activities. With fast tracking, activities that would normally be done in sequence are done in parallel or with some overlap. Fast tracking can be accomplished by changing the relation of activities from FS (finish-to-start) to SS (start-to-start) or by adding lead time to downstream activities. For example, a construction company could change the relationship between painting the rooms and installing the carpet by adding lead time to the carpet installation task. Before the change, all the rooms had to be painted before the carpet installers could begin. With the added lead time, the carpet can be installed hours after a room is painted. Fast tracking can, however, increase risk and may cause rework in the project. Can’t you just imagine those workers getting fresh paint on the new carpet?
In an agile project, it may seem easy to add more labor to increase velocity. Well, hold on, professor. Yes, adding labor can increase velocity and reduce the overall duration of the project if, and this is a big if, the resources added can actually contribute. You need the right resources added to the development team. This means the resources have the needed skills, they aren’t going to get in the way of current work, and they can get up to speed quickly on what’s happening in the project. The truth is, when you add labor to, or crash, an agile project, your velocity may actually dip initially, because it’ll take some time for the new resources to overcome the learning curve. The new resources will need some coaching, they’ll need to get acclimated to the project work, and they’ll need to learn who’s who and where stuff is. Crashing in Agile isn’t as easy as adding painters to paint the wall.
EXAM TIP For the exam, it’s easy to remember the difference between these two actions. Crashing and cost both begin with C—we’re adding resources, and too many people will “crash” into each other. Fast tracking is about speeding things up. However, haste can be risky.
Using a Project Simulation
Project simulations enable a project manager to examine the feasibility of the project schedule under different conditions, variables, and events. You can play “what-if” scenarios with your project. For example, the project manager can imagine the circumstances if activities were delayed, if vendors missed shipment dates, or if external events affected the project.
Simulations are often completed by use of Monte Carlo analysis. Named for the world-famous gambling district of Monaco, Monte Carlo analysis predicts how scenarios may work out, given any number of variables. The process doesn’t actually churn out a specific answer, but a range of possible answers. When Monte Carlo is applied to a schedule, it can examine, for example, the optimistic completion date, the pessimistic completion date, and the most likely completion date for each activity in the project.
As you can imagine, in a typical network diagram, there are likely thousands, if not millions, of combinations of tasks that complete early, late, or as expected. Monte Carlo analysis shuffles these combinations, usually through computer software, and offers a range of possible end dates coupled with an expected probability for achieving each end date. In other words, Monte Carlo analysis is an odds-maker. The project manager chooses, or is at least influenced by, the end date with the highest odds of completion in ratio to the demands for completion by an expected time. The project manager can then predict with some certainty that, for example, the project has an 85 percent chance of completion by a specific date.
NOTE Monte Carlo analysis can be applied to more than just scheduling. It can also be applied to cost, project variables, and, most often, to risk analysis.
Simulations also provide time to factor in “what-if” questions, worst-case scenarios, and potential disasters. The end result of simulations is to create responses to the feasible situations. Then, should the situations come into play, the project team is ready with a planned response.
Using Resource-Leveling Heuristics
First off, a heuristic is a fancy way of saying “rule of thumb.” A resource-leveling heuristic is a method to flatten the schedule when resources are overallocated. Resource leveling can be applied using different methods to accomplish different goals. One of the most common methods is to ensure that workers are not overextended on activities.
Resource leveling usually limits the total amount of labor a resource can contribute in a given period. For example, you may have a constraint that limits your project team members to 25 hours per week on your project. If you’ve created a schedule that requires your project team members to work 40 hours per week on your project, then each team member is now overallocated on your project by 15 hours. So now you have to lop off 15 hours per week per resource, which increases the total duration of your project. There won’t be more hours of labor, but it’ll take longer on the calendar to do the same amount of work.
Another method for resource leveling is to take resources off noncritical path activities and apply them to critical path activities to ensure that the project end date is met. This method takes advantage of available slack and balances the expected duration of the noncritical path with the expected duration of the critical path. When you’re doing resource leveling on noncritical path activities, it’s also known as resource smoothing.
Finally, some resources may be scarce to the project. Consider a highly skilled technician or consultant who is available to contribute to the project on a particular date only. These resources are scheduled from the project end date, rather than from the start date. This is known as reverse resource-allocation scheduling.
Using Project Management Software
When it comes to project management software, take your pick: the market is full of choices. Project management applications are tools, not replacements, for the project management processes. Many of the software tools today automate the processes of scheduling, activity sequencing, work authorization, and other activities. The performing organization must weigh the cost of the PMIS (project management information system) against the benefits the project managers will actually see. In an agile environment, you’ll also complete release planning. This is where you’ll predict when the releases of the software or product of your project will be published. The release schedule will often be between three and six months, and this is decided early in the project.
Relying on a Project Coding Structure
The coding structure identifies the work packages within the WBS and is then applied to the PND. This enables the project manager, the project team, experts, and even key stakeholders to extract areas of the project to examine and evaluate. For example, a project to create a catalog for a parts distributor may follow multiple paths to completion. Each path to completion has its own “family” of numbers that relate to each activity on the path, as outlined in Table 6-2.

Table 6-2 Possible Paths in Creating a Catalog
Considering the Outputs of Schedule Development
After dealing with all the challenges of examining, sequencing, and calculating the project activities, you’ll create a working schedule. Schedule development, like most project management planning processes, moves through progressive elaboration. As the project moves forward, discoveries, risk events, or other conditions may require the project schedule to be adjusted. In this section, we’ll discuss the project schedule and how it is managed.
Reviewing the Schedule Baseline
Once the schedule model has been created and approved by the appropriate stakeholders, it becomes the schedule baseline. The baseline is what you believe will happen with the project’s timeline. Once the schedule baseline is agreed upon and approved, it cannot be changed without passing through integrated change control. The actual duration and completion of activities are tracked throughout the project and compared to the schedule baseline for any variances. The schedule is part of the overall project management plan.
Examining the Project Schedule
The project schedule includes, at a minimum, a date when the project begins and a date when the project is expected to end. The project schedule is considered “proposed” until the resources needed to complete the project work are ascertained. In addition to the schedule, the project manager should include all the supporting details. Project schedules can be presented in many different formats, including the following:
•Project network diagram (PND) This illustrates the flow of work, the relationships among activities, the critical path, and the expected project end date. PNDs, when used as the project schedule, should have dates associated with each project activity to show when the activity is expected to start and end.
•Bar charts These show the start and end dates for the project and the activity duration against a calendar. They are easy to read. Scheduling bar charts are also called Gantt charts.
•Milestone charts These plot the high-level deliverables and external interfaces, such as a customer walkthrough, against a calendar. Milestone charts are similar to Gantt charts, but with less detail regarding individual activities. The following is an example of a milestone chart:
Utilizing the Schedule Management Plan
The schedule management plan is a subsidiary plan of the overall project plan. It is used to control changes to the schedule. A formal schedule management plan has procedures that control how changes to the project plan can be proposed, accounted for, and then implemented. An informal schedule management plan may consider changes on an instance-by-instance basis. A change request is needed to update the schedule baseline, the schedule management plan, or any component of the project management plan.
I know we’ve not really talked about costs just yet—that’s in the next chapter—but it’s directly tied to scheduling in project management. You must consider several elements of the project’s cost management plan when it comes to project scheduling. First, like the schedule baseline, you’ll be creating a cost baseline. The cost baseline will reflect how much the project will cost, but also the cumulative totals of the costs as the project moves forward. You might also, depending on project duration, have to predict when capital expenses will occur for cash-flow planning for your organization. Things like expensive pieces of equipment, procurement planning, and vendor payments are all tied to scheduling. For now, know that the cost baseline, the cost management plan, and project scheduling are all related.
Updating the Resource Requirements
As a result of resource leveling, more resources may need to be added to the project. For example, a proposed leveling may extend the project beyond an acceptable completion date. To reach the project end date, the project manager elects to add resources to the critical path activities. The resources added by the project manager should be documented, the associated costs accounted for, and everything approved.
Controlling the Project Schedule
Schedule control is part of integrated change management, as discussed in Chapter 4. Throughout a typical project, events may require updates to the project schedule. Schedule control is concerned with three primary actions:
•The project manager works with the factors that can cause changes in the schedule in an effort to confirm that the changes are agreed upon. Factors can include project team members, stakeholders, management, customers, and project conditions.
•The project manager examines the work results and conditions to determine whether the schedule has changed.
•The project manager manages the actual change in the schedule.
Managing the Inputs to Schedule Control
Schedule control, the process of managing changes to the project schedule, is based on several inputs:
•Project management plan, specifically the schedule management plan, schedule baseline, scope baseline, and the performance measurement baseline
•Project documents, specifically the lessons learned register, project calendars, project schedule, resource calendars, and schedule data
•Work performance data
•Organizational process assets
Applying Schedule Control
Schedule control is a formal approach to managing changes to the project schedule. It considers the conditions, reasons, requests, costs, and risks of making changes. It includes methods of tracking changes, approval levels based on thresholds, and the documentation of approved or declined changes. The schedule change control activities are part of integrated change management.
Measuring Project Performance
Poor performance may result in schedule changes. Consider a project team that is completing its work on time, but all of the work results are unacceptable. The project team may be rushing through their assignments to meet their deadlines. To compensate for this, the project may be changed to allow for additional quality inspections and more time for activity completion. Project performance is often based on earned value management, which we’ll discuss in Chapter 7.
Examining the Schedule Variance
The project manager must actively monitor the variances between when activities are scheduled to end and when they actually end. An accumulation of differences between scheduled and actual dates may result in a schedule variance.
The project manager must also pay attention to the completion of activities on paths with float, not just the critical path. Consider a project that has eight different paths to completion. The project manager should first identify the critical path, but she should also identify the float on each path. The paths should be arranged and monitored in a hierarchy from the path with the smallest float to the path with the largest float. As activities are completed, the float of each path should be monitored to identify any paths that may be slipping from the scheduled end dates.
Creating Burndown and Burnup Chart
Though burndown charts are typically used in agile projects, you can use them to illustrate the amount of work left to do in the project or iteration. Burndown charts, such as the one shown in Figure 6-6, start in the upper left corner and predict the amount of remaining work distributed over the timeline. As work is completed, a second line representing the actual work is added to the chart to show any variances between what is happening and what is predicted. Based on current completion of tasks, you can add a third line to represent a trend and offer a new prediction for the project completion date.

Figure 6-6 Burndown and burnup charts show the balance of activities, the predicted completion of activities, and the forecast for when activities are likely to be finished.
A burnup chart is the same idea as a burndown chart in reverse. Rather than showing the downward trend of what’s been accomplished, a burnup chart shows the accumulation of story points against the total amount of work to do. It trends upward toward the total amount of work left to do and shows what the team has accomplished. Figure 6-6 shows a burnup chart too.
Updating the Project Schedule
So, what happens when a schedule change occurs? The project manager must ensure that the project schedule is updated to reflect the change, document the change, and follow the guidelines within the schedule management plan and integrated change control. Any formal processes, such as notifying stakeholders or management, should be followed.
Revisions are a special type of project schedule change that cause the project start date and, more likely, the project end date to be changed. They typically stem from project scope changes. Because of the additional work the new scope requires, additional time is needed to complete the project.
Schedule delays, for whatever reason, may be so drastic that the entire project has to be rebaselined—that is, all the historical information up to the point of the rebaseline is eliminated. Rebaselining is a worst-case scenario and should be used only when adjusting for drastic, long delays. Schedule revision is the preferred, and most common, approach to changing the project end date.
 TIP You should rebaseline only in extreme, drastic scenarios; however, a change request can justify rebaselining the project if additional scope items require additional time for the project.
Applying Corrective Action
Corrective action is any method applied to bring the project schedule back into alignment with the original dates and goals for the project end date. Corrective actions are efforts to ensure that future performance meets the expected performance levels. It includes the following:
•Ensuring that the work packages are complete as scheduled; completing a work package early isn’t always a good thing
•Extraordinary measures to ensure that work packages complete with as little delay as possible
•Root-cause analysis of schedule variances
•Measures to recover from schedule delays
Chapter Summary
All projects take time—time to plan the project, do the work, control the work, and confirm that the work has been done according to plan. Of course, there are many other things that eat into a project’s schedule: change request reviews, corrective and preventive actions, defect repair, defect repair review, and scope verification. When a project manager first looks at planning the project work, she and her project team will consider all the activities that will need to be completed based on the project WBS.
Once all the project work has been identified and the activity list has been generated, it’s time to put the activities into the order necessary to reach the project completion. This means the activity attributes are considered. Activities that must happen in a particular order use hard logic, whereas activities that don’t have to happen sequentially can use soft logic. The sequencing of the project activities happens with the project management team.
Putting the activities in the order in which they’ll happen leads to the creation of a project network diagram. It’s pretty. The PND most likely will be using the precedence diagramming method—that’s where you can clearly identify the predecessors and successors within the project. The relationships between the activities signal the conditions that must be true to allow the work to progress.
Adaptive projects work with a predefined end date. The velocity of the development team against the amount of user story points in the product backlog determine how quickly the project can reach business value. The better the velocity, which will normalize over time, the faster the team can create the items in the product backlog. Kanban boards are useful to show what’s in the project queue and help the team control the work in progress. Because agile projects work from the most important items in the product backlog to the least important items, it’s often okay if the team can’t realistically get everything done. I say “often” because stakeholders may demand that everything be done, and that will mean more time, more money, and more realistic expectations.
Once the work has been organized and visualized, it’s time to staff it. This is project resource estimating, which also contributes to the cost of the project. Resource utilization considers not only the people that your project will need, but also the materials and equipment. This activity considers the quantity of resources the project demands and when the resources are available. This is a tricky business in large projects, so rolling wave planning may be incorporated into the project.
Of course, management and the project stakeholders will want to know how long the project work will take to complete. After the network diagram has been created and the resources have been identified, the project management team can more accurately estimate the project duration. The project manager can use the identified labor, which is commonly done, or the project manager can rely on analogous estimating, which isn’t as accurate as bottom-up estimating. In some instances, the project manager can also use parametric estimating to predict the project duration.
As the project manager examines the network diagram, he’ll want to find opportunities to shift resources and determine where delays will affect the project end date. Of course, I’m talking about the critical path—the path with no float and with activities that cannot, better not, be delayed, or the project end date will go beyond what’s been scheduled. Activities not on the critical path have float and can often be delayed if needed. You’ll see a few questions on float on the exam, and I encourage you to watch the video referenced in this chapter to nail down the float process.
A project manager must control the project schedule. Sometimes this means compressing the project schedule. Recall that crashing adds resources to the project work, but crashing adds cost. The project manager can crash the project work only if the activities are effort-driven. Activities that are of fixed duration, such as printing a million booklets on a particular printing press, won’t get done faster just because the project manager adds labor to the activities. The printing press can print only so many booklets per hour. Other activities can benefit from fast tracking; this approach enables phases to overlap but increases the project risk.
Questions
1.You are the project manager of the HGF Project. You would like to use a portion of the activity list from the HGB Project, which is similar to your current project. The portion of the activity list from the HGB Project is best described as which one of the following?
A.Rolling wave planning
B.Analogous estimating
C.A template
D.Expert judgment
2.You are the project manager of a large project for your organization. Much of the project will center on new software that you’ll be installing on 4,500 laptops in stages. Because of the likelihood of change, you’ve recommended a rolling wave planning approach. Which one of the following is the best example of rolling wave planning?
A.Using expert judgment for the current project
B.Using a portion of the activity list from a previous project
C.Breaking down the project scope
D.Planning the immediate portions of the project in detail and the future project portions at a higher level
3.You are the project manager for your organization and you’re serving as a scrum master in the project. You would like to create a chart that shows the balance of user story points in the product backlog against the number of iterations and velocity of the development team. What chart should you create?
A.Pareto chart
B.Burndown chart
C.Kanban board
D.Velocity tracking chart
4.You and the project team have created the work breakdown structure based on the project scope and requirements. Your next step is to create the project’s activity list. Which one of the following will not be included in the activity list created with the project management team?
A.Activities that are not part of the project scope
B.Quality control activities
C.Activities to create the work packages
D.Physical terms, such as linear feet of pipe to be installed
5.Mary has created an activity list with her project team. She has included activity attributes for each of the activities in her project activity list. Of the following, which one is not an example of an activity attribute that Mary likely included?
A.Scope validation
B.Predecessor activities
C.Leads and lags
D.Geographic area where the work must take place
6.Why do adaptive projects create value much faster than predictive projects do?
A.Because the development team gets into execution faster than predictive teams.
B.Because the development teams have less administrative overhead than predictive teams.
C.Because adaptive projects are generally used for projects with smaller scope.
D.Because adaptive projects have no schedule and don’t plan like predictive projects do.
7.You are working with your project team to schedule activities for your construction project. You have scheduled the painting activity to be completed before the carpet installation activity may begin. The relationship between the painting activity and carpet installation activity can best be described as which one of the following?
A.Lag
B.Lead
C.Finish-to-start
D.Start-to-finish
8.You are the project manager for your organization, and the following illustration represents your project. Based on the following illustration, how long will the project last?

A.15 days
B.12 days
C.14 days
D.41 days
9.Beth is the project manager of her company and she’s asked you to help her with project schedule network analysis. Examine the following illustration. If Activity B is delayed by two days, how late will the project be?

A.The project will not be late because Activity B may use float.
B.The project will be late by one day.
C.The project will be late by two days.
D.The project will be late by four days.
10.Ronald is the project manager for his company. He has created a project network diagram for the activities in the activity list and he’s trying now to begin the process of float determination. He’s asked for your help. Examine the following illustration. Which path is the critical path?

A.ABFGJL
B.ACFGJL
C.ADEHJL
D.ADIKL
11.Consider a project that has 420 user story points left in the product backlog. The team’s velocity is 30. If each sprint of the Scrum project lasts four weeks, how much longer will this project likely last?
A.14 weeks
B.56 weeks
C.49 weeks
D.It’s impossible to predict as agile projects change frequently
12.Mike, a project manager in your company, is falling behind on the project schedule. He has elected to crash the project. What is crashing?
A.Adding lag time between all project activities
B.Adding lead time between all project activities
C.Adding additional project resources to the project work
D.Removing all unneeded project deliverables
13.You are the project manager of the PJG Project for your company. This project is similar to a project you completed a few months ago, and you’d like to reference the older project for information. Which estimating technique uses a similar project to predict how long the current project will take to complete?
A.Analogous estimating
B.Parametric estimating
C.Organizational process assets
D.Bottom-up estimating
14.You are using a triangular estimate for your project. Howard reports that his optimistic estimate is 16 hours, his most likely estimate is 24 hours, and the pessimistic estimate is 65 hours. What is the estimated duration for Howard’s activity?
A.Unknown until Howard actually does the work
B.105 hours
C.24 hours
D.35 hours
15.The framing activity cannot begin until the concrete has cured for 36 hours. The time between the concrete activity and the framing activity is best described as which one of the following?
A.Hard logic
B.Lag time
C.Lead time
D.Finish-to-start relationship
16.You are the project manager of the Data Warehouse Project. You’ve just recently created the project network diagram and you now want to identify the critical path. Which one of the following best describes the critical path?
A.It is always one path with no float.
B.It determines the earliest the project can finish.
C.It has the most activities.
D.It has the most important project activities.
17.Management has asked that you create the schedule management plan to identify the different processes and procedures your project will require. During the creation of the plan, you need to identify schedule change control and its components. Schedule change control is part of which project management process?
A.Change control
B.Cost control
C.WBS refinements
D.Integrated change control
18.Terry is the project manager of the network update project, and the project stakeholders have requested that four new servers be added to the project. This addition will cause changes in the project costs and schedule. Which process can manage changes to the project schedule?
A.Change control system
B.Schedule change control system
C.Integrated change control
D.Change control board
19.Which schedule development tool does not consider the availability of the project resources but instead considers when the work may take place in the project?
A.The critical path method
B.The critical chain method
C.Schedule compression
D.Arrow on the node method
20.You are working with your project team to respond to some delays in the project schedule. You have elected to crash the project schedule, and management wants to know what effect this will have on the project as a whole. What happens when a project manager elects to crash a project?
A.The project will end early.
B.The project will end on time.
C.The project costs will increase.
D.The project team morale will decrease.
Answers
1.C. This is an example of using the previous project as a template. A is incorrect because rolling wave planning describes the detailed planning of the imminent project work, and the high-level planning of work that is further away in the project schedule. B is incorrect because analogous estimating describes the method of using a similar project to create the current project’s time and/or cost estimate. D is incorrect because expert judgment is using an expert to provide needed information for the current project.
2.D. Rolling wave planning is the planning of the immediate portions of the project in detail and the future work at a higher level. A is incorrect because expert judgment is using an expert to help the project manager make informed decisions within the project. B is incorrect because it describes using a template for the current project. C is incorrect because it describes the process of creating the WBS by breaking down the project scope.
3.B. You should create a burndown chart. A burndown chart shows the number of user story points in the product backlog and shows how many iterations the development team has completed. In each iteration, you’ll track the velocity of the team against the planned velocity to show any variances. Over time, you’ll see a downward trend signifying the diminishment of total user stories left in the product backlog. A is incorrect because a Pareto chart shows categories of failure from greatest to smallest. C is incorrect because a Kanban board shows the work in queue and the status of the work as it moves through the project phases until completion. D is incorrect because there is no such thing as a velocity tracking chart.
4.A. The activity list must not include any activities that are not part of the project scope. B, C, and D are incorrect because these activities and terms are included in the activity list.
5.A. Scope validation leads to acceptance decisions with the project customer, but it is not part of the activity attributes. B, C, and D are incorrect because they are all part of the activity attributes that Mary may include.
6.A. Adaptive projects do create value faster than predictive projects do because there is less upfront planning and overhead in an adaptive project. This enables the development team to get directly into execution on the most important items in the project scope based on the product backlog. B is incorrect because, although it may be true that adaptive teams have less administrative overhead than predictive projects, the best answer is that the development team can get right to work on the project scope. C is incorrect because adaptive projects do not have to be used for smaller scope projects. Adaptive projects can be large or small. D is incorrect because adaptive projects do follow a schedule, just not the same type of schedule as predictive projects follow. In addition, adaptive projects do complete planning, but they don’t follow the same approach used in predictive projects.
7.C. The painting activity must finish first, and then the carpet installation activity can begin. A, lag, is incorrect because this describes the waiting time between project activities. B, lead, is incorrect because this describes a schedule compression technique to move project activities closer together. D, start-to-finish, is a relationship between activities, typically used in just-in-time scheduling, but that is not what is described in this example.
8.A. The project will last 15 days. The path ACFG is the critical path that will take 15 days to complete. B and C are incorrect because they are both representative of paths that are less than the critical path. D, 41 days, is incorrect because it is the sum of the number of days of labor if you added the duration of each project activity in the project. The total of 41 days, however, is not an accurate calculation of the total number of days to complete the project based on the critical path.
9.B. If Activity B is delayed by two days, the total duration of the project changes to 16 total days—one more day than the critical path will allow. A, C, and D are incorrect calculations for this project. For more information, see the PMBOK Guide, Section 6.5.2.2.
10.C. ADEHJL is the critical path because this one takes the longest to complete. A, B, and D are incorrect because these are examples of paths that have float, not the critical path.
11.B. The project will last 56 weeks. This is determined by taking the total number of user stories remaining in the product backlog, which is 420, and dividing by the velocity, which is 30. This number is the number of remaining sprints in the project, which is 14. If each sprint lasts four weeks, the project will last 56 weeks. A is incorrect because 14 represents the number of sprints remaining in the Scrum project. C is incorrect because this is not a valid calculation. D is incorrect because agile projects do change frequently, but based on current conditions, 56 weeks is the likely duration.
12.C. Crashing is when a project manager elects to add resources to the project work in an attempt to compress the project schedule. Crashing adds costs to the project. A is incorrect because adding lag time would cause the project duration to increase. B, adding lead time, is an example of fast tracking. D is not a valid choice.
13.A. Analogous estimating uses an analogy between similar projects to determine the current project’s duration. B, parametric estimating, uses a parameter—such as 10 hours per unit installed—to predict the project duration. C is not a valid answer. D, bottom-up estimating, accounts for every work package in the WBS and the total amount of time for each deliverable. It is the most reliable time-estimating technique, but also takes the longest to create.
14.D. A triangular, or three-point, estimate takes the sum of the optimistic, pessimistic, and most likely estimates and divides it by 3: (16 + 24 + 65)/3 = 35. A, B, and C are incorrect answers for this three-point estimate.
15.B. The framing activity cannot begin immediately after the concrete activity; there is waiting time, which is commonly known as lag time. A, hard logic, describes the order in which activities must happen; it does not describe the time between activities. C, lead time, is incorrect because it would actually allow activities to overlap. D, finish-to-start, is incorrect because, although it does describe the relationship between the concrete and the framing activities, it does not answer the question.
16.B. The critical path reveals the earliest that a project may finish. This question tricks many project managers as they often think the critical path shows only the latest a project may finish. Remember that the forward pass shows the early finish and the late finish for a project. A is incorrect because the project may have more than one critical path if two or more paths have the same duration, so it’s not always just one path. C is incorrect because the critical path may have fewer activities than other paths in the project, but may still take longer to complete. D is incorrect because the critical path does not reflect the importance of the path’s activities, just their duration.
17.D. Schedule change control is part of the integrated change control process. A, B, and C are incorrect because they do not completely answer the question.
18.C. In the integrated change control process, all changes from any area of the project must flow through integrated change control. A, the change control system, isn’t a valid system in a project. B, the schedule change control system, is also not a valid component of project management. D, the change control board, may be utilized, but it is not a process, so this choice is incorrect.
19.A. The critical path method considers only when the work may take place and not the availability of the resources. B, the critical chain method, is incorrect because it does consider when the resources are available. C and D are not valid choices for this question.
20.C. Crashing adds cost to the project because it adds labor, and labor costs money. A and B are incorrect because crashing a project does not necessarily ensure that the project will end early or on time. D is incorrect because there’s not enough information in the question to determine whether the team morale will decrease if the project manager elects to crash the project.