
CHAPTER 14
AI Won't Save Us (Unless We Save It First)
“Fairness is a statistical concept.”
—Heather Krause, Founder of We All Count
“Algorithms are human agency and interests, encoded.”
—University of Sussex Researcher Tony Roberts
In 2015, T.J. Fitzpatrick was attending a science fiction convention at an Atlanta Marriott. In the convention center restroom, when he went to wash his hands, nothing came out of the soap dispenser. He assumed it was empty. T.J. went to the next one, and the next, until he had held his hands under all 10 soap dispensers. Then his friend Larry came in, and T.J. decided to wait for him. When Larry went to wash his hands, the soap worked on the first try.
T.J. tried again—still no success. For Larry, it worked every time.
T.J. was Black, and Larry was white.
They laughed about it, recorded a quick split-screen take of their experiences, and shared the videos out to social media. It may have been the first time a soap dispenser went viral. Suddenly it was clear that this was a trend outside of the Atlanta Marriot. “Oh my God, I thought it was just me,” commented a Black woman. Thousands of similar comments rolled in from people of color who had experienced the mysterious case of the “racist soap dispenser” in other places.
Touchless dispensers use near-infrared technology that emits light from an LED bulb, which a person's hands then reflect to a triggering sensor. Because darker skin absorbs more light than lighter skin, in many of these dispensers, too little light is reflected to trigger the sensor.
The dispensers rely on artificial intelligence. Like many other “smart” devices in our lives, though, the algorithms behind them are not DEI-intelligent.
The more reliant we become on AI, the more frequently we see inanimate objects behave with prejudice. Google's PR department spent years apologizing for a photo-labeling system that misidentified Black people as gorillas. Nikon's “smart” digital cameras got poor reviews for repeatedly flashing “Did someone blink?” messages when photographing Asian people. Voice recognition software, trained by men, is more consistently accurate in understanding male voices than female voices. Object-detection software has failed to recognize dark-skinned individuals in virtual reality games, and more dangerously, in the models designed to prevent self-driving cars from hitting pedestrians.
These mishaps provide compelling arguments for diverse product development teams. If Nikon had tested its camera on Asian audiences, if women were involved in training voice recognition software, if Black employees were in the room as UX specialists, these biased designs could have been avoided.
Unfortunately, biased algorithms can also block the same people who could make AI more inclusive from getting in the door.
Bias for—and in—Action
Amazon has core “Leadership Principles” that are relentlessly emphasized internally and externally. One of these core principles is a “Bias for Action.” They define it as follows:
Speed matters in business. Many decisions and actions are reversible and do not need extensive study. We value calculated risk taking.1
In 2014, Amazon's machine learning team decided to take one of these calculated risks by automating parts of their recruiting and hiring processes.
It was an opportunity that seemed prime for machine learning assistance. Recruiters and HR professionals usually had to spend weeks sorting through resumes to determine which applicants met even the minimum requirements for a role. Machine sorting could save time and potentially make the selection process fairer. After all, machines aren't wooed by applicants with charismatic cover letters or glowing recommendations.
The team leaned into their Bias for Action principles and instituted a machine-learning-based recruiting system. It was structured similarly to Amazon's shopping frameworks—the system “scored” applicants from 1 to 5 stars, just as consumers could score products they had purchased.
A year in, the machine learning team realized they had a problem.2
The system was downgrading resumes that included the word “women” or otherwise indicated that the applicant was a woman. Resumes that were submitted by graduates of women's colleges, for example, or that included the term “women's chess club” were rated less favorably, compared to resumes of similar caliber that were clearly submitted by men.
This biased sorting was a result of the ways that machines “learn” in the algorithm development process. To learn how to hire, for example, Amazon's machines were fed 10 years of hiring history, which informed algorithms that would determine whom to accept or reject. Hundreds of thousands of resumes marked “accepted” or “rejected” were scanned, interpreted, and sorted into a framework for what “hirable” looked like. Because Amazon had disproportionately hired men, especially for technical roles, men were coded as hirable. Even the language men used in their resumes was considered more desirable; applicants who used more male-coded language were scored higher compared to applicants who listed similar accomplishments but used female-coded language.
Despite the risks posed by AI-driven hiring tools, 56 percent of managers plan to embrace AI-based hiring practices by 2022.3 Today 72 percent of resumes are rejected without ever being seen by a human eye.4
But when it comes to employment, employers aren't limiting their use of AI to hiring.
Algorithmic Attrition
In Weapons of Math Destruction, Cathy O'Neil shares examples of several data tools, algorithms, and platforms that companies use to triage their retention efforts. Which employees are worth putting energy into keeping? Several startups, including one named Gild, are devoted to helping employers answer this question. But instead of rating employees' retention worthiness by evaluating their skills or accomplishments, Gild evaluates their social capital. How much “clout” do employees have? What would be the social cost of losing certain individuals?
O'Neil explains Gild's method by giving us a fictional software developer, Pedro, who lives in Sao Paulo. Every night after getting home from work, Pedro has dinner and then quickly jumps online, spending hours communing with fellow coders by gaming or solving coding problems on sites like GitHub. Even though Pedro doesn't know it, Gild's model will “reward” his level of engagement with others, especially with those who have large online coding networks. If Pedro's online contacts are influencers with hundreds of thousands of followers, his “social capital” score skyrockets.
These connections don't always find each other by working together on coding problems, though. For example, many of them also frequent Japanese manga websites—male-dominated online comic book communities that oversexualize women in their comics and cartoons. Gild's algorithm doesn't discriminate, though. If high-profile coders are connecting en masse, and Pedro is there, Pedro's score goes up.
As you might imagine, most female coders don't dwell on manga sites. They also have reason to avoid massive online coding communities like GitHub. As detailed in chapter 3, their work is not treated the same as male-generated code on these open-source platforms. In 2015, the harassment campaign known as Gamergate targeted women in the video gaming industry, subjecting them to relentless harassment, threats, and stalking, in some cases so severe that they had to leave their homes.5
Female coders may hone their skills outside online communities, or in safer female coding and gaming groups, which don't rank as highly in social capital indexes. Do they not deserve for employers to invest in their retention?
The Half-Life of Encoded Bias
As our society becomes increasingly dependent on AI, a pernicious assumption is spreading that software will allow us to escape the influence of bias. It's easy to believe that math will cut through messiness, that depending on “objective” algorithms will free us from prejudice. The mathematical models that underpin AI and machine learning, however, hold immense power, and commensurate risk.
In an interview on the Racism at Work podcast, Harry Gaskell, Chief Innovation Officer at Ernst & Young UK and chair of the Employers Network for Equality & Inclusion, discusses the social consequences of encoded bias. Despite spending most of his life working with statistical models, Gaskell himself is astounded by their staying power. Reflecting on algorithms he played a role in creating, he calls for urgency in reigning in algorithmic bias:
There's nothing in AI that we can't control if we choose to control it, but we need to get there quickly. I started coding things nearly 35 years ago now and some of those systems, that me and my colleagues built 35 years ago, we thought they would probably have a 5- or 10-year shelf life, that we'd write them and that they would be replaced by other things pretty quickly. Actually some of them are still in use today, it embarrasses me to say. Particularly in industries that have been around for a while, like banking, they're still using code that is 20, 30, 40, 50 years old.
My worry is that if we're not careful we might start building AI which is around for decades that was never built using…ethics, social responsibility, accountability, reliability…If we build stuff not using those principles and those things also have lives of decades, I really worry that we're going to bake bias into systems that'll be very difficult to get out. The sooner we get our act together…the sooner we eliminate bias from systems, the better it's going to be.6
While his message is intended as a warning, the first part of Gaskell's statement gives me hope:
There's nothing in AI that we can't control if we choose to control it…
The potential that AI holds to build a fairer society does not have to be a false hope. It is already creating positive outcomes for many. AI that was originally created to sort boutique baked goods has been reengineered to recognize cancer cells, increasing the odds of early detection and survival.7 NASA machine learning lead engineer Anirudh Koul and I shared the Seattle TEDx stage in 2018. Anirudh showed numerous examples of ways that AI could contribute to a more equitable society. Koul had drawn on his experience building hands-free dictation features in Microsoft Office for those with motor impairments to create Seeing AI, an app that helps blind and low-vision communities navigate spaces using their smartphones.
If we make the right choices, AI could help us build more equity-centered workplaces as well. As Gaskell notes, however, it won't just happen. We have to code fairness in, starting now.
The Fairness Standards
Amazon has a final core principle in its list: “Success and Scale Bring Broad Responsibility.”
AI adoption is accelerating and will likely continue to do so.8 Meanwhile, we have little to no regulation of how employers can or should use it. There are no US standards for due diligence, transparency, or accountability. In this new AI Wild West, companies like Amazon will have to uphold their “Broad Responsibility” by implementing—and adhering to—standards of algorithmic fairness.
The idea of standards is nothing new to developers and statisticians. For example, Gaskell points out in his podcast interview that IBM has coding standards for naming, platform portability, and safe function-calling practices.9 To ensure that automated intelligence is inclusive and equations are equitable, developers should answer questions that would determine whether their code meets standards of fairness.
Before exploring some of the questions that could test mathematical models for fairness, I want to acknowledge that I am not a developer or a professional statistician. I have heavily leaned on the work of data scientists, ethicists, and thought leaders such as Cathy O'Neil, Heather Krause, and Tony Roberts for the frameworks that follow. I highly recommend exploring their work for a deeper understanding of these concepts.
Who (or What) Is Missing?
The absence of a group can matter more than its presence. Data and Society fellow and NYU faculty member Mimi Onuoha captured this idea in a combined data project and mixed-media installation titled The Library of Missing Datasets. In collaboration with others, Onuoha created a physical repository—mainly old metal filing cabinets—of data sets that do not exist yet, but should. In her words:
Missing data sets are my term for the blank spots that exist in spaces that are otherwise data-saturated. My interest in them stems from the observation that within many spaces where large amounts of data are collected, there are often empty spaces where no data live. Unsurprisingly, this lack of data typically correlates with issues affecting those who are most vulnerable in that context.10
Onuoha and her team have posted lists of some of these missing data sets on GitHub, inviting crowdsourced creation of data repositories that would cross the data sets off the “missing” list. Examples include the following:
- Number of Americans without bank accounts.
- Employment/unemployment numbers that include the incarcerated.
- Demographics of bitcoin buyers.
- Royalties that Spotify pays each of its artists per play per song.
Workplaces have missing data sets as well, and if people are not accounted for when a mathematical model is created, they will not be included when the model is implemented. For example, homogeneous companies that are trying to diversify may lack data about the very people they want to hire and retain. Employers can also be missing data around their processes, or the behaviors of applicants, that could optimize their algorithms for fairness.
If Onuoha listed these kinds of missing data sets for employers, they could include the following:
- Words different genders use to describe the same jobs.
- Demographic breakdown of resume reviewers over the last 10 years.
- Which interview questions have been asked to which demographics of applicants.
- The interviewer/interviewee demographic pairing of candidates who have been hired.
The categories that an algorithm allows for can also allow certain demographics to go statistically missing. Individuals who have transitioned from one gender to another, for example, have lost years of medical records because methods for tracking transgender individuals were never built into medical record-keeping systems. Similar problems follow transgender and nonbinary employees and applicants. If your hiring algorithm codes for binary gender options only, nonbinary applicants' resumes may never reach you. Employees who transition during their tenure with an organization can risk losing data that was previously linked to their employee profile by a certain gender.
As Mimi Onuoha notes, data sets are not the results of our realties: “Datasets are the results of their means of collection.” Which leads to the next question—who is behind the means of collection?
Who Is Creating the Model?
This question is important for two reasons. The first, and more obvious, is that diverse teams are more likely to provide diverse insights, which decreases the odds of designing racist soap dispensers and sexist voice recognition software.
The second reason is less obvious, but psychology professionals have given it a name: the “interviewer effect.”11 Several studies have shown that participants in research studies alter their opinions or their perceptions depending on the demographic of the person interviewing them.
I mentioned data ethicist Heather Krause earlier in this chapter. Krause is the chief data scientist at Datassist, and the founder of We All Count, a project dedicated to equity in data science.12 In experiments conducted by the We All Count team, researchers compared how subjects responded to questions about whether they approved or disapproved of men hitting their wives. They compared the following pairs of interviewers and interviewees:
- Male respondent, male enumerator, both urban.
- Male respondent, male enumerator, both rural.
- Female respondent, female enumerator, both urban.
- Female respondent, female enumerator, both rural.
- Male respondent, female enumerator, both urban.
- Male respondent, female enumerator, both rural.
- Female respondent, male enumerator, both urban.
- Female respondent, male enumerator, both rural.
They found that respondents in the second variation (male respondent, male enumerator, both rural) were the most likely to state that this kind of violence against women was okay. Respondents in the third variation (female respondent, female enumerator, both urban) were least likely to say it was okay. Women speaking to women enumerators were 7 to 12 percent more likely to reject violence against women than women speaking to male enumerators.13
The interviewer effect encourages participants to take social norms into account when responding to an interviewer, and it could influence testing how people interact with automation.14 For example, if an interviewer asks a diverse range of individuals about their experience with a hiring platform, women might be less likely to criticize the experience to a male interviewer, or a person of color might be less likely to give negative feedback to a white evaluator.
To avoid building a model based on feedback tainted by the interviewer effect, try to match interviewers' demographics to those of your participants. If your testing has already been conducted, note the demographic pairings of the interviewers and interviewees who interacted. As I explain later in this chapter in “Debiasing Your Data,” you can use this information to employ several different statistical solutions that account for the interviewer effect in your population, and compensate for it in your algorithm.
Are You Evaluating Impact Through an Equity Lens?
To determine whether a model is fair, you have to test it. Even if you test it with diverse audiences, though, that does not guarantee you are evaluating through an equity lens. Krause gives us two examples of how our embedded worldview can give us different mathematical evaluations of the same event.

FIGURE 14.1 Adopted from We All Count
Example 1: Whose average is it, anyway?
Let's pretend you are evaluating the impact of class size on student learning. You are presented with the three classrooms shown in figure 14.1.15 The first classroom has one student in it, the second has three students in it, and the third has five students.
What is the average class size in this school?
Most readers would say “three.” And they would be correct.
The average class size is also four. It depends on whom you ask.
If you ask the teachers, one says “one,” the second says “three,” the third says “five.” Add that up, divide by three, and your average is three. But whose experience are we actually evaluating? How does the math change if we ask the students?
In the first classroom, the one student says “one”; in the second classroom, there are three students who all say “three”; and in the third classroom, five students all say “five.” Adding all of these responses totals 35. Divide by nine, and your student-perceived average is almost four.
Even basic math that we learn by fourth grade has an embedded worldview. We are more inclined to solve for the average from the teacher's point of view because we put the locus of power on authority figures.
Similarly, when testing the impact of hiring or retention models on employees, ask yourself from whose point of view you are mathematically assessing impact—the employee? The manager? Co-workers? Who is affected, and therefore should be the locus of evaluative power?
Example 2: Beware the randomized control trial trap.
Randomized control trials (RCTs) are often hailed as the gold standard of research methods. Heather Krause disagrees, at least contextually. “Randomized control trials are the very best…randomized control trials,” she states in several presentations. RCTs are the gold standard of finding one specific answer: the estimate of the average effect of an action, policy, or other intervention on a population.
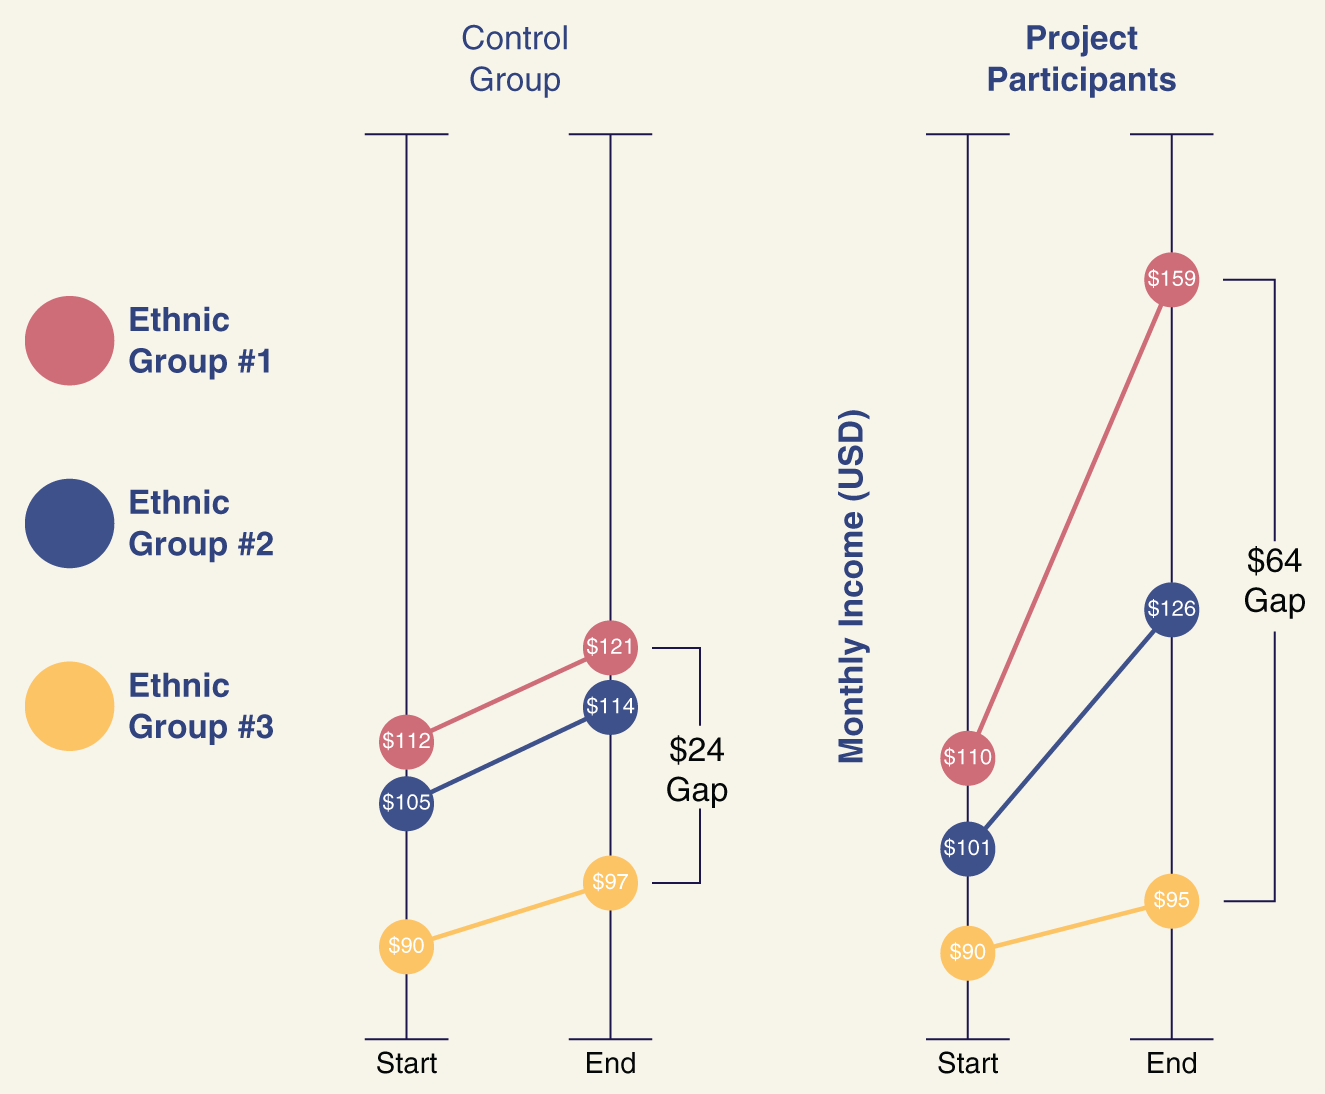
FIGURE 14.2 Adopted from We All Count
For example, if a city government is trying to determine whether a new policy increased income for the population of a certain neighborhood, an RCT can tell them that the population experienced an average increase of $27 after the policy was implemented.
What if we evaluated that data with an equity lens?
Let's say the people included in this project identify as members of three distinct ethnic groups, who started at different income levels, and experienced their incomes increasing at different rates throughout the project, as shown in figure 14.2.16
For the overall group, the average income increase was $27. But when we break it down, there is more to this story. Average income for the first ethnic group increased by $5. The second group saw an average increase of $25, and the third, $49. That's a 45 percent increase for the group that started in the most privileged position, and only a 6 percent increase for the poorest group. In fact, it appears this project widened the overall income gap between groups.
Similarly, you could discover that the representation of women in your organization is 15 percent below the representation of women in the pipeline for your industry, so you institute a change in hiring processes. Over a year, you see the gap close. What you may not see, however, is that you've increased the share of white women by 20 percent and lost 5 percent women of color by focusing more on gender at the expense of losing focus on race. Or, perhaps the entire increase is accounted for by hiring more women into departments where women were already overrepresented. RCTs will not reflect this.
To evaluate with an equity lens, you have to look beyond the results of an RCT.
Debiasing Your Data
Even when you find a source of potential bias in your model, you can't always change the data set or circumstances you're working with. If you are forced into accepting that biases will persist in your model, multiple statistical methods exist for estimating the effects of the biases and adjusting your algorithms to compensate for them. I will not derive full mathematical explanations of how to do that here; however, We All Count (accessible at WeAllCount.com) provides extensive resources on techniques such as propensity score matching, and building mixed-effects models with an interaction effect for the biasing characteristics.
In addition, if there are particular characteristics that you know will bias how a model evaluates job applicants, you can “blind” applications or resumes before an algorithm is applied to them. In fact, AI can be the solution to the AI problem! Platforms such as Gapjumpers and Blendoor have been developed to scrub names and demographic information from resumes, cover letters, and other job application materials. You can use these to remove biasing characteristics from application materials before running them through an automated sorting process.
Finally, beware of using proxies to attempt to fix incomplete or skewed data sets. Chapter 9 on pay equity explains the potential dangers of substituting, for example, age as a proxy for experience. In industries and roles where switching careers is common, age is not representative of years of experience.
If you discover a missing data set that you wish you had access to, it can be tempting to use a proxy. Instead, I recommend making the effort to locate data sets from outside your organization that describe the group you are trying to understand. The Black Futures Lab, for example, launched the Black Census Project in 2018 to provide data on the experiences, views, and backgrounds of Black Americans.17 We All Count features more of these resources, including a wealth of powerful data equity tools for any employers looking to hire from, understand better, or simply respect Indigenous communities in the US.
Transparency
In her book, Cathy O'Neil lists three key traits that separate simple, harmless algorithms from weapons of math destruction. The first is transparency. Algorithms that are opaque or invisible have more potential to harm vulnerable groups. When nobody knows the variables that comprise a model, nobody knows who is being left out, who may benefit, and who may be harmed.
Transparency also levels the playing field. In chapter 6, I told the story of my friend, Aaron, who took a personality test to apply for an accounting job. I didn't discuss Aaron's competition. Applicants with the means to pay career coaches would have had a greater chance to “game” that test. Career coaching industries are now built on knowing which companies use which tests, what they ask, and, as in video gaming, how to “win.” The less transparent you are about your hiring algorithms, the more likely you are to accept applicants who have been keyword-coached and miss out on applicants with superior qualifications but less access to AI coaching.
To foster transparency, I recommend including a condensed version of what Krause refers to as a “data biography” with all algorithm-based models. This data biography should be available to anyone interacting with the algorithm and should include the following.
The elements of your equation. What + What = What? Let users know exactly what factors comprise your mathematical model and how they are weighted.
How the data is used. Most data lives long beyond its original purpose. The EU has regulated this fact of data life through their General Data Protection Regulation (GDPR) standards, which require businesses to disclose how data is stored, used, and eventually destroyed. Businesses can model ethical data usage by mirroring this standard, stating whether the data will be used for any purpose other than its originally intended use.
Who created the mathematical model. In his interview, Gaskell emphasizes that transparency is essential beyond the algorithm itself. Knowing who created the model fosters accountability and highlights any possible motivations or biases that could have been embedded by the designer.
Data sets and specific definitions. Describe the data sets that were used to build your algorithm and provide specific definitions that are methods-based. For example, if you say that you built an algorithm based on a data set in which 20 percent of respondents were Black, does that mean…
- That others identified them as Black?
- That they self-identified as Black?
- That they self-identified as Black by writing it in?
- That they self-identified as Black by picking it from a list that included White, Hispanic, Asian, Middle Eastern, Black, and other? Could they pick only one option or multiple options?
These versions of “Black respondents” all have different embedded meanings.
How the model was evaluated (and reevaluated and adjusted). How was the model tested? How often is it retested? When was the last time it was adjusted based on findings from impact evaluations?
≈
This chapter may have seemed to miss an obvious and important workplace-related AI theme: job automation. Looking forward, AI won't just determine who is selected for jobs, it will select which jobs will still exist at all.
Automation is just one aspect of a future of work that is unknown to us. It's easy to wonder if it's even possible to create a DEI strategy now that will still be relevant in an uncertain future.
No matter what your future of work will look like, 10 core DEI principles can help guide your way.
Notes
- 1. “Leadership Principles,” https://www.amazon.jobs/en/principles.
- 2. Jeffrey Dastin, “Amazon Scraps Secret AI Recruiting Tool That Showed Bias Against Women,” Reuters, October 10, 2018, https://www.reuters.com/article/us-amazon-com-jobs-automation-insight-idUSKCN1MK08G.
- 3. “The Changing Face of HR” (The Sage Group, 2020), https://online.sageintacct.com/rs/473-QSL-641/images/changing-face-hr-research-HR-People-Mgt.pdf.
- 4. Cathy O'Neil, Weapons of Math Destruction: How Big Data Increases Inequality and Threatens Democracy (New York: Crown Publishing, 2016).
- 5. Caitlin Dewey, “The Only Guide to Gamergate You Will Ever Need to Read,” Washington Post, October 14, 2014, https://www.washingtonpost.com/news/the-intersect/wp/2014/10/14/the-only-guide-to-gamergate-you-will-ever-need-to-read/.
- 6. Harry Gaskell and Binna Kandola, “Episode 5: AI—Is It Bias, and What Does That Mean for the Workplace?” November 19, 2019, in Racism at Work, podcast, MP3 audio, 45:06, https://pearnkandola.com/diversity-and-inclusion-hub/guides-and-tools/racism-at-work-podcast-episode-5-ai-bias/.
- 7. James Somers, “The Pastry A.I. That Learned to Fight Cancer,” New Yorker, March 18, 2021, https://www.newyorker.com/tech/annals-of-technology/the-pastry-ai-that-learned-to-fight-cancer.
- 8. Suresh Sambandam, “Combining Human and Artificial Intelligence for a More Inclusive Work Environment,” HR Technologist, November 12, 2019, https://www.hrtechnologist.com/articles/digital-transformation/combining-human-and-artificial-intelligence-for-a-more-inclusive-work-environment/.
- 9. Example: https://www.ibm.com/support/pages/node/627717.
- 10. Mimi Ọnụọha, “The Library of Missing Datasets,” 2016, https://mimionuoha.com/the-library-of-missing-datasets.
- 11. APA Dictionary of Psychology, s.v. “interviewer effect,” accessed October 13, 2021, https://dictionary.apa.org/interviewer-effect.
- 12. https://weallcount.com/.
- 13. Heather Krause, “Is the ‘Interviewer Effect’ Skewing Your Survey Results?” We All Count, January 30, 2019, https://weallcount.com/2019/01/30/an-introduction-to-the-interviewer-effect/.
- 14. Paul J. Lavrakas, Encyclopedia of Survey Research Methods (Thousand Oaks, CA: Sage Publications, Inc., 2008), https://dx.doi.org/10.4135/9781412963947.
- 15. Heather Krause, “Foundations of Data Equity” (presentation, We All Count, November 2020), https://weallcount.com/wp-content/uploads/2020/12/Data-Equity-Framework-Talk-November-2020.pdf.
- 16. Krause, “Data Equity.”
- 17. “Black Census Project Results,” Black Futures Lab, 2019, https://blackcensus.org/?mc_cid=7dc380cde6&mc_eid=2f391118d6.