CHAPTER 29
INSIGHTS CURATION PLAY: How do I consolidate and leverage research insights?
Even when organizations conduct and prioritize user research, the insights and learnings are not always used to their full potential. The findings are not shared with a wide enough audience, stored in an accessible place, or presented in a meaningful manner—so other teams aren’t aware that the resources even exist. This UXReactor play shows you how to centralize your resources, develop meaningful analysis, and use the data to find patterns and make predictions.

Who Are the Key players in the Insights Curation play?
| ROLE | WHO’S INVOLVED | RESPONSIBILITIES |
|---|---|---|
 DRIVER |
|
|

CONTRIBUTOR |
|
|
THE HOW
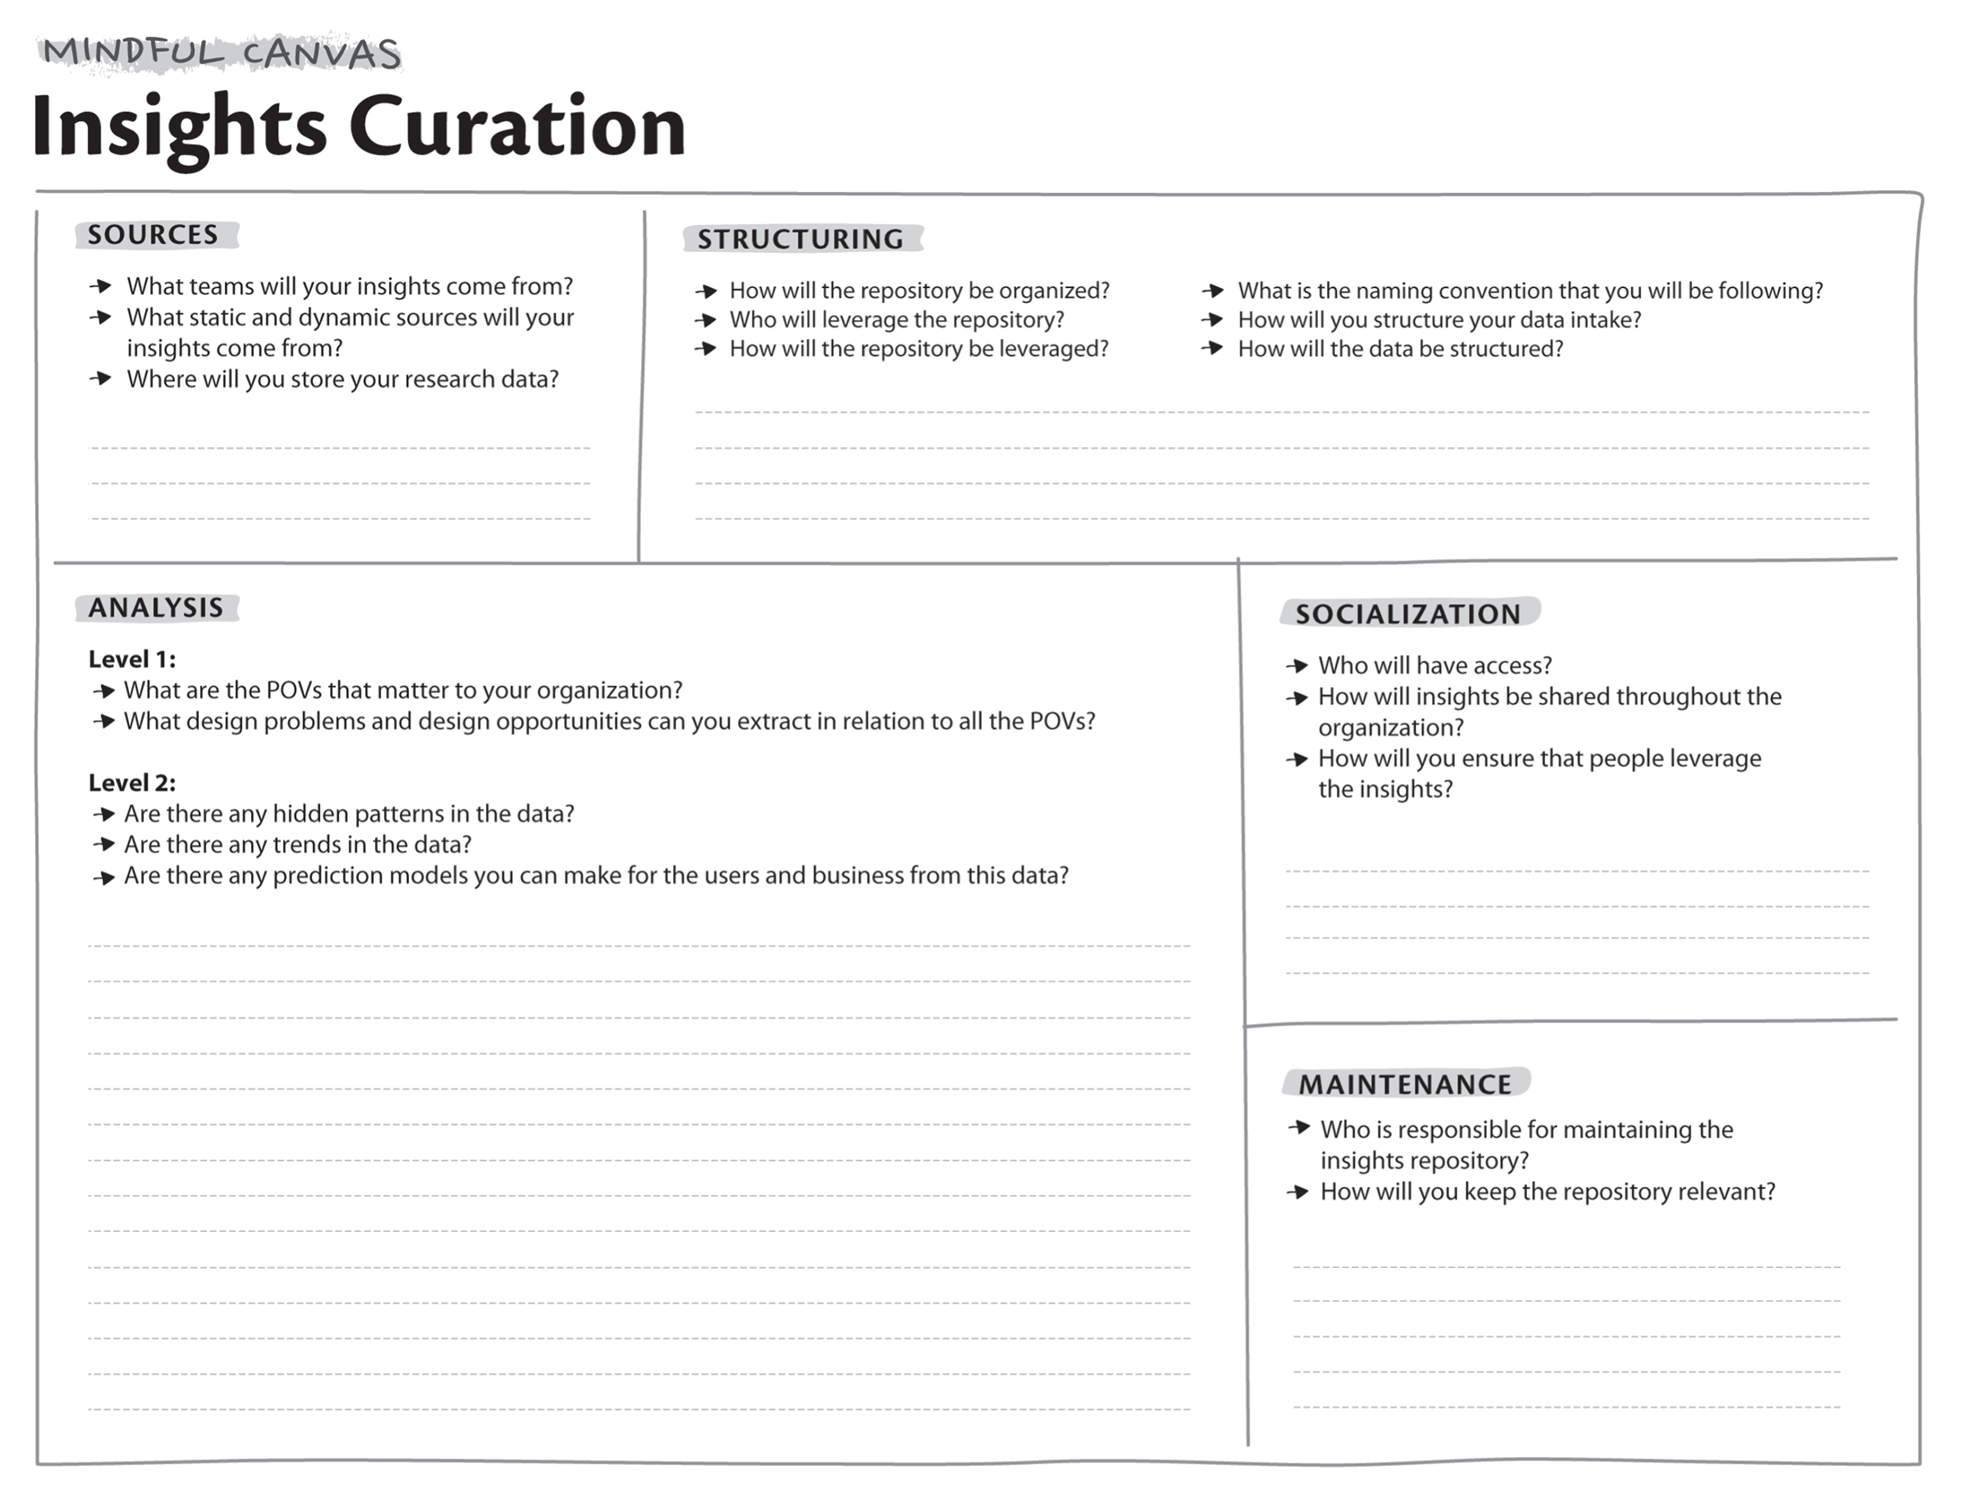
To effectively establish insights curation, you need to be mindful of:
1. The SOURCES and Storage of Your Insights
User insights live in all departments of an organization, not just in user research. Departments such as marketing, support, sales, and even finance all generate and collect valuable user and business data; however, this data often remains siloed in those departments.
Key user insights are the actions, soundbites, and observations gathered about the user in the department. These insights can include things that the user likes, dislikes, needs, feels, wants, and does in the context of the ecosystem or the product.
Break the silos and create a collective repository of all of your organization’s insights by:
- Taking inventory of all the teams that are collecting data on the users and business;
- Creating a single place for teams to store their data and insights.
The insights repository will need a designated digital storage space that is easily accessible for all parties in your organization but also secure enough for proprietary information. This allows for more transparency and collaboration across departments and ensures that data is not lost over time.
When building a robust repository, collect data of all shapes and sizes:
- Static data, such as reports or analytics from instrumentation;
- Dynamic data, such as social media chatter;
- Quantitative data, such as satisfaction scores;
- Qualitative data, such as videos or images from interviews.
2. What Systems You Put in Place for STRUCTURING Your Data
An insights repository is only helpful if its users can find the information they need. Once all of the data from across your organization is in a single place, structure the data to make it meaningful and easy to use.
Think about who will be leveraging the repository and what they will be leveraging it for.
Use this information to:
- Establish structured naming conventions;
- Create an intuitive information architecture;
- Define meaningful indexing.
A new employee might leverage the repository to learn everything there is to know about a specific product. An experience practitioner might leverage the repository to find all of the pain points for a specific user.
3. The Maturity of Your ANALYSIS
With your data structured, you can now begin getting value out of your insights repository. At the very minimum, an insights repository should help the user find what they were looking for. Further enhancements to the insights repository could include helping the user discover additional related resources or even predicting what information they will need.
There are two levels of analysis your organization should be conducting as your repository grows. They represent different levels of value you can generate with your repository.
Level 1: Points of View (POVs)
A POV is a curation of data for a specific perspective. For example, if someone wants to analyze/study/research insights from the POV of a specific user, they should be able to access not only those user insights but all the related insights about products, teams, and experiences that pertain to that user.
Think about the different POVs that typically matter to your organization:
- User: “I want to see all there is to learn about the agent.”
- Intent: “I want to see all there is to learn about users who want to manage clients.”
- Product: “I want to see all there is to learn about the ‘Agent Portal.’”
- Experience: “I want to see all there is to learn about onboarding experiences.”
- Releases: “I want to see all there is to learn about the Q2 2021 release.”
- Domain: “I want to see all there is to learn about real estate.”
Anyone in the organization should be able to pick any of the POVs above and get immediate value from the insights. Value comes in the form of increased knowledge, time saved, more informed decisions, and increased empathy.
This level of analysis should also provide enough information for you to extract design problems and opportunities for the user, product, and business.
Level 2: Trends and Correlations
The next level of data analysis maturity is connecting the dots between the insights to find correlations, identify trends, and eventually make predictions.
Look for trends between data points such as experience metrics user sentiment, different releases, or product performance. Understanding trends and correlations in your data can drive immense value to your business. It can shed light on the areas where your users’ experience is doing well or not well, and it can highlight what kind of impact that might have on your business.
You may see an inverse correlation between user satisfaction and the amount of time it takes for them to complete a workflow. This tells you where opportunity lies. Or you may see that all users who have two or less years of experience complain the most about the intuitiveness of the product. This tells you that you need to make the experience friendlier to novice users.
As your repository grows, the volume of data you have access to also will grow. Eventually, your computation power will increase to the point where you can create models to predict future impact. This means you should be able to look at a set of insights around a certain topic and predict how it will affect something about the product later down the line.
Having this deeper level of knowledge will help your teams make more informed decisions, improving your users’ experience and driving more short‐ and long‐term value to your business.
4. Frequent SOCIALIZATION to Drive Utilization
When leveraged well, an insights repository can grow the tribal knowledge of your organization, increase overall empathy, and mitigate product churn. Everyone in the organization needs to be aware of and regularly leverage the repository.
- Give everyone access;
- Share insights often;
- Encourage frequent usage.
5. Consistent MAINTENANCE
Just as a library needs a librarian to manage the curation of books, an insights repository needs an owner to manage and maintain it.
Assign an owner to maintain the data to ensure it can be easily accessed and findable. This owner will use standardized processes and guidelines to make the repository user‐friendly, establish the cleanliness of metadata, and prevent churn for future owner(s) as the repository grows. They are responsible for keeping the repository up to date and relevant so that it will always drive value to your organization.
IN ORDER TO MAXIMIZE THE VALUE OF THIS PLAY
- Establish a single source of truth. Your repository should be a one‐stop shop for your entire organization. Make sure that the repository does not contain multiple or varying versions of the same data.
- Manage your permissions. To reduce the risk of accidental tampering, make sure your repository has sufficient levels of permissions.
 RELATED PLAYS
- Chapter 17: “Shared Empathy Play”