CHAPTER 28
EXPERIENCE METRICS PLAY: How do I measure the success and quality of my user’s experience?
Many businesses measure their success using financial or operational metrics, such as revenue or the number of sign‐ups. However, when it comes to how valuable your product experience is to your user, these are indirect metrics. Businesses wanting to fuel their growth with a user‐first philosophy should be measuring their success using experience metrics: metrics that quantify the quality of the experience, its value to the user, and its level of desirability.
The experience metrics play helps you identify and measure these metrics for each of your users. Consistently keeping them in sight will foster a user‐first culture within your organization and will have a visible impact on your business metrics as a whole.
Who Are the Key players in the Experience Metrics?
| ROLE | WHO’S INVOLVED | RESPONSIBILITIES |
|---|---|---|

DRIVER |
|
|

CONTRIBUTOR |
|
|
THE HOW
To run an effective experience metrics play, you need to be mindful of:
1. The USER You Want to Focus On
Experience metrics are subjective to each user’s unique needs, so they must be measured for each key user within your system. Clearly define the criteria for each user you want to focus on. Criteria to pick the key user could include how large this user segment is, the influence they have in their organization/context, and criticality to your business strategy.
For this play to be effective, you will need to recruit real users to help you measure experience metrics. Once you’ve identified your key users, create screeners and recruit people (we recommend between 10 and 15) to take part in this evaluation (Chapter 26: “Research Recruitment Play”).
2. What EXPERIENCES Are Most Relevant to Your User
Identify the experiences that are most important to your user or most common in their line of work. List the relevant scenarios that help users achieve each of these experiences.
As you define which experiences and scenarios to measure, keep in mind that this play is intended to be repeated over time. This means that every time you use this play, you will need to use the same experiences and scenarios so you can accurately compare the resulting metrics. This will eventually help you identify a clear trend for the direction in which the metrics are moving.
3. What EXPERIENCE METRICS You Want to Measure
Experience metrics focus specifically on aspects of the experience that are most important to the user—both rational and emotional. Many B2B products in the market today are built to serve the needs of the businesses (increasing productivity, reducing costs, streamlining processes), which is why products can have high sales yet have low user satisfaction scores—the person buying the product is not the person who ends up using the product. To truly be user‐centric, we need to focus on who actually “experiences” the product and the things they care about most in an experience.
HOW DO YOU DO THIS?
Step 1: Understand your user insights.
All experience metrics must trace back to user insights. Leverage the key insights you know about your user (Chapter 14: “User Empathy Play”) to identify what matters most to them.

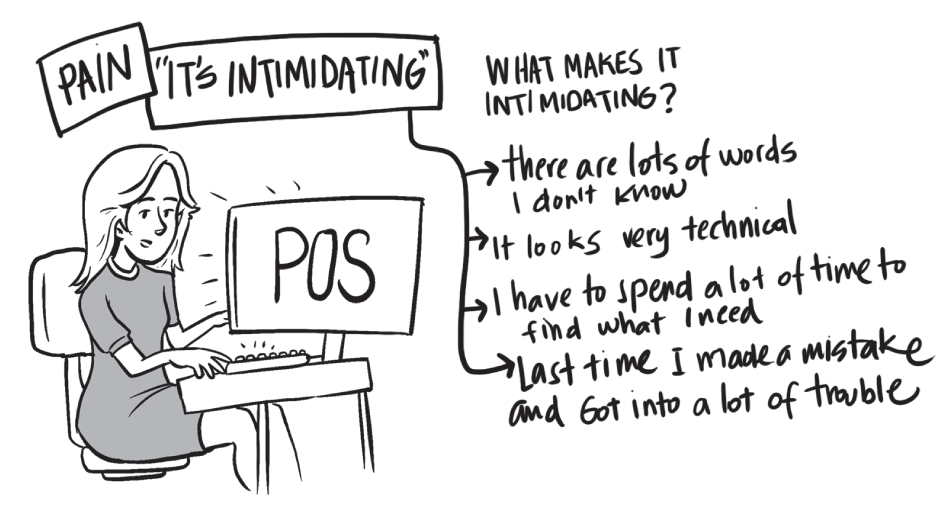
User pains are the things that negatively affect users’ experiences. Take note of what the users are struggling with and also what they wish for. These could surface hidden pain points or provide additional insight into what your users value.
User joys are the things that elevate a user’s experience. Take note of details such as their stated delight factors, what they love most about their jobs, or their ideal experience.
User needs are the things that a user requires in an experience. Take note of what your users do and how they must be supported for them to reach their outcomes.
User successes reveal the goals and outcomes they want and need to achieve.
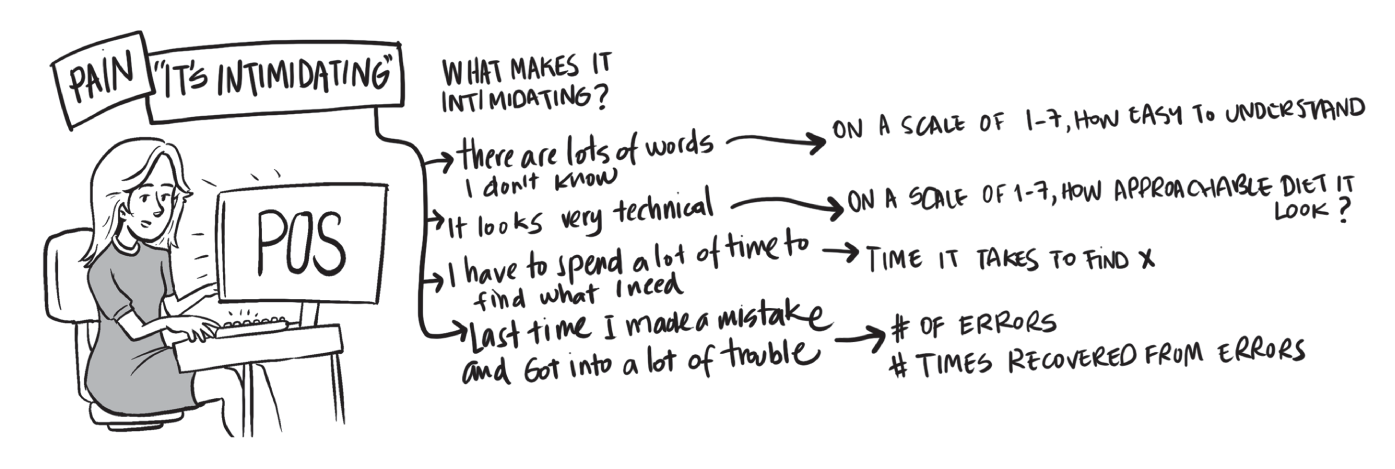
Step 2: Variablize these insights to find the possible root causes.
Identify all of the possible factors, aka variables, that contribute to each insight. For every insight, there can be any number of variables that make an experience a source of a pain, joy, need, or success to the user. By finding the variables, we can start to identify the root causes behind these insights and understand the user’s mental model of a good or bad experience.
For each insight, ask, “What are all the things that make this a pain/joy/need/success to the user?
Step 3: Determine which variables are RATIONAL vs. EMOTIONAL, and assign quantifiable measures for each.
It is important to know both how well the product is helping users get their jobs done (rational) and how delighted and satisfied they feel while using the product (emotional).
- Rational variables are quantitative variables, such as “transaction completion time” or “number of voided bills.” They also can come from sensorial data that you regularly collect through telemetry, such as “number of clicks” or “load time.” Rational variables can be used directly as experience metrics.
- Emotional variables are qualitative variables such as “approachable” or “feeling empowered.” Emotional variables cannot be measured concretely; they require other methods:
Applying a Likert scale (on a scale of 1–7) to the variable. Standard scores such as NPS or CSAT are great examples of how emotional variables are quantified in the market today.
Further variablizing the emotional variables to see if any rational metrics contribute to the emotion.
| RATIONAL | EMOTIONAL |
|---|---|
|
|
4. The METHODOLOGY You Use to Measure the Experience Metrics
There are many methods you can choose from (Chapter 25: “Picking a Research Method Play”), but whatever method you choose should provide the ability for:
- Users to interact with your product;
- Users to answer quantitative (rational) and qualitative (emotional) questions;
- Users to provide candid feedback;
- Researchers to accurately measure rational and emotional metrics.
You do not need to strictly adhere to only one method; instead use a combination of methods as you see fit. For example, you can combine elements of interviews (where user researchers can ask qualitative questions), usability tests (where users can interact with the product to test each experience and researchers can measure metrics such as “time to completion”), and surveys (where users can answer sets of standardized quantitative questions for research to later analyze).
As you plan your method, be meticulous about the STIMULUS and PROTOCOL.
The STIMULUS is the prototype participants will use during the evaluation. Stimuli can come in varying fidelities, but as a rule of thumb, the higher the fidelity of your stimuli, the more accurate your findings will be. Note that the fidelity of your prototype must be the same every time you run this study if you want to compare metrics over time.
The PROTOCOL is the script you will use to effectively capture all the data and insights you need. The protocol contains:
- The tasks you will give to your participants: What are realistic scenarios your users might encounter during your selected experiences? When you write your tasks, include the context and the action you would like for them to perform. However, try not to be too prescriptive in your tasks; otherwise, the participants will spend more time remembering the task and less time showing you how they would go about it.
- Do: “Your company just started using a new communication tool, and they shared the following email with you to help you get started. Create your account and set up your profile.”
- Don’t: “Click on the link in the email. Select the ‘create new account’ option, then setup screen to add yourself as an employee, and when you are done, fill in your information and photo in the profile. Click ‘Save’ when you are done”.
- The success criteria for these tasks: The more specific your success criteria is, the more consistent your synthesis will be.
Success criteria: the participants must complete 80% of the following”
- Select “Get Started” in the email;
- Add all required fields in “setup”;
- Select “employee” as the user type;
- Add all required fields in “profile”;
- Save profile and land in the main chat screen.
- The questions you want to ask: Are there any qualitative or quantitative insights you want to know? As a best practice, try to standardize the questions you ask to make sure you are collecting the same information for each task from all of your participants. This is a great opportunity to gather more subjective and emotional metrics.
- Questions to ask after each task:
- What, if anything, did you like the most about what you just experienced?
- What, if anything, did you dislike the most about what you just experienced?
- How would you rate the intuitiveness of the tool during that task on a scale of 1–5 (1 being very unintuitive and 5 being very intuitive)?
- How would you rate the usefulness of the tool during that task on a scale of 1–5 (1 being very not useful and 5 being very useful)?
- On a scale of 1–7 how much do you agree with the following statement: I feel like I was recognized for my accomplishments (1 being strongly disagree and 5 being strongly agree).
Before starting your evaluations:
- Run an initial evaluation in a controlled environment—for example, in a usability lab—to establish baseline experience metrics for the user’s experience. This will allow you to compare subsequent results and single out the variables that are making your experience better or worse for the user.
- Define thresholds for what defines a subpar, average, and excellent experience. This will keep everyone on the same page on what’s good or poor when they receive the study results.
- A reliable and standardized method for evaluation is critical for measuring your experience metrics consistently over time. Consistency is absolutely necessary for comparing results.
5. ACTIVATING Your Findings
Experience metrics are meant to help all teams within your organization take action. So once you’ve measured and collated the results for each experience metric, socialize the results with the appropriate cross‐functional team so you can collaboratively prioritize which design problems to solve for the user to improve the experience.
Ideate on the best solutions to solve these design problems, implement the solutions, and run the evaluation again. The results must be compared over regular time intervals—every quarter, every six months, or every year—in order to signal areas of improvement or continued opportunities for refinement.
6. CORRELATING Metrics with Business Outcomes
Delivering great experiences has a ripple effect across all aspects of the business. As you measure your users’ experience metrics, map the downstream impact of these metrics to the business metrics you measure. You will see that all business goals can be traced back to the quality of your users’ experiences:
- Financial: User‐centric experiences help companies have faster revenue growth. Products that deliver better user experience not only lead to greater adoption and retention, but they can also demand higher margins because customers are willing to pay more for a better experience.
- Customer: Building more desirable, usable, and useful products improves the business performance across the customer life cycle. Specifically, you’ll generate more interest among prospective customers, win more customers, keep more customers engaged and satisfied, see more repeat purchases, and generate more customer lifetime value.
- Process: You will see positive changes in your internal innovation process and operations when you focus on delivering great experiences to your users.
- Innovation process: Gathering user experience feedback jumpstarts the innovation process so organizations can build and sustain their competitive advantage.
- Operations: Teams grounded in user feedback are more motivated to break down organizational silos and work collaboratively to revamp their products and give users a better experience (Chapter 36: “Cross‐Functional Collaboration Play”).
- Employees: Focusing on delivering the best experience for users allows your employees to be more connected to a higher and more powerful purpose (Chapter 17: “Shared Empathy Play”). User‐centric companies have higher overall employee satisfaction and a strong empathetic culture (Chapter 16: “Culture Design Play”).
The types of metrics a company focuses on can speak volumes about what’s important to them. Do they prioritize increasing profits and lowering costs? Or do they make their users’ goals their own, and truly exhibit an empathetic, user‐first culture?
IN ORDER TO MAXIMIZE THE VALUE OF THIS PLAY
- Use experience metrics to drive cultural change. Socialize your experience metrics often, and use them to set clear goals for your teams. Create team success metrics that correlate with your experience metrics so you can keep the user as everyone’s priority.
- Keep the study design as consistent as possible. Standardize participant criteria, experience metrics, tasks, and methodology; otherwise, you will not be able to make apples‐to‐apples comparisons over time.
- Know why you’re measuring a metric. You could come up with a million variables that could generate a million experience metrics, but that won’t help you accurately or effectively measure an experience. Anchor back to the core user problems that you are aiming to solve, and assess their impact on your user’s experience.
 RELATED PLAYS
- Chapter 16: “Culture Design Play”
- Chapter 17: “Shared Empathy Play”
- Chapter 25: “Picking a Research Method Play”
- Chapter 26: “Research Recruitment Play”