CHAPTER 3
Equity Shares, Preferred Shares, and Stock Market Indices
INTRODUCTION
Equity shares, or shares of common stock of a company, are a type of financial claim issued by the firm to investors, who are referred to as shareholders. In return for their investment, the shareholders are conferred with ownership rights. A firm must have a minimum of one shareholder, and there is no limit to how many shareholders a firm may have. Correspondingly, there is no restriction on the total number of shares that may be issued by a firm. Large corporations have a large number of shares outstanding, and consequently their ownership is spread over a vast pool of investors. Shareholders are part owners of the company to whose shares they have subscribed, and their stake is equal to the fraction of the total share capital of the firm to which they have contributed.
At the outset, when a firm is incorporated a stated number of shares will be authorized for issue by the promoters. The value of such shares is referred to as the authorized capital of the firm; however, the entire authorized capital need not be raised immediately. In practice, often a portion of what has been authorized is held for issue at a later date, if and when the firm should require additional capital. Thus, what is actually issued is less than or equal to what is authorized and the amount that is actually raised is referred to as the issued capital. The value of the shares that is currently being held by the investors is referred to as the outstanding capital. In most cases, the outstanding capital is synonymous with the issued capital. In the event of a company buying back shares from the public, however, the outstanding capital will decline and consequently will be less than what was issued.
Shareholders are entitled to share the profits made by the firm, as they represent the owners of the venture. A firm will typically pay out a percentage of the profits earned by it during the financial year, in the form of cash to its shareholders. These cash payouts that shareholders receive from the firm are referred to as dividends. In practice, the entire profits earned by a firm will usually not be distributed to the shareholders. Most companies will choose to retain a part of what they have earned to meet future requirements of cash on account of activities such as expansion and diversification. The profits that are retained or reinvested in the firm are called retained earnings. The earnings that are retained will manifest themselves as an increase in the Reserves and Surplus account and will show up on the liabilities side of the balance sheet of the firm. Retained earnings can be a major source of capital for a corporation.
Shareholders are termed as residual claimants, and this categorization is valid in two respects. Every firm will have creditors to whom it owes money on a priority basis. For instance, it is a common practice to raise borrowed capital from investors in the form of what are known as bonds or debentures, a topic that we will cover in the next chapter. Creditors always enjoy priority over the owners of the firm when it comes to receiving payments. Thus, a firm may declare a dividend only after all payments due to its creditors have been made. Consequently, dividends are not contractually guaranteed, and can in principle fluctuate significantly from year to year. Being a residual claimant, a shareholder cannot demand a dividend as a matter of right. It is up to the board of directors of a firm to take decisions pertaining to dividends. Shareholders, of course, indirectly influence the dividend policy of the firm, because they have the power to elect the board of directors.
Shareholders may be said to be residual claimants from another perspective as well. At times sustained losses could lead to a situation where a firm is forced to file for bankruptcy. In such cases the assets of the firm will be liquidated and the proceeds from the same will be used to compensate the stakeholders. Once again the order of priority is such that the creditors will have to be paid first. If any funds were to remain after the creditors have been fully paid, then and only then will the shareholders be entitled to a return of capital.
Equity shares have no maturity date. That is, in practice, no entrepreneur will incorporate a company with a termination or winding-up date in mind. Thus the shares issued by the firm will continue to be in existence until and unless the firm itself is wound up. In contrast, most bonds and debentures, as we will see in the next chapter, are issued for a specified term to maturity.
Unlike the owners of a sole proprietorship or a partnership, shareholders of a corporation enjoy limited liability. That is, if a firm were to face serious financial difficulties and consequently be unable to pay what is due to its creditors, neither it nor its creditors can make financial demands on the shareholders by asking them to commit more capital. On the other hand, if a partnership were to go bankrupt, its creditors can come after the partners personally and stake a claim on their personal assets. Thus, the maximum financial loss shareholders may suffer is limited to the investment they made in the process of acquisition of shares at the outset. That is, the market price of a share has a lower limit of zero in principle, and if this limit were to be reached, the shares will be totally worthless, and the investors would have lost the entire amount they invested.
PAR VALUE VERSUS BOOK VALUE
Common stock usually has a par value also known as the face value or the stated value. The par value has no significance in practice, and in countries like the United States it can be fixed at a low and arbitrary level. Many companies in the United States choose to issue stocks with very low par values because, as per the regulations of certain states, the cost of incorporating a firm is based on the par value of the shares being registered. Hence such fees can be minimized by assigning low par values.
In the case of shares with a nil par value, the creditors of the firm cannot ask the shareholders to contribute additional capital. This may be explained as follows. Assume a firm is authorized to issue 250,000 shares with a par value of $10 each, and that it has chosen to issue 150,000 shares. Thus, the authorized capital is $2.50 million while the issued capital is $1.50 million. At times, the company may ask the shareholders to pay up a fraction at the outset and call for the balance later. In such situations, the paid-up capital, which is the amount paid per share multiplied by the number of shares issued, will be less than the issued capital. If we assume that the shareholders have been asked to pay $8 per share, the paid-up capital is $1.20 million. If the firm were to subsequently experience financial difficulties, the creditors can demand that the shareholders pay up the difference between the issued capital and the paid-up capital, which is $300,000 in this case; however, if the shares have a zero par value, the entire contribution from the shareholders will be treated as the share premium, and such a demand cannot be made.
In the case of a no-par stock, the board of directors will assign a value to the stock each time they raise capital. Such stocks are popular with small organizations where the owners issue themselves a number of shares and simply infuse money into the corporation when needed. Such stock gives more flexibility to the corporation. Because there is no stated price for the stock, the directors can raise the price when the firm becomes more valuable.
The issue price of a share need not be equal to its par value and will often be in excess of its par value. This is true for companies that are already established at the time of issue. The excess of the issue price over the par value is referred to as the share premium. For instance, assume that Alpha Corporation is issuing 100,000 shares with a par value of $5 at a price of $12.50 per share. If the issue is successful, the company will raise $1,250,000 from the market. In the balance sheet, $500,000 would be reported as share capital and $750,000 would be reported as the share premium.
ACCOUNTING FOR A STOCK ISSUE
If shares are issued at the par value, the transaction would be recorded as follows. Assume 100,000 shares are issued at a par value of $10 each. Common stock, which is a liability for the firm, will be credited with $1,000,000 and cash, which is an asset, will be debited with $1,000,000. However, if the shares are issued at a premium of $10 each, then the common stock account will be credited with $1,000,000 and the additional paid-in capital account will be credited with $1,000,000. Cash will of course be debited with $2,000,000.
The book value is the value of a firm as obtained from the balance sheet or books of account, and hence the name. The term refers to the value of the assets behind a share, as per the balance sheet. In practice, it is derived by adding up the par value, the share premium, and the retained earnings and dividing by the number of shares issued by the firm. The book value can obviously be very different from the par value of the shares. A third term that is used in practice is the market value of a firm. This is the value assigned to the shares of the company by the stock market and is determined by multiplying the number of shares issued by the firm with the current market price per share.
VOTING RIGHTS
Investors who choose to acquire equity shares of a firm are conferred with voting rights, which includes the right to elect the directors of the company. The most common arrangement is to give a shareholder one vote per every share of stock being held; however, in practice, shares with differential voting rights can be issued.
If a firm were to issue multiple classes of shares, which differ from the standpoint of the voting rights bestowed on the holders, the categories of shares are usually otherwise similar to each other. That is, all shareholders, irrespective of their voting privileges, have an unlimited right to participate in the earnings of the corporation. They also have an equal right on the assets of the company upon liquidation, after all the other creditors and prioritized security holders have been paid off. All shares in a given class or category have equal standing, irrespective of the point in time or the price at which they are issued. For instance, if Alpha Corporation were to issue three years after its IPO, another 100,000 shares at $17.50 per share, then the newly issued shares will rank at par with the 100,000 shares issued earlier. In legal terms the two tranches are said to rank pari passu.
At times equity shares are divided into two or more classes with differential voting rights. One or more categories may have subordinated voting rights, and at times a category may be issued with no voting rights. The purpose of such an exercise is to vest the voting powers with a minority of shareholders who can consequently control the company with less than a 50% equity stake.
A group of shareholders can exert considerable influence over the affairs of their company if they satisfy one of these criteria:
- They own more than 50% of the voting shares.
- When they have one or more representatives on the board of directors.
- When they themselves are directors of the company.
In practice, minority shareholders have very little say in the affairs of their company, despite the fact that they do enjoy voting rights. This is particularly true when the company is controlled by a majority shareholder.
Statutory Versus Cumulative Voting
Every share of stock held by an investor corresponds to one vote for each director position that is up for voting; however, the votes may be apportioned in two different ways. Assume that a shareholder has 1,000 shares and that there are four vacancies on the board. If statutory voting were to be applicable, the shareholder can cast a total of 4,000 votes in all; however, not more than 1,000 votes can be cast in favor of any one candidate. On the other hand, if cumulative voting were to be applicable, then the votes could be apportioned in any way that the shareholder chooses. In this case too, a total of 4,000 votes can be cast. One shareholder may decide to cast 3,000 votes in favor of one candidate and 1,000 in favor of a second, without giving any votes to the remaining candidates. Alternatively, another shareholder in a similar situation may cast 1,000 votes in favor of each of four candidates. Cumulative voting is designed to give minority shareholders the opportunity to elect at least one candidate of their choosing, for it gives them the power to concentrate the votes on a candidate.
Proxies
In order to enjoy the right to vote, an investor must be a shareholder of record. What this means is the following. The registrar of a firm will be maintaining a record of its current shareholders. Only those listed on the corporation's register of shareholders as of a date known as the record date are eligible shareholders, from the standpoint of being eligible to cast a vote. The record date is usually a few days prior to the date of the meeting at which the actual voting will take place. Therefore, in practice, it is conceivable that a person who happens to be a shareholder of record, by virtue of their name appearing in the register on the record date, may have sold their shares prior to the date of the meeting. In such cases the new owner who has acquired the shares cannot in principle vote, as their name will not be reflected in the register. To get over this problem, the seller(s) of the shares can give a proxy to the buyer(s).
It is not realistic to expect a large percentage of the shareholders of large companies to attend the annual meetings in order to be physically present to cast their votes. Thus, in practice, companies choose to send a proxy statement to absentee shareholders along with a ballot, prior to the scheduled date of the meeting. The shareholders are expected to mark their preferences and return the ballot prior to the date of the meeting. A typical proxy statement will include information on the individuals seeking appointment or reappointment as directors, and details of any resolutions for which the opinions of the shareholders are being sought, which is consequently the raison d'être for the vote. Once the ballots are received from the absentee shareholders, they will be collated, and a person appointed by the firm will cast the votes as directed by the shareholders who have submitted the ballots.
In practice there is a critical reason why companies require shareholders to attend meetings or to send proxies if they are unable to be physically present. This is because a quorum is required before any business can be transacted. That is, a minimum number of shares must be represented at the meeting, either by the holders in person or in the form of proxies.
DIVIDENDS
As explained earlier, shareholders are residual claimants. Consequently, they cannot demand dividends from the firm; that is, dividends, unlike interest payments to creditors, are not a contractual obligation. That is, the payment of dividends is not mandatory, and the decision to pay or not to pay is entirely at the discretion of the board of directors of the company. Companies usually declare a dividend when they announce their results for a period. In the United States, since results are typically declared on a quarterly basis, dividends are also announced every quarter. In the United Kingdom most companies pay their annual dividends in two stages.
A dividend declaration is a statement of considerable importance. It is an affirmation by the company that its affairs are on track, and that it has adequate resources to reinvest in its operations as well as to reward its shareholders.
In the context of a dividend payment, there are four dates that are important. The first is what is termed as the declaration date. It is the date on which the decision to pay a dividend is declared by the directors of the company, and the amount of the dividend is announced. The dividend announcement will mention a second date called the record date. The significance of this date is the same as we have seen earlier for voting. That is, only those shareholders whose names appear as of the record date on the register of shareholders will be eligible to receive the forthcoming dividend.
A third and extremely critical date is what is termed as the ex-dividend date, which is specified by the stock exchange on which the shares are traded. The relationship between the record date and the ex-dividend date depends on the settlement cycle. The term settlement cycle refers to the duration between the date of a sale transaction and the date on which securities are received by the buyer and cash is received by the seller. The import of the ex-dividend date is that an investor who purchases shares on or after the ex-dividend date will not be eligible to receive the forthcoming dividend. Thus the ex-dividend date will be set a few days before the share transfer book is scheduled to be closed, in order to help the share registrar complete the administrative formalities.
Quite obviously, the ex-dividend date will be such that transactions prior to that date will be reflected in the register of shareholders as on the record date, whereas transactions on or after that date will be reflected in the books only after the record date. It is therefore easy to surmise the relationship between the two dates. Assume that an exchange follows a T+3 settlement cycle; that is, it takes three business days after the trade date to fully consummate the trade. Obviously, if the trade were to take place three days before the record date or earlier, then the transfer will be reflected as on the record date. Consequently, the ex-dividend date in such cases must be two business days before the record date.
The NYSE, for instance, follows a T+3 settlement cycle. Hence, on the NYSE the ex-dividend date for an issue is specified as two business days prior to the record date announced by the firm.
Prior to the ex-dividend date, the shares are said to be traded on a cum-dividend basis, which means that the right to receive the dividend is inherent in the shares. Therefore, an investor who acquires the share on a cum-dividend basis is entitled to receive the dividend. On the ex-dividend date, the shares begin to trade ex-dividend, which connotes that potential buyers will no longer be eligible to receive the next dividend if they were to acquire the share. This is because it is too late for buyers' names to figure in the register as of the record date, and consequently dividends will go to the parties selling the shares.
On the ex-dividend date, the shares ought to in theory decline by the amount of the dividend, if we assume there is no other information with implications for the share value that permeates the market. Thus, if the cum-dividend price is $75 per share at the close of trading on the day prior to the ex-dividend date, and the quantum of the dividend is $3.50 per share, then from a theoretical standpoint the market should open with a price of $71.50 on the ex-dividend date.
Finally, we have a date called the distribution date, which is purely of academic interest. This is the date on which the dividends are actually paid or distributed.
Dividend Yield
The annual dividend yield is defined as the annual dividend amount divided by the current share price, expressed in percentage terms.
For instance, take the case of a company that has reported a dividend of $2.50 per quarter over the past financial year. Assume that the current market price of the shares is $80. The dividend yield is:
The dividend yield is a function of the share price as well as the quantum of the dividend. Yields are generally lower for profitable companies as compared to companies in financial difficulty. If the profits and thus the dividends of a company are expected to increase over time, then the yield will be relatively lower. This is because the market will place a higher value on the shares of such companies. On the other hand, companies perceived as having a lower potential for growth will have a relatively higher dividend yield. Yields are also a function of the liquidity of a scrip. Potential buyers of a stock that is thinly traded are likely to require a higher rate of return, which will manifest itself as a lower price. Consequently, the yield for such stocks will be relatively higher. It is not necessary that a company that promises a steady growth pattern of dividends will be characterized by a dividend yield that will steadily increase over time. This is because a growing dividend stream will also lead to higher share prices. The net result on the dividend yield is therefore ambiguous.
It is not necessary that the dividends that are declared in a year be less than the profits earned by the firm. Companies are allowed to pay dividends out of profits retained in earlier years. Consequently a company with relatively low profits can declare a high dividend. Similarly, a loss-making firm too can declare a dividend. Companies generally try to maintain a steady growth rate in dividends. Ideally, the growth rate of dividends should be greater than or equal to the prevailing rate of inflation. In years of financial hardship a company may be forced to cut its dividend payout. Such cuts, however, can send unwarranted distress signals to the shareholders, and if the current financial situation is perceived as a temporary aberration, the firm, despite its difficulties, may opt to keep the dividend at a steady level by dipping into profits retained in earlier years.
Dividend Reinvestment Plans
Dividend reinvestment plans, referred to by the acronym DRIPs, are schemes that allow the shareholders to opt to have the cash dividends automatically reinvested in additional shares of stock. Members can directly acquire shares from the company and consequently do not need to route the order through a broker.1 The plans are typically administered by large banks that usually send a report every quarter to the participating investors stating how much dividend has been paid; how many additional shares have been acquired in the process of reinvestment; and the total number of shares held in the shareholder's account. The plan administrator may levy an annual fee, which will in some cases be paid by the company issuing the shares.
There are two basic types of DRIPs. In some cases the company will acquire shares in the open market and reissue them each time a shareholder expresses his desire to reinvest dividends. These plans are administered by a bank acting in the capacity of a trustee, which will actually buy the shares from the market for the investing shareholder. In these cases the shares are acquired at the prevailing market price. Brokerage costs are often paid by the company. The second type of reinvestment plans entails the issue of additional shares directly by the company. In such cases the issuing firms may offer the shares at a discount. Firms can afford to issue shares at below the market price because despite the discount, the shares can be sold at a higher price as compared to an underwritten public issue.
Stock Dividends
A stock dividend is a dividend that is distributed in the form of shares of stock rather than in the form of cash. The issue of additional shares is without requiring any monetary contribution from the investors, as a consequence of which such a corporate action is referred to as a bonus share issue in some markets. A stock dividend entails the transfer of funds from the reserves and surplus account to the share capital account. This is known as the capitalization of reserves. The net result is that funds are transferred from an account that belongs to the shareholders to another account that is also theirs.
Hence, from a theoretical standpoint, stock dividends do not create any value for an existing shareholder. For instance, assume that a shareholder owns 1,000 shares of a firm which has issued a total of 500,000 shares. So, this individual owns 0.20% of the firm. Now assume that the firm announces a 20% stock dividend, or 1 additional share for every five existing shares. If so, it will have to issue 100,000 shares of which this investor will receive 200. Hence after the issue of the additional shares, the investor will be in possession of 1,200 shares, which is 0.20% of the total number of shares issued by the firm, which is 600,000. Thus, the investor's percentage stake in the company remains unaltered.
From the perspective of the company, the issue of the new shares does not connote any changes in the asset base of the firm. Nor does it signal any enhancements to the earnings capacity of the firm. All that has happened is an accounting transaction. It is as if an investor has two bank accounts, one with Citibank and the other with JPMorgan Chase. What has happened is that we have debited one account and credited the other, without increasing or decreasing the investor's wealth in the process.
The share price should theoretically decline after a stock dividend is declared. Let us go back to our illustration and assume that the share price prior to the stock dividend was $60 per share. The ex-dividend price, P, should be such that
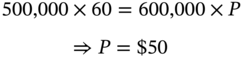
A stock dividend is usually declared when a firm wants to reward its shareholders without having to face an external outflow of cash. In practice there could be various reasons why the firm wishes to conserve cash. One reason could be that the firm is short of funds. Or else it could be that the available cash is required for productive investments.
Sometimes a company may declare a stock dividend prior to the payment of a cash dividend. The implications for the share price may be analyzed with the help of a numerical example.
Silverline Technologies has 500,000 shares outstanding, and the price is $60 per share. The firm announces a stock dividend of 20% and a cash dividend of $4.00 per share. The company also declares that the new shares that come into existence by virtue of the stock dividend will be eligible for the cash dividend.
The cum-stock dividend cum-cash dividend price is obviously $60. Hence the market value of the firm is
Because the stock dividend in theory is value neutral, in principle the market capitalization of the firm after the stock dividend should remain at $30,000,000. Thus, the theoretical price of ex-stock dividend ex-cash dividend shares will be
TREASURY STOCK
The term Treasury Stock refers to shares that were at one point in time issued to the public, but which have subsequently been reacquired by the firm.
These shares are held by the company and can subsequently be reissued, for instance, if and when employees were to exercise their stock options. Unlike the shares issued by the firm that are held by shareholders, Treasury shares carry no voting rights, are ineligible for dividends, and are not included in the denominator used for computation of the earnings per share (EPS).
Why do companies repurchase shares? One motivation could be that the directors of the firm are of the opinion that the market is undervaluing the stock, and consequently they would like to prop up the share price by creating greater demand. For a given level of profitability a buyback program will increase the earnings per share. And if the dividends per share (DPS) were to be kept constant, it would also reduce the total amount of dividends that the company needs to declare. Buyback is also a potent tool for fighting a potential takeover by corporate raiders. By reducing the shares in circulation, the current management can acquire greater control.
There are also situations where a company is generating a lot of cash but is unable to identify profitable avenues for investment, that is, it is unable to identify projects with a positive net present value (NPV). One way of dealing with such a situation is to declare an extraordinary dividend. But in many countries, shareholders are taxed for cash dividends at the normal income tax rate, which could be significant for investors in higher tax brackets. On the other hand, if investors were to sell their shares back to the firm at a price that is higher than what they paid to acquire them, the profits will be construed as capital gains, which in most countries are taxed at a lower rate.
ACCOUNTING FOR TREASURY STOCK
When a company buys back its own shares from the market, there are two ways of accounting for it, namely the cash method and the par value method. Assume that on 1 January 20XX, a company had issued 100,000 shares with a par value of $5 and a price of $8 each. Cash would have been debited with 800,000; common stock would have been credited with 500,000; and additional paid in capital would have been credited with 300,000.
Now, three years hence, the company decides to buy back 20,000 shares at a price of $9.50 each. Under the cash method, cash will be credited with ![]() . A contra liability account called Treasury Stock would be debited with $190,000. Unlike share capital, which will have a credit balance, a contra liability account will have a debit balance.
. A contra liability account called Treasury Stock would be debited with $190,000. Unlike share capital, which will have a credit balance, a contra liability account will have a debit balance.
If, however, the company were to use the par value method, it would proceed as follows. The Treasury Stock account will be debited with the par value of 20,000 shares, which is $100,000. The additional paid-in capital will be debited with $4.50 per share, which is the difference between the repurchase price and the par value and will amount to $90,000. Cash will once again be credited with $190,000.
SPLITS AND REVERSE SPLITS
An n:1 stock split means that n new shares will be issued to the existing shareholders in lieu of one existing share. For instance, a 5:4 split means that a holder of four existing shares will receive five shares after the split, without having to invest any more funds. From a mathematical standpoint this is exactly analogous to a 25% stock dividend. However, despite this equivalence, a stock split is operationally different from a stock dividend. While stock dividends entail the capitalization of reserves, stock splits do not. What happens in the case of a split is that the par value of existing shares is reduced and the number of shares outstanding is correspondingly increased. The net result is that the issued capital remains unchanged. For instance, take the case of a company which has issued 100,000 shares with a face value of $100. If it were to announce a 5:4 stock split, the number of shares issued would increase to 125,000, while the par value would stand reduced to $80.
Why do companies split their shares? In practice, companies generally go in for such a course of action if, in the perception of management, the share price of the firm has become too high. While in theory there is nothing wrong with the stock price being at a relatively high level, companies wanting to attract a broad class of investors will try to ensure that their scrip is within an affordable price range for small and medium investors. It is difficult to categorically state as to what a high price is, and what constitutes an affordable price range. But in practice it is believed that most managers have a feel for what is the popular price range for their stock. In other words, they are believed to be aware of the price range within which their stock should trade, if it is to attract adequate attention from investors. Historically investors have normally traded in round lots, or board lots, which is usually defined as a bundle of 100 shares. Anything less than a round lot is referred to as an odd lot. Round lots had a lot of significance when physical share certificates were the norm. In those circumstances special procedures were often required for odd lots, because only an investor with an odd lot was likely to be interested in another trader with a similar lot. It must be pointed out, however, that with the advent of dematerialized or scrip-less trading, this distinction does not carry any significance. Psychologically, though, many investors are still comfortable trading in round lots. At very high share prices, small and medium investors may not be able to afford round lots. Thus, one of the motives that has been expounded to justify stock splits is the desire to ensure that even small investors can buy round lots of the firm's shares.
The opposite of a stock split is a reverse split or a consolidation. The difference between an n:m split and an n:m reverse split is that in the first case n will be greater than m, whereas in the second case it will be less. For instance, assume that the company, which has 100,000 shares outstanding with a par value of $100, announces a 4:5 reverse split. It will subsequently have 80,000 shares outstanding, each of which will have a par value of $125. Companies are likely to go in for such a course of action if their managements perceive that their stock prices are too low. Exchanges like the NYSE discourage the listing of securities consistently trading at very low prices. This is because such prices have a tendency to attract inexperienced traders with unrealistic price expectations who could get their fingers burned. This is referred to as the penny stock trap. For instance, take the case of a share that is trading at $1. A naïve investor may buy it in the belief that a mere 50 cents increase in the price will amount to a 50% return on investment. What such investors fail to realize is that such a gain is highly improbable for a company in the doldrums.
In practice, stock splits will usually result in a reduced dividend per share. This is because, given that the number of shares on which dividends have to be paid is a multiple of the number of shares outstanding prior to the split, most companies will have little option but to reduce the magnitude of the dividend per share. In many cases, however, companies will increase the aggregate dividends. This may be best understood with the help of an example. Take the case of a company that was paying a dividend of $2.50 per share. Assume it announces a 5:4 split. The post-split dividend may be fixed at $2.20 per share, so that holders of four shares prior to the split – who would ordinarily have been entitled to a dividend of $10 – will now be entitled to an aggregate dividend of $11 on the five shares that they possess as a consequence of the split.
Costs Associated with Splits and Stock Dividends
Research by Copeland has found that there are two types of transaction costs that increase following a stock split. Such costs serve to ultimately reduce the liquidity of the stock. First, brokerage fees measured in percentages will increase after a split. Generally, fees for low-priced securities are a larger percentage of the sales price than they are for high-priced securities. For example, an investor will pay a higher commission when buying 100 shares trading at $100 each than when buying 40 shares trading at $250 each. Secondly, Copeland finds that the bid–ask spread, expressed as a percentage of the sales price, rises after a stock split. Thus, it is debatable whether the benefits associated with such corporate actions outweigh the corresponding costs.
PREEMPTIVE RIGHTS
The directors of a company must obtain the approval of existing shareholders if they wish to issue shares beyond what has already been issued earlier. As per the charter or articles of association of some corporations, existing shareholders must be given the first right to buy the additional shares being issued, in proportion to the shares that they already own. Of course, the right to acquire the shares confers them with an option, and does not require a mandatory course of action. Thus, this requirement ensures that existing shareholders have a preemptive right to acquire new shares as and when they are issued.2 In other words, they have an opportunity to maintain their proportionate ownership in the company. The merits of giving such rights to existing shareholders are debatable. Many people have argued that preemption rules prevent new investors from achieving meaningful stakes in companies, thereby narrowing the shareholder base and increasing dependence on a few investors. Others argue that the right to maintain one's proportional investment is just and fair for the existing shareholders.
Usually, the rights issue is made at a price that is lower than the prevailing market price of the share. If so, then the right acquires a value of its own. The existing shareholders in this case can either exercise their rights and acquire additional shares, or sell the rights to someone else. In most cases the discount from the prevailing market price is set between 10 and 15%. Readers may be surprised to know that rights issues too are usually underwritten. One may wonder as to why there is a need for underwriting, considering that the firm has a captive audience. The reason is that the rights issue must remain open for a specified number of days. During this period, it is conceivable that the market price may fall below the issue price set by the company. In such circumstances, investors would not subscribe to the issue since they can always acquire the shares for a lower price in the secondary market.
What is the value of a right? Let us suppose that a company has 1,000,000 shares outstanding and that shareholders are entitled to purchase one new share for every five shares they are holding; thus, the firm will be issuing 200,000 additional shares. Let us assume that the prevailing market price is $85 per share, and that the additional shares are being issued at $55 per share. The market capitalization of the firm prior to the issue is $85MM. The rights issue is infusing an additional $11MM into the firm. Thus, the post-issue firm value in theory ought to be $96MM. This would imply that, considering the fact that 1.2MM shares will be outstanding after the issue, the ex-rights price ought to be such that:

The current shareholders are getting a share worth $80 at $55. This implies that the value of the right to acquire one share is $25. Since the shareholder needs five shares to acquire the right to buy one share, the value of a right is $5.
Prima facie, it would appear that the issue of additional shares at a discount to their current value would amount to a loss for the existing shareholders. This is because while the cum-rights price is $85, the ex-rights price is $5 lower. But there is a fallacy in this perspective. It is important to remember that the shareholders have been given the opportunity to buy new shares at $55, and that this opportunity compensates for the decline in the price of the share.
For instance, let us consider an investor who is in possession of 100 shares. The value of these shares prior to the rights issue will be $8,500. If the investor decides to exercise those rights, they can acquire 20 additional shares by paying an additional $55 for each. The value of the portfolio in this case would be:
Thus, the portfolio is worth the original $8,500 plus the additional amount of $1,100 that the investor has pumped in. Consequently, there is no loss of value or dilution.
An investor who decides not to exercise their rights can renounce them in favor of another investor. The rights can in this case be sold for $5 per right. The investor's wealth in the event of such renunciation would be ![]() , which is nothing but the original value of the portfolio. Thus, in this case as well, there is no loss of value.
, which is nothing but the original value of the portfolio. Thus, in this case as well, there is no loss of value.
In practice, the ex-rights price may be higher than what we would expect from theory. This could be because the rights issue may be perceived as a signal of information emanating from the firm. In reality, the very fact that the company has chosen to issue additional shares may be construed as an indication of enhanced future profitability. A plausible reason could be that investors believe that the new funds raised will be used for more profitable projects. Another line of argument could be that, considering the fact that cash dividends are usually maintained at existing levels in the medium term, the additional shares from the perspective of the shareholders are a sign of greater profitability from the existing operations of the firm. Both these factors could serve to push up the demand for the firm's shares, and hence may lead to a situation where the ex-rights price, although lower than the cum-rights price, is higher than what is predicted by theory.
When a stock with rights is trading on an exchange it is said to be trading cum-rights. The rights certificates are issued to the shareholders on the rights record date. A rights certificate gives the shareholder the right, but not the obligation, to buy additional shares of stock at the subscription price. On an exchange that follows a T+3 settlement cycle, the ex-rights date will be two days before the rights record date. From the time of announcement of the rights issue until the ex-rights date, the rights are attached to the stock. During the ex-rights period the rights are sold separately just like a share of stock. The rights usually expire 4–6 weeks after the ex-rights date. After this point the rights are worthless.
Shareholders receive one right for each share of stock that they own. The number of rights required to acquire one share of stock is obtained by dividing the number of outstanding shares by the number of shares that the firm proposes to issue. For instance, assume that a company has 100,000 shares outstanding, and that it wants to raise $500,000 of capital by issuing rights with a subscription price of $25. Quite obviously it needs to issue 20,000 new shares. Consequently, the number of rights required to acquire one new share is
INTERPRETING STATED RATIOS
Consider a rights issue of one share for every four shares that are being held. In Europe and Asia this will be indicated as a 1:4 rights issue; that is, the first number denotes the additional quantity of the security to be distributed while the second number is the quantity of the underlying security relative to which the additional securities are being issued. Thus, an investor with 2,500 shares would be entitled to an additional 625 shares. In total, that investor will have 3,125 shares if exercising that right.
In the United States, however, this will be indicated as a 5:4 rights issue. The first number denotes the total quantity held after the event while the second number is the quantity relative to which the additional securities are being issued. Thus, an investor who is holding 2,500 shares will have ![]() shares if subscribing to the issue.
shares if subscribing to the issue.
HANDLING FRACTIONS
Assume that an investor is holding 945 shares of a company that has announced a 5:8 reverse split. This will consequently entitle the investor to 590.625 shares. Quite obviously, one cannot be allocated 0.625 shares of stock. Consequently, the issuer must specify a method to deal with this eventuality. The commonly prescribed methods include the following.3
- Round up the fraction to the next higher whole number. In this case it will be 591 shares.
- Round up the fraction to the next higher whole number if it is greater than or equal to 0.50. If it is less than 0.50, however, round down to the previous whole number. In this case it will be 591 shares.
- Round up the fraction to the next higher whole number if it is greater than 0.50. If it is less than or equal to 0.50, however, round down to the previous whole number. In this case it will be 591 shares.
- Round down the fraction to the previous whole number. In this case it will be 590 shares.
- Distribute cash in lieu of the fractional security. If we assume that the company pays out $20 per share, the investor will receive $12.50 in lieu of 0.625 shares.
In those cases where the rounding procedure leads to the previous whole number investors may be given an option to buy a fraction of a share so that they are entitled to the next whole number. For instance, if the practice is to round down to the previous whole number, investors may in this case be given the option to buy 0.375 shares so as to be entitled to 591 shares.
PHYSICAL CERTIFICATES VERSUS BOOK ENTRY
Traditionally, equity shares have been represented by physical certificates, where each certificate represents ownership of a stated quantity of shares. These days, however, in many countries, investors can hold shares as a computer entry or in book-entry form. This facility is provided by organizations known as securities depositories. In the United States the major depository is the Depository Trust and Clearing Corporation (DTCC). In the United Kingdom it is Crest, while in Europe we have Clearstream based in Luxembourg and Euroclear based in Brussels. When shares are held in book-entry form they are said to be either dematerialized or immobilized. In the case of a dematerialized share, there is no physical certificate, and the book entry is the sole means of record. However, in the case of immobilized shares, although a book entry is created, the original physical certificates are kept in safe custody and are not destroyed.
As can be surmised, book entry makes share transfers a lot easier. In the case of physical shares, when a sale is made, the seller's scrip would have to be canceled and one or more new scrips would have to be created. In the case of dematerialized trading, however, all that is required is a debit to the seller's account at the depository and a credit to the buyer's account.
TRACKING STOCK
Tracking stocks, also known as targeted stocks, are issued by many companies in addition to the usual equity shares. A tracking stock tracks the performance of a specific business unit or operating division of a company. Thus, the value of such stock is determined by the performance of this division rather than that of the company as a whole. If the unit or division does well, the tracking stock will rise in value, even though the company as a whole may have underperformed. The converse is also obviously true. Such stocks are traded as separate securities.
Unlike normal equity, tracking stocks usually have limited or no voting rights. If the stock were to pay dividends, the quantum of the dividend would depend on the financial performance of the concerned business unit or division.
REPORT CARDS
Companies issue quarterly and annual reports as mandated by the regulator. Such reports are intended to provide relevant information to the shareholders. Quarterly reports provide shareholders with a summary of the company's performance over the preceding three months. The reports often contain the firm's balance sheet as at the end of the quarter and an income statement for the same period. A copy has to be filed with the market regulator. In the United States, quarterly reports which are filed with the Securities and Exchange Commission (SEC) are called 10Q reports. In addition, at the end of every financial year, US-based companies are required to file an annual report with the SEC called the 10K report.
TYPES OF STOCKS
Most stocks are classified as either growth stocks or cyclical stocks. A cyclical stock is one whose fortunes rise and fall in tandem with the business cycle; that is, the stock price rises during an economic boom and falls during a recession. While this is a feature to some extent of all traded stocks, cyclical stocks are characterized by extreme sensitivity to changes in the business cycle. Two examples of cyclical stocks are automobile stocks and stocks of real estate developers. The reason is that when the economy is on an upward trend, there is a tendency for people to invest in new cars and new houses. However, during a recession, investors tend to postpone the purchase of such durable assets.
The term growth stocks is used for the stocks of companies whose sales and earnings have grown faster than those of an average firm and can be reasonably expected to display a similar trend in the future. Investors tend to acquire such stocks in anticipation of capital appreciation. This is because while such firms do pay dividends periodically, they exhibit a marked tendency to retain profits in order to fuel further growth. Unlike cyclical stocks, the performance of such stocks depends more on the quality of the products and the capability of the management teams, and less on economy-wide factors. Stocks of food-and-beverage and pharmaceutical companies usually fall into this category.
Interest-sensitive Stocks
The performance of the equity markets is generally better when interest rates are low. There are two reasons for this. First, most businesses rely to a large extent on borrowed money. In a low interest environment, the financing costs for such firms will go down, and this has obvious implications for their profitability. Second, when rates are low, consumers are likely to borrow more to fund their purchases.
Interest-sensitive stocks are those whose performance is very closely linked to movements in interest rates. These include:
- Utility firms
- Banks
- Brokerage houses
- Insurance companies
RISK AND RETURN AND THE CONCEPT OF DIVERSIFICATION
Consider two securities whose returns are given by the probability distribution shown in Table 3.1.
The expected return is a probability weighted average of returns.
The expected return of asset A is:

Similarly the expected return of asset B is given by:
The variance is a probability-weighted average of squared deviations from the mean or the expected value. The variance of asset A's return is given by:

Similarly, the variance of asset B's return is given by:

The square root of the variance is known as the standard deviation. In this case ![]() and
and ![]() . The return, the expected return, and the standard deviation have the same unit of measure, in this case, percentage.
. The return, the expected return, and the standard deviation have the same unit of measure, in this case, percentage.
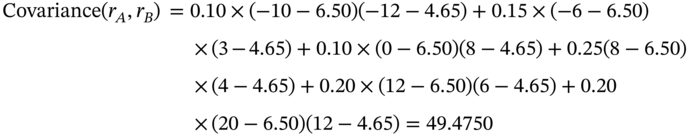
When we have more than two assets, we need to assess the way the assets move with respect to each other. For this purpose, we compute two statistics, covariance and correlation. The covariance is the probability weighted average of the product of the deviation from the mean for the two variables.
TABLE 3.1 Asset Returns
| Probability | Return on Asset A | Return on Asset B |
|---|---|---|
| 0.10 | −10% | −12% |
| 0.15 | −6% | 3% |
| 0.10 | 0% | 8% |
| 0.25 | 8% | 4% |
| 0.20 | 12% | 6% |
| 0.20 | 20% | 12% |
In this case:
The correlation is obtained by dividing the covariance by the product of the two standard deviations. In this case, the correlation is given by ![]() . The value of the correlation will always lie between –1.00 and + 1.00.
. The value of the correlation will always lie between –1.00 and + 1.00.
While studying stocks in isolation we use the variance as a measure of risk. However, as we have studied earlier no rational investor will hold a security in isolation, but will rather hold a well-diversified portfolio. The underlying rationale is that although there is no option but to tolerate exposure to economy-wide risk – what in finance is termed as systematic risk – it is possible to eliminate idiosyncratic or firm-specific risk by holding a well-diversified portfolio. Thus, the relevant measure of risk of an asset is not its variance but its covariance with other assets.
From the Capital Asset Pricing Model (CAPM), the relevant measure of risk in a portfolio context is Beta (β). Beta is defined as the covariance of an asset's return with the rate of return on the market portfolio, divided by the variance of the return on the market portfolio. The market portfolio is a value-weighted portfolio of all assets in the economy.
If we denote the expected return from asset i as E(ri); the expected return on the market portfolio as E(rm); and the riskless rate of interest as rf; then from the ![]() .
.
The expected return of a portfolio is a weighted average of the expected returns of the constituent assets. The variance of a portfolio's return is not, however, a weighted average of the variances of its components.
Consider three assets with returns r1, r2, and r3. Consider a portfolio with weights of w1, w2, and w3 in the three assets, where the weights obviously will sum to 1.00.
The expected portfolio return is given by: ![]()
The portfolio variance is given by:
σi,j is the covariance of the returns on assets i and j.
The beauty of the portfolio beta is that it too is a linear combination of the betas of the components.

PREFERRED SHARES
Preferred shares, like equity shares, are financial claims that confer ownership rights on the shareholders. The term preferred means that such shares have certain associated privileges. In other words, they get preference over equity shareholders in certain respects, as follows:
- Current dividends due on the preferred shares must be paid before any dividends for the year can be declared for the equity shareholders.
- If a company were to file for bankruptcy and be liquidated, the preferred shareholders have to be paid their dues before the balance, if any, can be paid to the equity shareholders. Thus, the pecking order in the event of bankruptcy is: creditors and bondholders, followed by preferred shareholders, followed by equity shareholders.
In general, preferred shares do not carry voting rights. In practice such shareholders may be temporarily conferred with the right to vote if any dividends outstanding have not been paid.
Preferred stocks usually carry a fixed rate of dividend, although there is a type with variable dividends referred to as Adjustable Rate Preferreds (ARPs). The rate may be expressed either in dollar terms or as a percentage. For instance, the term $7.50 preferred denotes shares carrying a dividend of $7.50 per share. Another way of expressing the same is to describe the shares as 7.50% preferred stock, assuming that the par value is $100.
Thus, from the standpoint of income distribution, preferred shares are similar to debt securities in the sense that the rate of dividends is fixed and not a function of the profits earned during the year. Unlike bonds, however, preferred stocks represent ownership of the firm and the dividend is not a legal liability, which makes them similar to equity shares. Consequently, such securities have features of both debt and equity. As in the case of equity dividends, preferred dividends must be declared by the directors of the firm.
From the standpoint of capital appreciation, such shares can rise in value. But this is usually caused by declining interest rates in the economy, which leads to a lower required rate of return and is not due to the anticipation of enhanced profitability for the firm, which is the prime driver of equity share prices. Thus, the price of a preferred share is inversely related to the prevailing rate of interest, and consequently behaves like the price of fixed income securities such as bonds and debentures.
Preferred shares offer companies the opportunity to lock in a fixed yet flexible expense. That is, although a fixed dividend is payable on such stocks, like the coupon interest on a bond, the dividends can be deferred if financial pressures preclude the firm from paying them as scheduled. The flexibility from the standpoint of dividends makes such securities similar to equity shares, and can be critical in times of financial distress.
Just like bonds, preferred shares provide leverage to common stockholders. Leverage refers to the ability to magnify returns on equity by using fixed-income securities to partly fund the firm. In the event of higher than anticipated profits, the additional earnings accrue entirely to the equity holders, as the holders of bonds and preferred shares are eligible for fixed payouts. However, in this instance it must be reiterated that although debt securities carry a fixed rate of interest, the bondholders have a legal right to be paid interest and principal when such payments fall due. Consequently, unlike in the case of preferred shares, deferral of such payments is not an option for the firm, no matter how difficult the conditions facing a firm may be.
Callable Preferred Stock
Companies issuing preferred shares in an economic environment characterized by high interest rates need to offer a high rate of dividends to make them attractive to investors. At times management may be of the opinion that although it is imperative to offer a high dividend under present circumstances, the forecast for the future is such that interest rates are headed downwards. If so, the company could issue callable preferred stock. As the name suggests, such shares can be prematurely recalled or retired by the company at a predetermined price, unlike conventional or plain-vanilla preferred shares, which are non-callable.
The presence of a call provision benefits the issuing firm because it can recall the existing issue if rates were to decline, and reissue fresh shares carrying a lower rate of dividends. If rates were to decline, however, the existing shareholders will be extremely reluctant to part with the shares, as they are earning a higher rate of return. Thus, the call provision works in favor of the issuing firm and against the investors. To sweeten the deal, companies offer callable shares that cannot be recalled for the first few years. The presence of such a feature establishes an assured return for the shareholders for a specified period, while at the same time allowing the issuer to build in the call feature.
Convertible Preferred Shares
A conversion option offers another tool to the issuing firm to sweeten the issue of the preferred shares and lock in a lower rate of dividends. Assume that a company believes that although the current atmosphere is not conducive for issuing equity shares at an attractive price, its prospects are very bright in the medium to long term and thus its equity shares will likely appreciate in value. It has the option of issuing preferred shares with an option to convert subsequently into equity at a prespecified conversion ratio. If investors are convinced that the conversion option is likely to be beneficial, they may accept a lower rate of dividends on the preferred shares than they would otherwise.
Cumulative Preferred Shares
In the case of noncumulative preferred shares, if the issuing firm were to skip a dividend, then from the standpoint of the shareholder, the dividend lost is lost forever. If the preferred shares were to be cumulative in nature, however, all outstanding dividends, including the current dividend, must be paid before the management can contemplate declaring dividends for the equity shareholders. We will illustrate the difference between cumulative and noncumulative shares with the help of a simple example.
Adjustable-Rate Preferred Shares
In the case of such securities, the dividend rate is not fixed, but is subject to periodic revision based on a prespecified formula. For instance, the dividend rate may be specified as the T-bond rate plus a spread.
Participating Preferred Shares
Holders of such preferred shares may receive additional dividend payouts over and above what is fixed at the outset. The extra payments may be linked to the performance of the firm based on a predetermined formula, or may be based on the decision of the board of directors, or both. The presence of such a feature can enhance the value of the preferred shares. In practice, however, most preferred shares are nonparticipatory in nature.
DIVIDEND DISCOUNT MODELS
The value of an asset is the present value of all the cash flows that an investor expects to receive from it. Consequently, the value of a financial asset is a function of
- The size of the cash flows
- The timing of the cash flows
- The risk of the cash flows
The magnitude of the cash flow determines the numerator in the pricing equation. The timing of the cash flow is crucial because, as we are aware, money has time value and consequently it matters not only how much we get, but also when we get it. The risk of the cash flows has implications for the discount rate that constitutes the denominator in the pricing equation. For a given cash flow, the greater the risk associated with it, the larger will be the rate at which it is discounted, and consequently the smaller will be the present value.
When it comes to the valuation of a stock, the first question that we need to ask is what are the cash flows for a person who is contemplating the acquisition of a share? Irrespective of his planning horizon, an investor will obviously receive a dividend for each period that he chooses to hold the stock.4 Second, at the end of his investment horizon, he will have an inflow on account of the sale of the stock. In practice this will be tantamount to either a capital gain or a capital loss.
A GENERAL VALUATION MODEL
We will use the following symbols. Additional variables will be defined as we go along.
- P0 ≡ Price of the stock at the outset
- dt ≡ Expected dividend per share at the end of period t
- Pt ≡ Expected price of the stock at the end of period t
- r ≡ Required rate of return for the asset class to which the stock belongs
Let us first take the case of an investor who plans to hold the stock for one period. Obviously
If we assume that the person who buys the stock after one period also has a one-period horizon, then
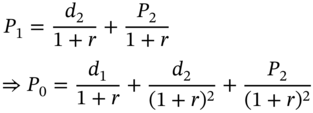
By extending the logic, we arrive at the conclusion that:
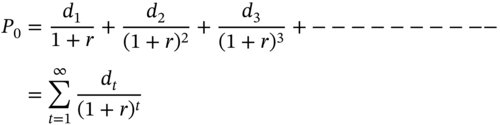
From this expression, we conclude that the stock price is the present value of an infinite stream of expected dividends.
THE CONSTANT GROWTH MODEL
In practice, no one can forecast an infinite stream of dividends, hence we need to make an assumption about how the dividends are expected to evolve over time. The simplest approach is to assume that dividends grow at a constant rate year after year.
Let us assume that dividends grow at a constant rate of g% per annum, and that the last declared dividend was d0. The current price can then be expressed as
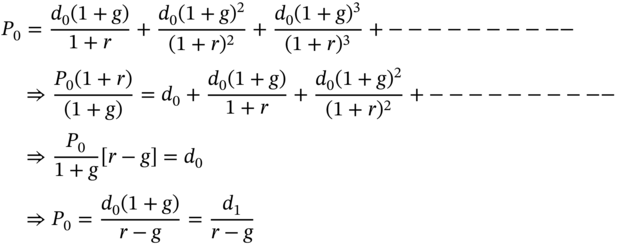
This is called the constant growth model or the Gordon growth model. Obviously in order for the cash flow stream to converge, the required rate of return must be higher than the assumed constant growth rate.
As per this model, ![]() . Thus, it predicts that the stock price will grow at a constant rate equal to the growth rate of dividends.
. Thus, it predicts that the stock price will grow at a constant rate equal to the growth rate of dividends.
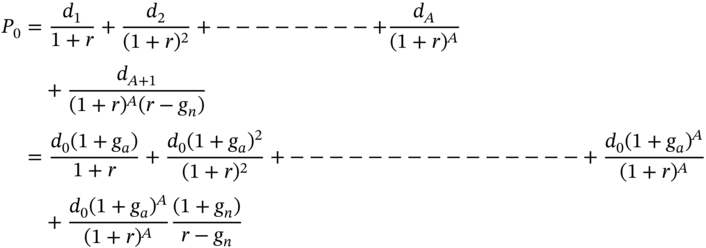
THE TWO-STAGE MODEL
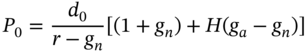
The constant growth model assumes a growth rate that stays constant forever. One way of building in a touch of realism is to assume that the stock will display a high growth rate of ga% per annum for the first A years, and that the growth rate will then settle down to a more modest level of gn% that will last forever. In other words, at the end of a high-growth period, the stock is similar to one that pays dividends growing at a constant rate. The price of the stock under these assumptions may be then determined as follows.

THE THREE-STAGE MODEL
A major shortcoming of the two-stage model is that the growth rate suddenly declines at the end of the initial high-growth phase. A more plausible assumption would be that the growth rate gradually declines after the high-growth phase until it reaches its long-run value, and this is precisely what the three-stage model does. It avoids a discrete jump in the growth rate by postulating that dividends grow at a high rate during an initial period, and that the growth rate then declines linearly year after year during an intermediate phase, until it reaches the long-run value, where it remains stable thereafter. We will denote the duration of the high-growth phase as A years, and the duration of the declining growth phase as B − A years. The model may then be stated as:
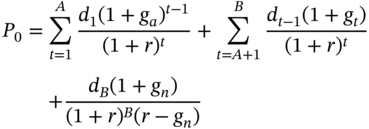
where
during the period ![]()
THE H MODEL
The H model was developed as an alternative to the three-stage model. In this model, growth begins at a high rate of ga% per annum. Unlike the earlier case, however, there is no initial high-growth period of A years. Instead, the growth rate starts declining linearly from the outset over a period of 2H years until it reaches a value of gn% per annum. Thereafter, the growth rate remains constant at the long-run value. The value of the share as per this model is given by
STOCK MARKET INDICES
A stock market index is constructed by considering the prices, or the market capitalization, of a predefined basket of securities. The objective of constructing an index is to enable us to track the performance of the securities market. In practice, we cannot meaningfully assess the market by looking at a vector of asset prices or returns. We need one number that will enable us to gauge or track the performance of the market. This explains the faith of the securities industry in a tracking index such as the DOW. An index may be constructed to represent an entire market or a market segment. It is important to select the constituent assets such that they are representative of the market or market segment as the case may be.
PRICE-WEIGHTED INDICES
One way of constructing a market index is by considering only the prices of the constituent stocks. The first step in the construction of an index is the decision regarding the number of securities to be included, and the selection of the specific securities. In the case of a price-weighted index, the current prices of all the component stocks are added up and divided by a number known as the divisor.
On the base date, or the date on which the index is being computed for the first time, the divisor can be set equal to any arbitrary value. A very logical way of setting the initial value of the divisor is by setting it equal to the number of stocks chosen for inclusion in the index. In practice, the divisor will be chosen such that the starting value of the index is equal to a nice round number such as 100. Hence, if the aggregate of stock prices on the base date is 25,215, the divisor will be chosen as 252.15 so that the starting value of the index is 100.
The divisor does not have to be adjusted on a day-to-day basis; however, whenever there is a corporate action such as a split/reverse split, a stock dividend, or a rights issue, the divisor will be adjusted as described later. An adjustment is also required when there is a change in the composition of the index, that is, one or more stocks are substituted.
Let us assume that we are standing at the end of day t, and the closing price of the ith stock on the day is Pi,t. The index level It is given by
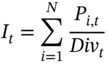
where Divt is the applicable value of the divisor for the day, and N is the number of stocks comprising the index.
Changing the Divisor
The divisor has to be adjusted if one or more of the following corporate actions were to occur.
- A split or a reverse split in one or more of the constituent stocks.
- A rights issue if the issue is at a discount to the prevailing market price.
- A stock dividend on one or more of the constituent stocks.
- A change of composition, that is, a replacement of an existing stock(s) by a new stock(s).
We will now illustrate the mechanics of adjusting the divisor by considering a situation where one of the constituent stocks undergoes a split.
We will assume that Coca-Cola undergoes a 3:1 split at the end of the base date. The prices of the constituent stocks at the end of the following day are assumed to be as shown in Table 3.8.
TABLE 3.8 Prices of the Constituent Stocks on the Following Day, Assuming a Stock Split in Coca-Cola
| Stock | Price |
|---|---|
| 3M | 85 |
| American Express | 60 |
| Coca-Cola | 16 |
| IBM | 85 |
| Merck | 40 |
| Total | 286 |
When we compare Table 3.8 with Table 3.7 we find that all the other stocks have the same value at the end of the next day as before, except for Coca-Cola, whose value is one-third of the value it would have had in the absence of the split.
Let us first compute the index without making an adjustment to the divisor. We will get an index value of 286/5 = 57.20, and will conclude that the market has gone down as compared to the base date. However, obviously this is an erroneous deduction, for every stock including Coca-Cola has risen in value as compared to the base date. The perceived decline in the index is entirely due to our failure to take the split into account.
If the index has to continue to be an accurate barometer of the market, then clearly an adjustment needs to be made. The variable that needs to be adjusted is obviously the divisor. In practice we would proceed to adjust the divisor as follows. First, we would list the theoretical post-split values at the end of the day on which the split is declared. The split will affect only the price of the stock whose shares have been split. In this case, the theoretical post-split price of Coca-Cola will be one-third of its pre-split value of $45. This adjustment is reflected in Table 3.9.
TABLE 3.9 Theoretical Post-Split Stock Prices
| Stock | Price |
|---|---|
| 3M | 80 |
| American Express | 55 |
| Coca-Cola | 15 |
| IBM | 80 |
| Merck | 35 |
| Total | 265 |
The new divisor, DivN, should be such that the index value is the same, whether we use the pre-split prices and the old divisor or the post-split prices and the new divisor. In this case, 265/DivN should equal 59.00. The new divisor is therefore 4.4915. If we were to use this value of the divisor to compute the index level on the following day, we will get a value of 63.68, which is consistent with our earlier observation that the market has risen.
We will continue to use the new divisor until there is another corporate action. The adjustment procedure for a stock dividend is identical to that for a stock split as the two are mathematically equivalent. For instance, if a firm were to declare a stock dividend of 20%, it would be equivalent to a 6:5 split, and we would proceed to adjust the divisor accordingly.
Now we will illustrate the adjustment procedure in the event of a change in composition, with the help of an example. Assume that at the end of the day following the base date, Merck, which has a prevailing market price of $40, is replaced with General Electric, which has a price of $50. The index level prior to the change is 63.68 as computed earlier. The prices of the stocks contained in the reconstituted index will be as shown in Table 3.10.
The new divisor, DivN, should be such that ![]()
TABLE 3.10 Prices of the Component Stocks of the Reconstituted Index
| Stock | Price |
|---|---|
| 3M | 85 |
| American Express | 60 |
| Coca-Cola | 16 |
| IBM | 85 |
| General Electric | 50 |
| Total | 296 |
THE IMPORTANCE OF PRICE
A feature of a price-weighted index, which finance theorists opine is one of its weaknesses, is that higher priced stocks tend to have a greater impact on the index level than lower priced components. Let us take the data given in Table 3.11 for our five- stock index on a particular day. Assume that the divisor is 5.0.
The index level is 310/5 = 62.00.
Consider two possible situations for the following day, as depicted in Table 3.12. In Case A, IBM's price has gone up by 20%, whereas in Case B, Merck's price has gone up by 20%.
In the first case the index value is 65.60, which represents an increase of 5.81% as compared to the previous day. However, in the second case the index value is 63.20, which represents an increase of only 1.94% as compared to the previous day. Quite obviously, a change of 20% in the price of IBM, which is a high-priced stock, has had a greater impact than a similar change in the price of Merck, which is priced considerably lower.
TABLE 3.11 Prices of the Constituent Stocks on a Given Day
| Stock | Price |
|---|---|
| 3M | 85 |
| American Express | 60 |
| Coca-Cola | 45 |
| IBM | 90 |
| Merck | 30 |
| Total | 310 |
TABLE 3.12 Prices on the Following Day: Two Different Scenarios
| Case A Price | Case B Price | |
|---|---|---|
| 3M | 85 | 85 |
| American Express | 60 | 60 |
| Coca-Cola | 45 | 45 |
| IBM | 108 | 90 |
| Merck | 30 | 36 |
| Total | 328 | 316 |
In finance, the importance accorded to a company is based on its market capitalization and not on its price. A model like the Capital Asset Pricing Model is consistent with this viewpoint, for it defines the market portfolio as a market capitalization–weighted portfolio of all assets. Thus, a price-weighted index can in a sense be construed as a less than perfect barometer of the stock market.
VALUE-WEIGHTED INDICES
A value-weighted index is theoretically more sound, for it takes into consideration the market capitalization of a component stock and not merely its price.
Let us assume that we are standing on day t, and that the starting or base date of the index is day b. We will use Pi,t and Pi,b to denote the market prices of the ith stock on days t and b respectively, and Qi,t and Qi,b to denote the number of shares outstanding on those two days.
On the base date, the index can be assigned any arbitrary value. We will assign a value of 100. The level of the index on day t is then defined as
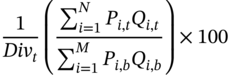
Divt represents the value of the divisor on day t. In the case of a value-weighted index, the divisor is always assigned a value of 1.0 on the base date. Subsequently it will be adjusted as and when required. However, unlike in the case of the divisors used for price-weighted indexes, the divisor need not be adjusted for a stock split or a stock dividend, as we shall shortly see.
Changing the Divisor
In the case of a value-weighted index, there is no need to adjust the divisor if one of the components of the index were to undergo a split or a reverse split, or if a firm that is present in the index were to declare a stock dividend. This is because, from a theoretical standpoint, such corporate actions are value neutral and do not have any impact on the market capitalization. However, if there is a rights issue, whether at the prevailing market price or at a discount, a follow-on public offering, or a share buyback, the divisor will have to be adjusted. This is because all these corporate actions will lead to a change in the market capitalization of the security.
In the case of a stock split or a stock dividend the share price will decline, whereas in the case of a reverse split the share price will rise. In the first two cases the number of shares outstanding will rise, whereas in the last case it will decline. The changes in the number of shares outstanding will exactly offset the price change such that there is no impact on the market capitalization. We will now give an illustration of this phenomenon.
CHANGING THE BASE PERIOD CAPITALIZATION
In the event of a change in its composition, one of the ways of handling the situation, as we have just seen, is by changing the divisor. In such cases the base period market capitalization will always stay frozen at its initial level.
A different but equivalent approach, however, is adopted in the case of certain value-weighted indices. In such cases, the divisor is not recomputed in the event of a change in composition. In other words it is always maintained at its initial level of 1.00. What is done in practice in such cases is that the base period market capitalization is adjusted to reflect the change in the composition of the index.
Let us take the data depicted in Table 3.15. If we denote the modified base period capitalization by BPCN, then it should be such that
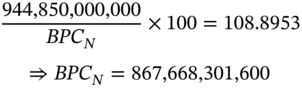
For all subsequent calculations, the new value will be used for the base period capitalization until there is another change in the composition of the index. Mathematically the two approaches are equivalent because the denominator in the index computation formula consists of the product of the divisor and the base period market capitalization. Thus, we can keep either one constant and adjust the other.
EQUALLY WEIGHTED INDICES
An equally weighted index offers yet another alternative for tracking the performance of a market. In the case of such indices, as in the case of price-weighted indices, we consider only the prices of the component stocks.
Let us look at an index consisting of N component stocks. The value of the index on day t is defined as
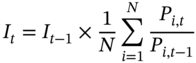
The ratio of the prices, Pi,t/Pi,t − 1 may be expressed as (1 + ri,t) where ri,t is the arithmetic rate of return on the ith stock between day t and day t − 1. Therefore
where ![]() is the arithmetic average of the returns on all the component stocks between day t − 1 and day t. Thus
is the arithmetic average of the returns on all the component stocks between day t − 1 and day t. Thus
In other words, the value of the index on a particular day is its value at the point in time at which it was previously computed, multiplied by one plus the average arithmetic rate of return on all the stocks constituting the index, for the period.
TRACKING PORTFOLIOS
In practice, investors often seek to hold a basket of securities that imitates or mirrors the behavior of a stock market index. The method of forming such a tracking or mimicking portfolio would obviously depend on the method adopted to compute the index being tracked.
Imitating an equally weighted index is fairly simple. The investor has to put an equal fraction of his wealth in all the assets that constitute the index. Consider an investor with an initial wealth of $W who is seeking to track an index consisting of N stocks. Obviously the investor will have to invest an amount of W/N in each security.
Tracking a price-weighted index too is fairly straightforward. An investor who seeks to do so must acquire an equal number of shares of each of the companies present in the index.
Finally, we come to the task of forming a portfolio to track a value-weighted index. In practice this is the most complex task because to imitate such an index, we must invest a fraction of our wealth in each asset that is equal to the ratio of the market capitalization of that particular asset to the total market capitalization of all the assets that constitute the index.
Rebalancing a Tracking Portfolio
Once we set up a tracking portfolio it does not mean that we can sit back and watch the portfolio automatically track the index in question. In the case of every index, irrespective of its mode of computation, there will arise circumstances when the tracking portfolio will have to be rebalanced.
Equally Weighted Portfolios
In practice, an equally weighted tracking portfolio needs to be rebalanced very frequently, virtually on a daily basis. This is because – unless it were to be the case that none of the component stocks has undergone a change in price from one day to the next – an index that is equally weighted on a particular day will no longer be equally weighted on the following day. We will now give a detailed example as to why an equally weighted portfolio will require rebalancing with the sheer passage of time.
Take the case of an investor who has a corpus of $600,000 and decides to form an equally weighted portfolio consisting of the four stocks whose prices are shown in Table 3.16.
Because the investor has $600,000, we will have to invest $150,000 in each of the four stocks: 3,000 shares of General Electric; 1,500 shares of 3M; 3,750 shares of Merck; and 1,200 shares of IBM. If we assume that the index value is 100, then the portfolio is worth 6,000 times the index.
TABLE 3.16 Prices of the Stocks Constituting an Equally Weighted Index at the Time of Formation of the Portfolio
| Stock | Price |
|---|---|
| General Electric | 50 |
| 3M | 100 |
| Merck | 40 |
| IBM | 125 |
Let us assume that on the next day, the prices of the companies are as shown in Table 3.17.
The amounts invested in the stocks will be $120,000, $187,500, $187,500, and $120,000 respectively. The total portfolio value is $615,000, of which 19.51% each is in General Electric and IBM, and 30.49% each is in 3M and Merck.
Quite obviously the portfolio is no longer equally weighted, in which case 25% of the investor's wealth would be in each asset. If the weights have to be reset to 0.25 each, then the investor would rebalance by selling off a part of the holdings in 3M and Merck and investing the proceeds in General Electric and IBM.
In practice we would proceed as follows. The total value of the portfolio is $615,000, which means that the investor needs to have $153,750 in each stock. To accomplish this, the investor would buy 843.75 shares of General Electric and 337.50 shares of IBM, and sell 270 shares of 3M and 675 shares of Merck.
The inflow on account of what is being sold is ![]() .
.
The outflow on account of what is being bought is ![]() .
.
Thus we have demonstrated the investor can rebalance at zero net cost. It can be verified that the amount invested in each company is $153,750.
The new index level is ![]() .
.
Therefore the new value of the index is 102.50. The total value of the portfolio is $615,000, which is 6,000 times the value of the index. Hence the portfolio continues to mimic the index.
TABLE 3.17 Prices of the Stocks Constituting an Equally Weighted Index on the Following Day
| Stock | Price |
|---|---|
| General Electric | 40 |
| 3M | 125 |
| Merck | 50 |
| IBM | 100 |
Price-weighted Portfolios
Now let us turn our attention to a portfolio that is constructed to track a price-weighted stock market index. Such a portfolio has to be rebalanced whenever there is a split or a reverse split, a stock dividend, a rights issue at a discount, or a change in the index composition. In other words, whenever circumstances warrant a change in the divisor used to compute the index, we need to rebalance the tracking portfolio.
Let us consider a price-weighted index consisting of the four stocks depicted in Table 3.16. Assume that the divisor is equal to 4.0, which would mean that the index level is
Let us form a tracking portfolio by buying 2,000 shares of each of the constituent stocks. The value of our tracking portfolio will be:
Hence our portfolio is worth 8,000 times the index.
Consider a situation where 3M undergoes a 2:1 split, which means that its post-split theoretical value will be $50. The new divisor, DivN, should be such that
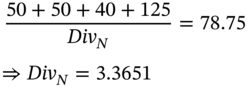
In order to ensure that our portfolio continues to mimic the index, we need to rebalance in such a way that our portfolio value remains unchanged. Let the number of shares of each stock held before the split be denoted by NO, and the number of shares required after the split by NN. If the value of our tracking portfolio is to remain unchanged, it should be the case that

In our example, the number of shares of each stock required after the split is
If we assume that fractional shares can be bought and sold, we will have to buy 377.3439 shares of General Electric, Merck, and IBM, and sell 1,622.6561 shares of 3M.5
The inflow on account of what is sold is ![]()
The outflow on account of what is being bought is ![]() .
.
Once again, if we ignore transactions costs, we can rebalance at zero net cost. The difference that we get between the inflow and the outflow is entirely due to rounding errors.
Rights Issues
Let us now consider the case of rebalancing a price-weighted portfolio to factor in a rights issue. Consider the four stocks given in Table 3.17. We will assume that the divisor at the outset is 4.0 and the index level is 78.75. To form a tracking portfolio the investor has acquired 2,000 shares of each company.
Assume that Merck announces a 1:10 rights issue at a price of $39 per share. The ex-rights price will decline from 50 to 49, and the aggregate value of the four stocks will decline from 315 to 314. The new number of shares required to track the price-weighted index is given by
There are two possibilities. The investor may renounce those rights. Because the investor owns 2,000 shares, they have the right to acquire 200 shares, and the right to acquire a share is worth $10. Thus, the investor would receive $2,000 if renouncing the rights. The outflow on account of the extra shares acquired is:
Thus, the inflow from the renounced rights is exactly equal to the outflow. The other possibility is that the investor acquires 200 shares of Merck by paying $7,800, keeping 6.3694 shares, and selling the balance at $49 each. The ![]() . This will be exactly sufficient to acquire 6.3694 shares of each of the other three companies.
. This will be exactly sufficient to acquire 6.3694 shares of each of the other three companies.
Value-weighted Portfolios
Consider four stocks, whose prices and number of shares outstanding are shown in Table 3.18.
The total market capitalization is $20,000,000. Assume that the base period market capitalization is $16,000,000 and that the current divisor is 1. The index level is therefore 125.00.
TABLE 3.18 Components of a Value-weighted Index
| Stock | Price (P) | # of Shares(Q) | Market Capitalization |
|---|---|---|---|
| MRF | 20 | 200,000 | 4,000,000 |
| J.K. Tyres | 80 | 50,000 | 4,000,000 |
| Apollo Tyres | 50 | 200,000 | 10,000,000 |
| Viking Tyres | 20 | 100,000 | 2,000,000 |
Let us consider the case of investors who have an endowment of $500,000, and who wish to create a portfolio to track the index. In order for their portfolio to mimic the index, they must have
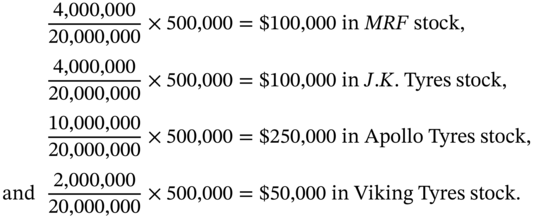
Consequently, the investors must buy 5,000 shares of MRF, 1,250 shares of J.K. Tyres, 5,000 shares of Apollo Tyres, and 2,500 shares of Viking Tyres. In general, the number of shares of the ith stock is given by
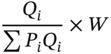
where W is the initial wealth. The total portfolio value in this case is 4,000 times the index value of 125.00.
Now assume that Viking Tyres is replaced by Ceat, which has a share price of $70 and has 100,000 shares outstanding. The total market capitalization of the four components of the index will now be $25,000,000. The divisor will have to be adjusted in such a way that the index level remains unchanged. That is
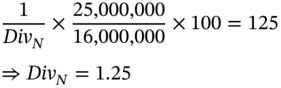
In order for the portfolio to remain value weighted, the investor must have
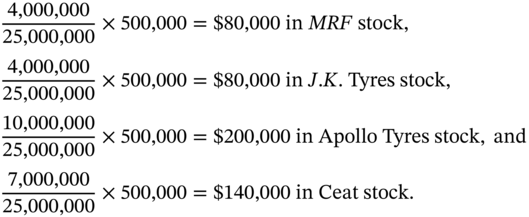
Thus, the investor requires 4,000 shares of MRF, 1,000 shares of J.K, 4,000 shares of Apollo, and 2,000 shares of Ceat. This means that he will have to sell 1,000 shares of MRF, 250 shares of J.K, 1,000 shares of Apollo, and 2,500 shares of Viking. All the shares of Viking have to be sold because it is no longer a part of the index. He will also have to buy 2,000 shares of Ceat. The number of shares of the ith stock is once again given by


Thus, if we ignore transactions costs, then once again we can rebalance at zero net cost. The portfolio value after rebalancing will be $500,000, which is 4,000 times the index level of 62.50.
HANDLING A RIGHTS ISSUE
Consider the data given in Table 3.18. Assume that Apollo Tyres announces a 1:4 rights issue at a price of $25 per share. The ex-rights price will be:

The price and market capitalization data, post rights, is as shown in Table 3.19.
The aggregate market capitalization is 21.25MM dollars.
Let us first assume the investors renounce their rights. They will get $20 for the right to acquire a share. Because they have 5,000 shares of Apollo, they have the right to buy 1,250 shares.
The value of the portfolio after the rights issue is:
The inflow from the sale of rights is:
Thus the total capital available is $500,000.
TABLE 3.19 Components of a Value-weighted Index
| Stock | Price (P) | # of Shares(Q) | Market Capitalization |
|---|---|---|---|
| MRF | 20 | 200,000 | 4,000,000 |
| J.K. Tyres | 80 | 50,000 | 4,000,000 |
| Apollo Tyres | 45 | 250,000 | 11,250,000 |
| Viking Tyres | 20 | 100,000 | 2,000,000 |
The amount of capital required to be invested in each constituent firm after the rights issue can be computed as follows:
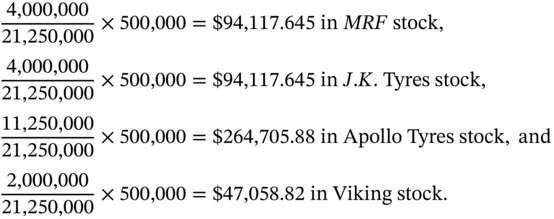
The total investment is $500,000.
The outflow on account of what is being bought is:
The inflow from the three firms whose shares are being sold is:

Thus, the portfolio can be rebalanced at zero net cost.
What if the investors were to exercise their rights and buy 1,250 shares at $25 each? The amount of funds required is $31,250. The value of the shares will be ![]() .
.
The investment required in Apollo Tyres is $264,705.88. Thus ![]() will be released when the surplus shares are sold.
will be released when the surplus shares are sold.
The inflow from the other three firms whose shares are being sold is:

![]() , which is exactly equal to the amount required to subscribe to the rights issue.
, which is exactly equal to the amount required to subscribe to the rights issue.
THE FREE-FLOATING METHODOLOGY
The traditional method of computing a value-weighted index entails the use of the market capitalization of the constituent stocks, where the market capitalization is defined as the price of the share multiplied by the total number of shares issued by the company. In recent years, this approach has come under criticism from those who propound that the appropriate number of shares used to compute the market capitalization should be those that are freely floating. The free-floating methodology entails the calculation of the market capitalization of a stock as the share price multiplied by the number of shares that are freely available for trading in the market.
Obviously, for a widely held firm, the free-floating market capitalization will be high and will be close to or even equal to its total market value. For closely held companies, however, the free-floating market capitalization may be considerably less than the full market value. One of the arguments advanced against using the full market capitalization to compute the index value is that those index constituents that have a relatively smaller percentage of shares available for trading may be vulnerable to sharp price fluctuations. Thus not only will a price move in such an illiquid stock cause the index to move sharply, but such stocks will also be vulnerable to manipulation by speculators. Therefore, defining the index on the basis of free-floating shares can help ensure that the impact of underlying market movements is reflected in a better fashion.
WELL-KNOWN GLOBAL INDICES
The most famous index is undoubtedly the Dow Jones Industrial Average (DJIA), popularly known as the Dow. It is a price-weighted average of 30 stocks.
The Nikkei Index, which is a barometer of the Japanese stock market, is also price weighted and includes 225 large Japanese companies. The Standard & Poor's 500 Index (S&P 500) and the Nasdaq 100 index are both value weighted.
MARGIN TRADING AND SHORT-SELLING
The term buying stock on margin refers to a process of investment where the investor funds the acquisition of the stock by borrowing a part of the required funds from the broker. As can be surmised, the ability to raise a loan to fund a share purchase will enable investors to acquire more shares than what their own funds will permit.
TERMINOLOGY
The minimum percentage of the securities' market value that has to be deposited by the customer is called the margin rate. The difference between the market value of the securities and the minimum amount that has to be deposited by the customer is called the loan value. Thus, the loan value represents the maximum amount that can be borrowed from the broker. The loan value expressed as a fraction of the market value is referred to as the loan rate. Obviously, the margin rate, which is the minimum that the investor has to deposit, and the loan rate, which is the maximum that the investor can borrow, will therefore always be equal to 100%. The actual amount that is borrowed from the broker is called the broker's loan or is referred to as a debit balance. The term debit balance indicates that investors are indebted to the broker, and consequently owe the broker money. The difference between the market value and the debit balance is called the owner's equity. The owner's equity represents the amount that the investor will be entitled to if the securities are immediately liquidated and the broker is repaid the amount due.
The position may be depicted in a T-account format as shown in Figure 3.1.
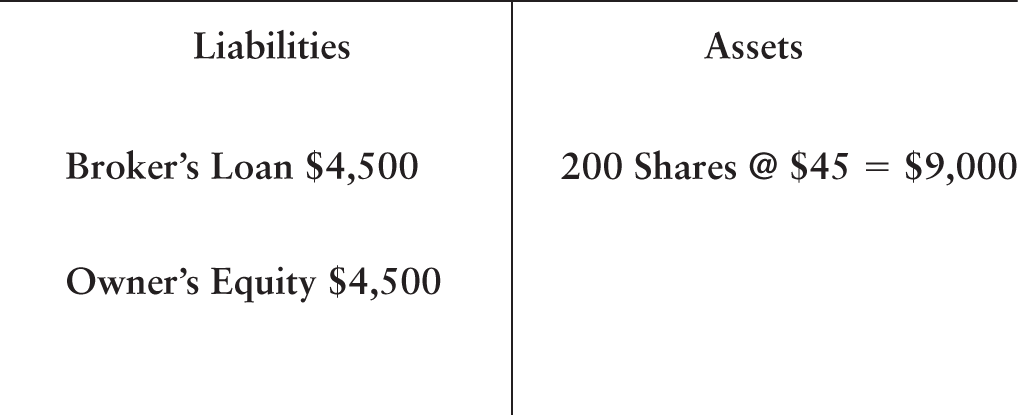
Now let us assume that the share price increases to $50. The market value of the securities will be $10,000. The debit balance will stay at $4,500 as nothing further has been borrowed. If the position is immediately liquidated, the investors will be eligible to withdraw $5,500. Thus, the owner's equity is $5,500. As per the requirement, the owner's equity must be at least 50% of the market value, which in this case is $5,000. In this case we say that the investors have excess equity of $500. There is another way of perceiving the excess equity. The loan value of the position is 50% of 10,000, which amounts to $5,000. However, the debit balance is only $4,500. The difference between the loan value and the debit balance will also be equal to the excess.
What can the investors do with the excess? They can either withdraw it as cash or use it to acquire more securities. If the investors were to withdraw the excess, the funds will be provided by the broker. When that happens, the debit balance will increase by the amount and the owner's equity will decline by an equivalent amount. In this example the owner's equity will decline to $5,000 and the debit balance will increase to $5,000. This is consistent with the stipulation that a maximum of 50% of the market value of the securities can be borrowed. The situation is depicted in Figure 3.2.
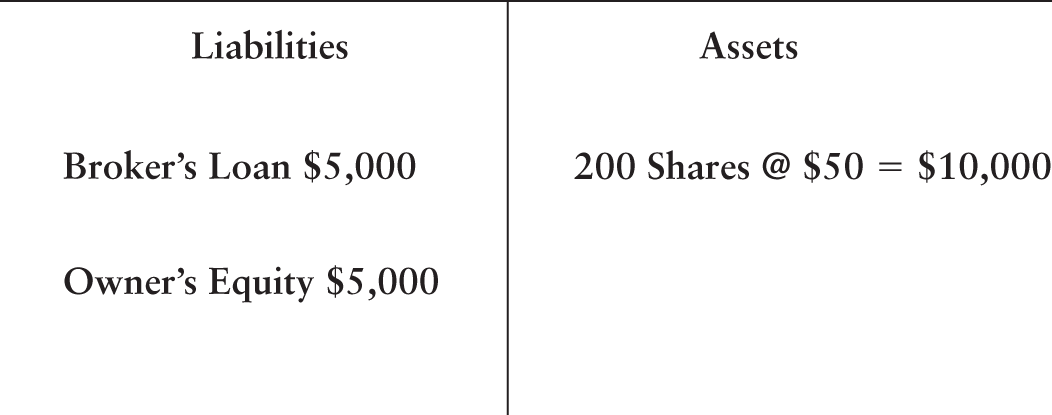
What if the investors were to desire to use their excess to acquire more securities? The excess equity of $500 can support an acquisition of $1,000 worth of shares, because the requirement is that at least 50% of the value of the acquisition must be the owner's contribution. In this case, the broker will advance $1,000 to enable the investors to purchase the securities. The market value of the securities will be $11,000. The owner's equity will remain at $5,500 and the debit balance will increase to $5,500. Consequently the requirement that not more than 50% of the value of the securities can be borrowed has been complied with. Figure 3.3 illustrates this situation.

Thus, in this case an excess equity of $500 represents the ability to buy additional securities worth $1,000. This is referred to as the buying power of the excess equity. The buying power of a position may be defined as: Buying Power = Excess Equity/Margin Rate.
We will first analyze a pure cash trade, with the help of different scenarios for the price at the end of a week, which we will assume is Martin's investment horizon.
CASE A: THE MARKET RISES
The market price of ABC at the time of disposal is $62. The 100 shares that Martin owns will therefore be worth $6,200. The return on investment is:
CASE B: THE MARKET DECLINES
The market price of ABC a week hence is $42. The shares are obviously worth only $4,200 and hence the rate of return is:
Let us now consider the situation where Martin chooses to exert the full borrowing power of the capital at his disposal and indulge in margin trading. With $10,000 in hand, he can acquire 200 shares of ABC. Let us examine the consequences from the standpoint of the rate of return.
CASE A: THE MARKET RISES
Assume that the share price rises to $62. The value of 200 shares will be $12,400. After returning the amount borrowed from the broker, Martin will be left with $7,400. The rate of return is:
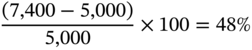
CASE B: THE MARKET DECLINES
But what if the price was to decline to $42 per share? The value of 200 shares will be $8,400. After returning the amount borrowed, Martin will be left with $3,400. The rate of return is consequently:
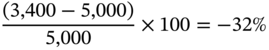
As can be seen, trading on the margin has doubled the rate of return. This is true irrespective of whether the trade has led to a profit or to a loss.
INTEREST AND COMMISSIONS
In our preceding illustration, we ignored two major real-life issues. The first is that in practice the broker will charge interest on the amount borrowed by Martin. The second factor to be considered is that in practice investors will have to pay commissions twice: when acquiring the shares and when disposing of them. When these facets are factored in, the result will be a reduction in the percentage of profit in the event of a rise in the market price, and an increase in the percentage of loss in the event of an adverse price change.
Margin interest income is a significant source of revenue for brokers and dealers. The normal practice is for the broker to obtain a loan from a bank, by pledging the securities as collateral. The rate charged by commercial banks for such loans is called the broker call money rate, which is usually about 1% less than the prime rate, which is the rate at which a commercial bank lends to its best clients. The reason why the loan rates are lower for such transactions is that the borrower, in this case the broker, is providing very liquid or marketable securities. The broker will usually add a mark-up to the call money rate before extending a loan to a client. In practice, the lowest rates ordinarily go to clients who have the largest debit balances or, in other words, bigger borrowers pay less. The level of trading undertaken by the borrower is also a factor while determining the rate of interest charged by the broker. A customer with a very active account may be able to negotiate a lower rate of interest, because the additional income generated by way of commissions will more than compensate the broker for the concession made by way of a lower rate of interest.
Let us assume that the broker charges Martin an interest of 10% per annum on the amount borrowed. We will reexamine the consequences of a price increase and a price decline, assuming that the account is kept open for a period of three months.
CASE A: THE MARKET RISES
Once again consider a situation where the terminal stock price is $62. The 200 shares bought by Martin are worth $12,400. As he has borrowed $5,000, he needs to repay $5,125, which represents the repayment of principal plus interest for three months. The rate of return is:
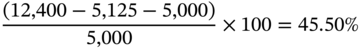
Thus the assumption of an interest payment, which is consistent with a real-life transaction, leads to a reduction of 2.50% in returns.
CASE B: THE MARKET DECLINES
Now consider a situation where the terminal stock price is $42. After repaying the lender, the customer will be left with $3,275. The rate of return is:

Compared to the earlier case, our loss has been increased by 2.50%. Thus, interest charges mitigate profits and magnify losses.
Commissions have a similar impact on the rate of return obtained by the investor, that is, they mitigate profits and magnify losses.
MAINTENANCE MARGIN
As we have seen, if the stock price were to rise, it will lead to an increase in the owner's equity. The investor can either withdraw the excess equity as cash, or use it to acquire more shares. However, it is not necessary that the stock price should always rise. In practice, the price can always decline and we need to consider the consequences of the same. Losses will lead to a reduction in the owner's equity, and sustained losses can lead to a significant reduction in the equity level. To protect themselves, brokers will fix a threshold level called the maintenance margin level. If, due to adverse market movements, the account were to become under-margined, the investor may eventually receive a notice for additional margin from the broker, which is referred to as a margin call. If the investor were to fail to respond to such a call, which in essence is a demand for additional collateral, the broker is at liberty to liquidate all or a part of the securities in the account.7 The objective of prescribing a maintenance margin level is obviously to protect the broker's investment.
Let us take the case of an investor who acquires 200 shares of ABC at $75 each, by borrowing $7,500. Assume that the broker has fixed a maintenance margin level of 25%. The issue is, how low will the price of the stock fall, before a margin call is triggered off? Let us denote this price by P. At this price the owner's equity must be exactly 25%. So, obviously it must be that:

At this point, the T-Account would look as shown in Figure 3.4.
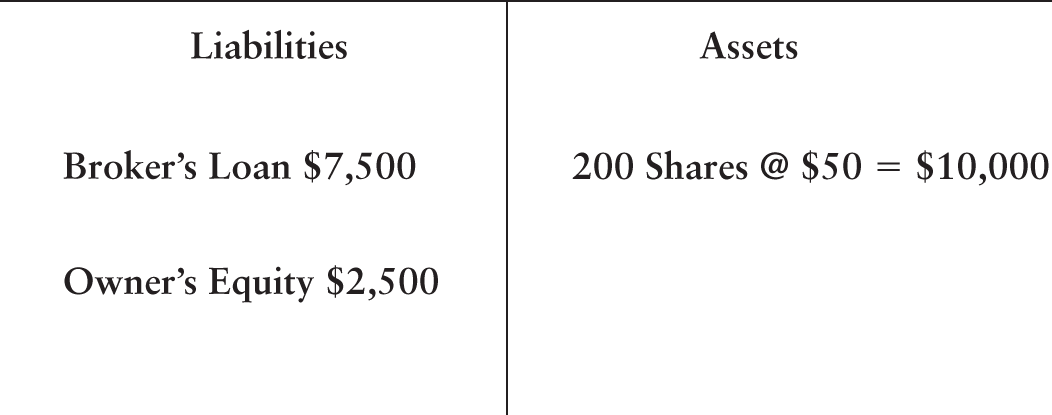
If the stock price were to decline below $50, a call would be issued demanding an immediate deposit of new funds or securities to raise the equity to a level higher than 25%. In practice a margin call must be met on demand.
SHORT-SELLING
Investors who anticipate a bull phase, or in other words expect the stock market to rise, will seek to acquire stocks in anticipation of being able to sell them subsequently at a higher price. The principle being followed is buy low and sell high. Some investors may decide to take additional risk by using leverage, which is tantamount to margin trading.
Short sellers have an opposite viewpoint regarding the market. They are bearish and anticipate a decline in the market. Their objective is therefore to sell high and buy low. Short-selling in practice requires such investors to sell stocks that they do not own. You may wonder how investors can sell something that they do not possess. The answer is they can always borrow shares from a third party and sell them. In practice short sellers borrow securities from brokers. Short-selling is also a form of margin trading, the difference being that margin trading entails the borrowing of cash while short-selling requires the borrowing of securities.
A broker obtains the right to borrow securities from a client by appropriately wording the margin agreement. Such a clause is known as a customer loan consent. Before executing a short sale transaction, the broker has to seek and receive an authorization from the stock loan department, stating that the security is indeed available for the purpose of the short sale. Security availability can change on a day-to-day basis. Consequently, in practice, short sale orders are accepted only as day orders. That is, they are valid only for the day on which they are placed. If such an order were to remain unexecuted at the end of the trading day on which it is placed, it would stand canceled automatically. A client who seeks to keep the order active on the following day would have to rebook the order.
When an investor borrows and sells a share, the proceeds will be credited to the investor's account. At some point in time, the shares will have to be purchased and returned to the broker. This is called covering the short position. If the price at this point of time is lower than the original purchase price, then the investor stands to make a gain. Otherwise, if the price has risen, the investor will have a loss.
In principle, traders have the freedom to keep the position open for as long as they desire. At times, however, the lenders of the shares may seek to call away the stock that they have lent. In such a situation, the broker will try and borrow the securities from a fresh source. However, if unable to do so, the broker will be left with no option but to request the investor to close out or cover the short position.
Let us analyze the transaction from the standpoint of the trader who lends the share. The investors or brokers who part with shares to facilitate the sale by the short seller do not actually sell the shares. They merely lend them to another party to facilitate a sale. Take a situation where a cash dividend is declared on the underlying stock during the period of the short sale. The firm will pay the dividend to the party who has acquired the shares from the short seller, because at any one point in time a share can have only one legal owner. The lender of the share, however would demand the payment of an equivalent amount. The lender has merely lent the shares, and should not consequently lose entitlement to the payout. Consequently, the short sellers have to compensate the lenders for such lost income from their personal funds. Similarly, if the stock were to undergo an n:1 split during the period of the short sale, the lender will be entitled to receive n shares when the position is closed, per share that was lent at the outset. There is one right, however, that is irretrievable from the standpoint of the lender. If there is a meeting of shareholders during the period of the short sale, the lender loses the right to vote, for this is one entitlement that the borrower of securities cannot compensate. It must be remembered that a short sale creates two long positions, the “real” long position held by the buyer who takes delivery of the stock from the short seller and a “phantom” long position that is held by the person who has lent the stock.
As we explained earlier, short-selling is also a form of margin trading, because the investor is borrowing shares from the broker. Consequently, rules similar to margin trading apply to short sales, and such transactions too are governed by the same regulations in the United States.
Traders who engage in margin trading must deposit at least 50% of the cost of the shares from their pocket. This margin is required because the market may subsequently decline, and brokers must have adequate assets to recover their loan. In the case of a short sale, the investor borrows a share and sells it. The investor is required to have enough funds to reacquire the stock subsequently in order to cover the position. Thus, the account must at all times have adequate funds to facilitate the reacquisition of the shares. Because the price may rise after the short sale, investors who are selling short must deposit additional funds over and above what they receive in the form of sale proceeds. As per regulations, a short seller must make the same deposit that would be required if the stock were to be purchased on margin. That is, the short seller must offer at least 50% of the sale proceeds as additional collateral. This deposit, plus the proceeds of the short sale, would show up as a credit balance in their account. We will illustrate this with the help of a numerical example.
The credit balance in a short account provides collateral for the shares which have been sold short. They are not free credit balances, in the sense that they cannot be removed from the account. So typically, they will not earn any interest for the short seller. Any interest earned will accrue to the brokerage firm. Consequently, stock loan departments of brokerage firms are usually very profitable. However, institutional clients may demand that the brokerage firm share the interest that it will earn on the credit balance. Such a payment by a brokerage firm is referred to as a short interest rebate.
MAINTENANCE OF A SHORT POSITION
A short position is inherently more risky than a long position. This is because the worst thing that can happen when one buys a security is that the securities can become totally worthless. Due to the limited liability feature, the price of a share has a lower bound of zero.
In the case of a short sale, however, what has been loaned is a stock. While stocks have a lower bound, they do not have an upper bound. In other words, there is no limit on how high the share price can rise. Since the short seller is required to acquire the stock at the prevailing market value, at the time of covering the short sale, the maximum possible loss, in principle, is infinite.
Brokers take this higher risk aspect of short sales into consideration by setting the maintenance margin requirement for such transactions at higher levels.
Let us assume that the maintenance level is 30%. How do we compute the corresponding trigger for a margin call? Assume that Nick has sold 100 shares of ABC at $65 and has deposited an initial margin of $3,250. Let the price corresponding to a 30% margin level be denoted by P. Therefore

SHORTING AGAINST THE BOX
This entails establishing a short position in a security that the investors already own. In other words, the investors have no intention of delivering the stock that they are holding, and instead seek to borrow the security to facilitate delivery. Why would a trader resort to such a course of action? Typically, traders go in for such a strategy to defer any unrealized capital gains for tax purposes while at the same continuing to protect the magnitude of the capital gain. We will illustrate this with the help of an example.
If we were to engage in a short sale, any change in the value of the existing long position would be exactly offset by an equal and opposite change in the value of the newly established short position. Consequently, the net result would be a freeze on the capital gain of $400. For instance, if the share price were to rise to $1,500 after six months, the capital gain on the long position would increase to $700; however, the short position would lead to a loss of $300. The net result would be an overall capital gain of $400.
THE RISK FACTOR
In general, over a medium- to long-term horizon, stock prices have a tendency to drift upwards. This is because even if the performance of the company were to remain stagnant, its share price should rise over a period of time to compensate owners for the effects of inflation. Thus, the long-run direction of the market is upwards. Short-selling represents an effort to profit from a falling market. Thus, it is tantamount to betting against the overall direction of the market.
Due to the limited liability feature, a long position entails finite losses and potentially infinite profits. Short sales, however, entail finite profits and infinite losses. Consequently, while profits are capped at 100%, potential losses cannot be capped.
In a rising market a situation could develop where a large number of short sellers attempt to close out their positions after witnessing a rapid price increase. This can in practice cause prices to quickly spiral upwards. This phenomenon is known as a short squeeze. Usually, the root cause of such an event is the availability of news relevant to the security. But, at times, a trader who notices a high short interest will attempt to induce a squeeze by placing a large buy order. If the corresponding price rise were to lead to the covering of positions by short sellers, the trader who placed the buy order may be able to exit the market with a handsome profit.
THE ECONOMIC ROLE OF SHORT SALES
Many market analysts have viewed short sales as a major cause of market downturns. However, short-selling undoubtedly contributes positively to the functioning of a free market system. It provides liquidity and drives down the prices of overvalued securities to realistic levels. If a security is perceived to be undervalued, traders will assume long positions to take advantage of the anticipated price rise. On the other hand, if a security were perceived as overvalued, the freedom to short sell is imperative to ensure that prices can be driven down to a fair or true value.
THE UPTICK RULE
A tick is the minimum price increment or variation observable in the market. In other words, it is the smallest amount by which two prices can differ. It is usually set by exchange regulations. In the United States, until the year 2000, the tick size was one-sixteenth of a dollar, or 6.25 cents. Now the system has been decimalized, and the tick size is 0.01 dollars, or 1 cent.
The minimum tick size on the Tokyo Stock Exchange is a function of the share price and is depicted in Table 3.20.
Traders classify prices by their relation to previous prices. The price is said to be on an uptick if the current price is higher than the last price, on a downtick if it is lower, and on a zero tick if it is the same. Zero tick prices are further classified depending on the last different price observed. A zero tick price is said to be on a zero downtick if the last different price observed was higher, and on a zero uptick if the last different price observed was lower. We will illustrate these concepts using an example, as shown in Table 3.21.
TABLE 3.20 Tick Sizes on the TSE
| Price | Tick Size |
|---|---|
| P ≤ 2000 yen | 1 yen |
| 2000 < P ≤ 3000 yen | 5 yen |
| 3000 < P ≤ 30,000 yen | 10 yen |
| 30,000 < P ≤ 50,000 yen | 50 yen |
| 50,000 < P ≤ 100,000 yen | 100 yen |
| 100,000 < P ≤ 1,000,000 yen | 1,000 yen |
| P > 1,000,000 yen | 10,000 yen |
TABLE 3.21 Illustration of Uptick, Downtick, and Zero Tick
| Previous to Last Price | Last Price | Current Price | Term |
|---|---|---|---|
| 72 | 72 | 72.10 | Uptick |
| 72 | 72 | 71.90 | Downtick |
| 72.10 | 72 | 72 | Zero Downtick |
| 71.90 | 72 | 72 | Zero Uptick |
On certain exchanges, short sales are permitted only on an uptick or a zero uptick. This is because sustained short-selling in a declining price environment can cause the market to crash.
NOTES
- 1 Quite obviously, they stand to gain by way of a saving in brokerage commissions.
- 2 In this case we are talking about shares being issued for a monetary consideration.
- 3 See Simmons and Dalgleish (2006).
- 4 While this is true in general, there could be periods where the firm decides not to pay a dividend.
- 5 Remember that we would have 4,000 shares of 3M after the split.
- 6 Because of the 50% margin requirement, he can borrow an amount up to the funds at his disposal.
- 7 Remember, the securities have been pledged as collateral by the investor.