CHAPTER 4
Argue with the Data
“The combination of some data and an aching desire for an answer does not ensure that a reasonable answer can be extracted from a given body of data.”
—John Tukey, famous statistician
As you become a Data Head, your job is to demonstrate leadership in asking questions about the data used in a project.
We're talking about the underlying raw data—the raw material—from which all statistics are calculated, machine learning models built, or dashboard visualizations created. This is the data stored in your spreadsheets or databases. If the raw data is bad, no amount of data cleaning wizardry, statistical methodology, or machine learning can hide the stench. Therefore, we can best summarize this chapter with a phrase you may have heard before, “garbage in, garbage out.” In this chapter, we lay out the types of questions you should ask to find out if your data stinks.
We have identified three main prompts or questions to ask to help you argue with the data. Within those questions we offer additional follow-up questions.
- Tell me the data origin story.
- Who collected the data?
- How was the data collected?
- Is the data representative?
- Is there sampling bias?
- What did you do with outliers?
- What data am I not seeing?
- How did you deal with missing values?
- Can the data measure what you want it to measure?
In the sections that follow, we'll present each question, why you should ask it, and what issues it often uncovers.
Before we do that, however, let's begin with a thought exercise.
WHAT WOULD YOU DO?
You are in charge of a high-profile project for a tech company on the verge of a breakthrough in the self-driving car industry. It's an important moment for you and your work, not to mention your career. The success of your product demonstration would mean the fulfillment of many late nights, overly optimistic promises made to executives, forgiveness of project delays, and making good on those big budget research and development dollars you begged for.
And it's the night before the reveal of a new prototype automobile.
Senior executives, dozens of employees, potential investors, and media have traveled hundreds of miles to see what could be a pivotal moment in automobile history. But late in the evening, your senior engineer reports that tomorrow's forecast is a freezing 310 Fahrenheit. The engineer tells you that cold temperatures could compromise vital components of the car's innovative prototype self-driving system. It's not that they know for sure there could be an issue. Rather, the system—which will eventually be adapted to and stress-tested in freezing temperatures—simply hasn't been tried in the cold yet, and the demonstration is at risk for a very public and costly disaster.
But the risks of postponing are also costly. An event like this, if it doesn't happen tomorrow, is not easy to reschedule. It could be months before conditions are once again perfect. Your company has spent the better part of the last year creating excitement for this very moment. If it doesn't happen tomorrow, the excitement might never be this good.
You ask to see the data behind the engineer's concern—that temperature might compromise the car's internal components—and you're presented with the data shown in Figure 4.1.
Your engineer explains that the company has performed 23 test drives at various temperatures, and seven of them (shown in the figure) had incidents in which a critical part of the self-navigation system became distressed. Two of the test drives had two critical part failures.

FIGURE 4.1 Plot of test drives with critical component failures as a function of temperature
Indeed, your engineers have considered the chance of component failure. That's why they created a redundancy. Each system has six critical parts (which is why the vertical y-axis on the chart goes to 6). Having backup parts means several can break before the entire car stops in failure. In 23 test runs, never has more than two components failed—and never has this caused an issue to the car's usability. Both of these cases, which happened at 530F and 750F, did not stop the car from running. The lowest temperature at which the test was conducted was 530F; the highest was 810F.
“Still, we just haven't tested the system at colder temperatures,” say the engineers on your team. You hear their concerns.
As much as you try to see it, temperature doesn't seem to influence part failure except that they happened at temperatures well above 30 degrees. It's hard to picture a scenario where cold temperatures would impact more than two out of the six parts given the data being shown in the context of the 23 trial runs. And the car can run on four critical parts. If there is a failure tomorrow of two parts at most, would the world even know?
What would you do? Postpone?—or, proceed as scheduled?
Take a moment. Are there any missing data points you might want to consider?
Missing Data Disaster
On January 28th, 1986, with the world watching, NASA launched the space shuttle Challenger from the Kennedy Space Center in Florida in freezing temperatures.
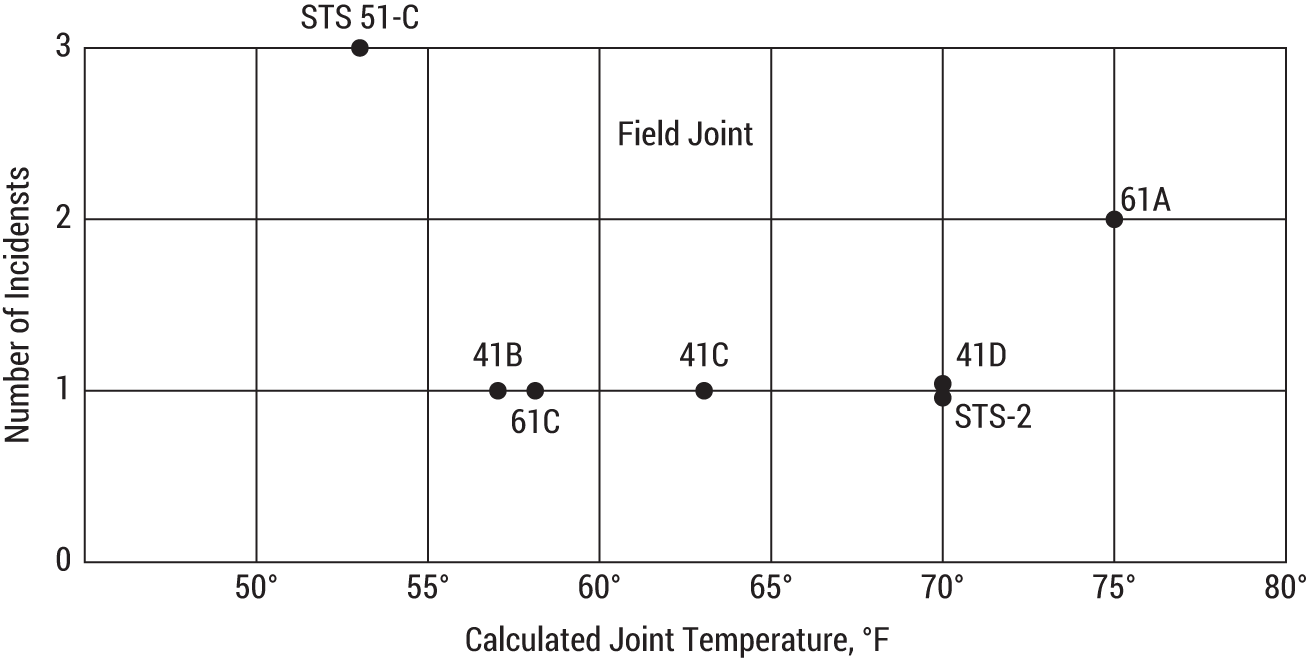
FIGURE 4.2 Plots of flights with incidents of O-ring thermal distress as a function of temperature. This figure is from the Report of the Presidential Commission on the Space Shuttle Challenger Accident.
Many of us know this part of the Challenger story. But we might not know the data story that was behind it. In fact, the Challenger had also had six critical parts known as O-rings, which “prevent burning rocket fuel from leaking out of booster joints.”1 There had been seven incidents of distressed O-rings in 23 trial runs leading up to the launch date.
Does this scenario sound familiar?
NASA faced the same quandary the night before as you did in your thought exercise. According to the Rogers Commission report (which was commissioned by President Ronald Reagan after the Challenger accident), a meeting took place the night before launch to discuss the issue.
The managers compared as a function of temperature the flights for which thermal distress of O-rings had been observed—not the frequency of occurrence based on all flights [Figure 4.2].2
“In such a comparison,” the report noted, “there is nothing irregular in the distribution of O-ring ‘distress’ over the spectrum of joint temperatures at launch between 53 degrees Fahrenheit and 75 degrees Fahrenheit.”

FIGURE 4.3 Plots of flights with incidents of O-ring thermal distress as a function of temperature including trial runs with no incidents. This figure is from the Report of the Presidential Commission on the Space Shuttle Challenger Accident.
NASA went ahead with the launch, based on their review of these failures. But on the day of the launch, the O-rings failed to seal properly in the unusually cold conditions, and the shuttle broke apart 73 seconds into its flight, killing all seven astronauts aboard.
Can you think of any data they missed?
What about the 16 test runs with no failures? Figure 4.3 shows the additional test runs, documented in the Rogers Commission.
Going back to the thought exercise—would you have thought to ask for the missing data? If you had—and perhaps gave it to statisticians to review—you might have seen there was an underlying trend predictive of part failure at lower temperatures. Figure 4.4 shows the trial runs of our autonomous automobile example, including those did not result in critical failures.

FIGURE 4.4 Plot of test drives with and without critical component failures as a function of temperature. The fitted line is a binomial regression model.
Statisticians, engineers, and researchers have studied the Challenger data3 in the decades that followed. And we wanted to present to you a real-world scenario to show that these are the questions data workers must face. One article, published in the Journal of the American Statistical Association (JASA), a leading statistics journal, originally presented the analysis we re-created in Figure 4.4 predicting five out of the six primary O-rings could fail in freezing temperatures. This chart used the data not originally considered the night before launch. The article makes the case that “statistical science could have provided valuable input to the launch decision process.”4
Would you have wanted to see this same chart the night before?
The Challenger story offers a chilling scenario of a common phenomenon: that we often look at data that appears to encode the information we need while discarding data we assume wouldn't be relevant. Indeed, we must admit that few situations will ever be as dire as the Challenger scenario. Because so much was at stake, the Challenger scenario serves as an important story that has an immediate and obvious impact.
We don't want to speculate that if only they looked at the full dataset, they would have made the right decision. There is really no way to know this. Other factors were surely at play. Rather, we just want to point out that there are often stories to uncover when we further argue with the data.
And to that extent, the story the Challenger tells is clear. Most businesses don't argue with their data. Instead, they have a culture of acceptance. The effect of this is a slow burn where data projects continue to fail without important questions being asked during the project.
With that, we return to this chapter's goal of teaching you how to argue with the data and what questions to ask.
TELL ME THE DATA ORIGIN STORY
All data starts somewhere. We shouldn't take for granted its origins. So, we suggest you ask, “What is the origin of this data?”
We like this question because it's an open-ended and quick way for you to judge if the underlying raw data aligns to the question being asked of it, and it doesn't require mathematical or statistical knowledge to answer. More important, we believe the question itself creates a sense of openness and builds trust (or creates doubt) to the results that follow.
Listen carefully to the answer for potential issues of correctness and integrity stemming from the person or organization who created the data.
In particular, you are probing for answers to the following questions:
- Who collected the data?
- How was the data collected? Is it observational data or experimental?
Who Collected the Data?
When asking who collected the data, we're looking first to establish exactly where the data originated and second, if there are any issues surrounding its origin that would make us ask more follow-up questions.
Many large companies take for granted their data was collected by an internal resource. For instance, a company using workforce data—that is, data based on surveys and associated information of its own employees—might actually be using data owned and collected by a third-party vendor. That last mile of consumption of this data might happen through a portal owned by the company, giving the appearance that the data was collected and is owned by the company, even when it isn't.
In particular, we want you to identify exactly who collected the data. As a Data Head, you must question if external data is reliable and relates to the business problem at hand. Most third-party data is not readily usable in the format it's given to businesses. You, or someone on the data team, will be responsible for transforming the data from a third party into the right structure and format to align with the unique data assets in your company.
How Was the Data Collected?
You should also probe for how data was collected. This question will help uncover if conclusions are being made about the data that aren't allowed. It will also present to you if there are underlying ethical issues with the data collection.
Recall, there are two basic data collection methods: observational and experimental.
Observational data is collected passively. Think website hits, class attendance, and sales numbers. Experimental data is collected under experimental conditions with treatment groups and time-tested precautions to maintain integrity and avoid confounding. Experimental data is the gold standard. Because of the care the experiment provides to ensuring the results are reliable, this data presents an opportunity upon which to derive some causal understanding. For instance, experimental data can help answer the following questions:5
- If we give the patient a new drug, will it cure the disease?
- If we discount our product 15%, will it boost next quarter's sales?
Most business data, however, is observational. Observational data should not be used (at least, not exclusively) to derive causal relationships.6 Because the data was not collected with specific care toward an experimental design, the usefulness of the data and its underlying results must be presented within this context. Any claims of causality with observational data should be met with skepticism.
Asking how the data was collected will help you uncover whether causality has been assigned when it was not possible to do so. In fact, the incorrect assignment of causality is enough of a problem that we'll return to it several times throughout this book.
It sounds simple enough to use experimental data whenever you can, but to add to the never-ending complexities of working with data, it's not always possible, cost-effective, or even ethical to collect experimental data. For example, if you were assigned to study the impact of “vaping” (smoking electronic cigarettes) on teenagers, you can't randomly assign teens to a treatment and control group and force the treatment group to vape in the name of science. That's not exactly ethical.
As a Data Head, you must work with the data you have while also mediating its ability to drive business decisions. Some companies and departments have the resources to follow up promising observational data with solid experiments. And yet, other business problems do not easily lend themselves to experiments.
IS THE DATA REPRESENTATIVE?
You need to make sure the data you have is representative of the universe you care about. If you care about shopping habits of teenagers in the United States, the dataset you have ought to be representative of the larger universe of all teenagers' shopping habits in the country.
Inferential statistics exists precisely because we rarely, if ever, have all the data we need to solve a problem. We're forced to rely on samples.7 But if the sample fails to be representative of what you care about, any insight you gain from the sample will not reflect the reality of the larger universe.
Here are targeted questions to ask to see if your data is representative:
- Is there sampling bias?
- What did you do with outliers?
Is There Sampling Bias?
Sampling bias happens when the data you have is consistently off or different from the data you care about. Sampling bias is often uncovered indirectly after many decisions have been made on data that is poorly representative of the problem it exists to support. It's only after those decisions continually fail to achieve what is predicted by the data do analysts go back and review if the data was the right data in the first place.
If you want to find out a politician's approval rating and only poll from voters in their political party, you have introduced sampling bias into your data. Good experimental design manages the potential for sampling bias.
In your own work, you may be faced with inherently biased data. Observational data, in particular, is susceptible to bias. The “why was this data collected?” question should uncover why the data exists for your use. Rarely has thought been put into this data to ensure it is free from bias.
You should treat all observational data as inherently biased. You don't need to throw this data out, but you must always present it within the context of its shortcomings.
What Did You Do with Outliers?
Imagine looking at a company's salary data and seeing the number $50,000,000 USD for a new hire in a management role. Would you describe this as an outlier? What would you do with it?
Outliers are defined as data points that differ significantly from other data points. The discovery of outliers should spark a discussion about which data should be rationally excluded from the analysis. Not liking what an extreme value does to an analysis does not automatically mean it should be deleted. For a data point to be removed, have good business justification for removing it.
Arbitrarily picking and choosing which data points are outliers can introduce sampling bias. If outliers are dropped, the original data point and reason for dropping it should be documented and communicated, especially if the results changed substantially.
WHAT DATA AM I NOT SEEING?
Data that's missing either hasn't been recorded (it has no origin) or you just haven't looked at it yet. Consider the following examples:
- Data representing the underemployed is not considered in the unemployment rate.
- A mutual fund company “retires” poor performing mutual funds, making the long-term return of the remaining funds appear greater on average.
- 16 out of the 23 data points from shuttle flights were missing in the Challenger story.
It's worth thinking about information that hasn't been encoded in the data you can see. Play the detective.8
How Did You Deal with Missing Values?
Missing values are literal holes in a dataset. They represent data points that weren't collected, or may be outliers that were removed (see previous section). Although missing values are a challenge, there are methods to address them. So, it's always worth asking “How did you deal with missing values?”
Suppose you work for a credit card company and you collect data from credit card applicants: name, address, age, employment status, income, monthly housing costs, and number of bank accounts owned. Your job is to predict if these applicants will be late on payments in the next year. Several applicants, however, do not enter their income. So, the system stores it as a blank—a missing value.
Let's go back to the data's origin story. The story starts with applicants applying for a credit card. It's possible the applicant didn't provide their income because they thought they would be denied a credit card if their income was too low. This means the very presence of a missing value might be predictive to whether the application may have a late payment in the future. You don't want to throw out this information!
With this additional insight, a data scientist could create a new categorical feature call “Income Present?” and enter the value 1 if the person entered their income and a 0 if they did not. In this way, you've reencoded missing data into its own categorical variable.
Can the Data Measure What You Want It to Measure?
We often believe we can measure anything and everything. But you should evaluate whether the data provided can truly measure complicated ideas. Consider, for example, the following:
- How would you measure your client's loyalty to your business?
- What data would you use to measure “brand equity” or “reputation?”
- What data can show how much you love your child? Or your pet?
These are hard things to measure. Data, by way of encoding information, enables us to get closer to these answers, but by and large the data we use is truly proxy—a stand in, as it were—for the thing we're trying to measure. The degree to which the proxy reflects reality varies.9
To the extent your data indirectly measures something, you should be truthful and honest about it. Measuring complicated concepts like brand equity and reputation require indirect approximations, as these things are truly hard to measure.
ARGUE WITH DATA OF ALL SIZES
It's easy to think getting more data would overcome inherent issues in working with sample data. The larger the sample, the more reliable—this is a misunderstanding in statistical thinking. If the data is collected properly, a larger sample will help, but if the data has bias, additional data can't save you.
And thus the short-lived hype around Big Data suggested that more data could itself create more scientific rigor by virtue of volume. Don't think a dataset is too big to argue with. Statistics doesn't have an absolute data-size threshold, that when passed, a sample no longer contains bias. Statistics deals in the tradeoffs between what you ultimately want to know with the data you have.10
CHAPTER SUMMARY
We opened the chapter with details of the Challenger accident but put you in the driver's seat. As we pointed out at the start of this book, data mistakes are made by smart people. People and organizations can and do make mistakes.
That's why we presented you with questions you should ask and the various issues these questions uncover. We want you to use these questions to dig deeper into the issues surrounding your data. You may come up with additional questions of your own. We strongly encourage you to share your questions with the rest of your team, so that you are aligned. Data Heads demonstrate their ability to cut through data by setting an example and asking the tough questions on an ongoing basis.
NOTES
- 1 Quote from NRP article. “Challenger engineer who warned of shuttle disaster dies.” www.npr.org/sections/thetwo-way/2016/03/21/470870426/challenger-engineerwho-warned-of-shuttle-disaster-dies
- 2 Quote from Report to the President by the Presidential Commission on the Space Shuttle Challenger Accident. Page 146. Available online at spaceflight.nasa.gov/outreach/SignificantIncidents/assets/rogers_commission_report.pdf.
- 3 The data is available for download from the University of California, Irvine, Machine Learning Repository: archive.ics.uci.edu/ml/datasets/Challenger+USA+Space+Shuttle+O-Ring
- 4 Dalal, S. R., Fowlkes, E. B., & Hoadley, B. (1989). Risk analysis of the space shuttle: pre-Challenger prediction of failure. Journal of the American Statistical Association, 84(408), 945-957.
- 5 Note that these are the types of business questions you should be asking before you start a data science project, as outlined in Chapter 1.
- 6 There are clever ways to use observational data to suggest some causal relationships. It relies on strong assumptions and clever statistics. There is a field dedicated to this study called Causal Inference.
- 7 If you can collect every observation in a population or universe you care about, that's called a census.
- 8 We'll come back to this idea in a later chapter when we discuss “survivorship bias.”
- 9 Manufacturing, engineering, and research organizations should also consider studies to determine the repeatability and reproducibility of data measured by technical equipment.
- 10 Statisticians think a lot about the right sample size to collect, something called power that we'll discuss in Chapter 7.